Introduction
Polar ice cores have proven to give valuable records of climatic change (e.g. Dansgaard and Oeschger, 1989; Mayewski and others, 1994). Glaciochemical studies are of importance for obtaining proxy atmospheric data, since direct atmospheric measurements are rare and limited in time (e.g. Legrand and Mayewski,1997). Glaciochemical records in snow and ice are affected by sources strength, transport pathway, and distribution of chemical species in the atmosphere (e.g.Mayewski and others, 1993). Thus, variations in air and sea temperature, precipitation patterns, sea-ice condition, winds, ocean currents, the concentration and the nature of oxidants present in the atmosphere, etc., can affect the chemical-species concentration (e.g. O’Dwyer and others, 2000).
Methanesulfonate (CH3SO3 –, MSA) in the polar snow and ice has been extensively studied because it makes a significant contribution to the sulfur cycle in the marine atmosphere (Bates and other, 1992). It is known that MSA and SO2 (further oxidized to SO4 2–) are the two major oxidation products (Hatakeyama and others, 1985) of dimethylsulfide (DMS), which is emitted by the metabolism of some species of marine phytoplankton in the ocean (Andreae and Barnard, 1984; Welch and others, 1993; Groene, 1995). Moreover, MSA appears to be exclusively derived from the oxidation of DMS. Thus,MSA in ice cores has been used as a proxy indicator of biological production in the Southern Ocean (Saigne and Legrand, 1987). However, the distribution of MSA over the marine oceans exhibits regional and seasonal variations (Saltzman, 1995). Hence, MSA variation in the ice core may reflect the atmospheric oxidant processes. Previous studies (Legrand and Feniet-Saigne, 1991; Welch and others, 1993; Whung and others, 1994; Pasteur and others, 1995; Legrand and others, 1997; O’Dwyer and others, 2000) of polar ice cores suggested that MSA concentrations were related to sea ice extent and sea-surface temperature (SST). Welch and others (1993) found a positive relationship between MSA in a snow pit on Newall Glacier (a coastal Antarctic site) and the sea-ice area of the Ross Sea over the previous two decades. High MSA concentrations in a South Pole firn core are closely correlated to low-latitude climatic events such as the El Niño– Southern Oscillation (ENSO) (Legrand and Feniet-Saigne, 1991). However, the MSA records in ice cores drilled on Dolleman Island on the eastern coast of the Antarctic Peninsula show a small and significant anticorrelation with sea-ice duration recorded at Scotia Bay, Laurie Island, South Orkney Islands, over the last century, and no significant link with El Niño events over the last 340 years (Pasteur and others, 1995). In the Northern Hemisphere, Whung and others (1994) found a negative correlation between the MSA anomalies of the southern Greenland 20D core and North Atlantic SST for the period 1850–1984. Legrand and others (1997) found a negative correlation between central Greenland MSA and Greenland SST, and a positive correlation with sea ice. High MSA concentration in Svalbard, however, is found to be associated with warm SST and reduced sea-ice extent (O’Dwyer and others, 2000). Over the full glacial cycle, the MSA record from the Renland ice core, Greenland, was characterized by low MSA concentration and low molar ratio of MSA to non-sea-salt sulfate in glacial conditions (Hansson and Saltzman, 1993), while the Vostok (Antarctica) ice core exhibits the opposite trend (Legrand and others, 1991). It would appear that the MSA record from different regions is affected mainly by different climatic parameters. Here, we examine the MSA record for the period 1933–92 in a firn core taken from LGB16 in the Lambert Glacier basin, East Antarctica (Fig. 1). We focus mainly on the temporal variability and trend of MSA concentration and its relationship with sea-ice extent and ENSO events.
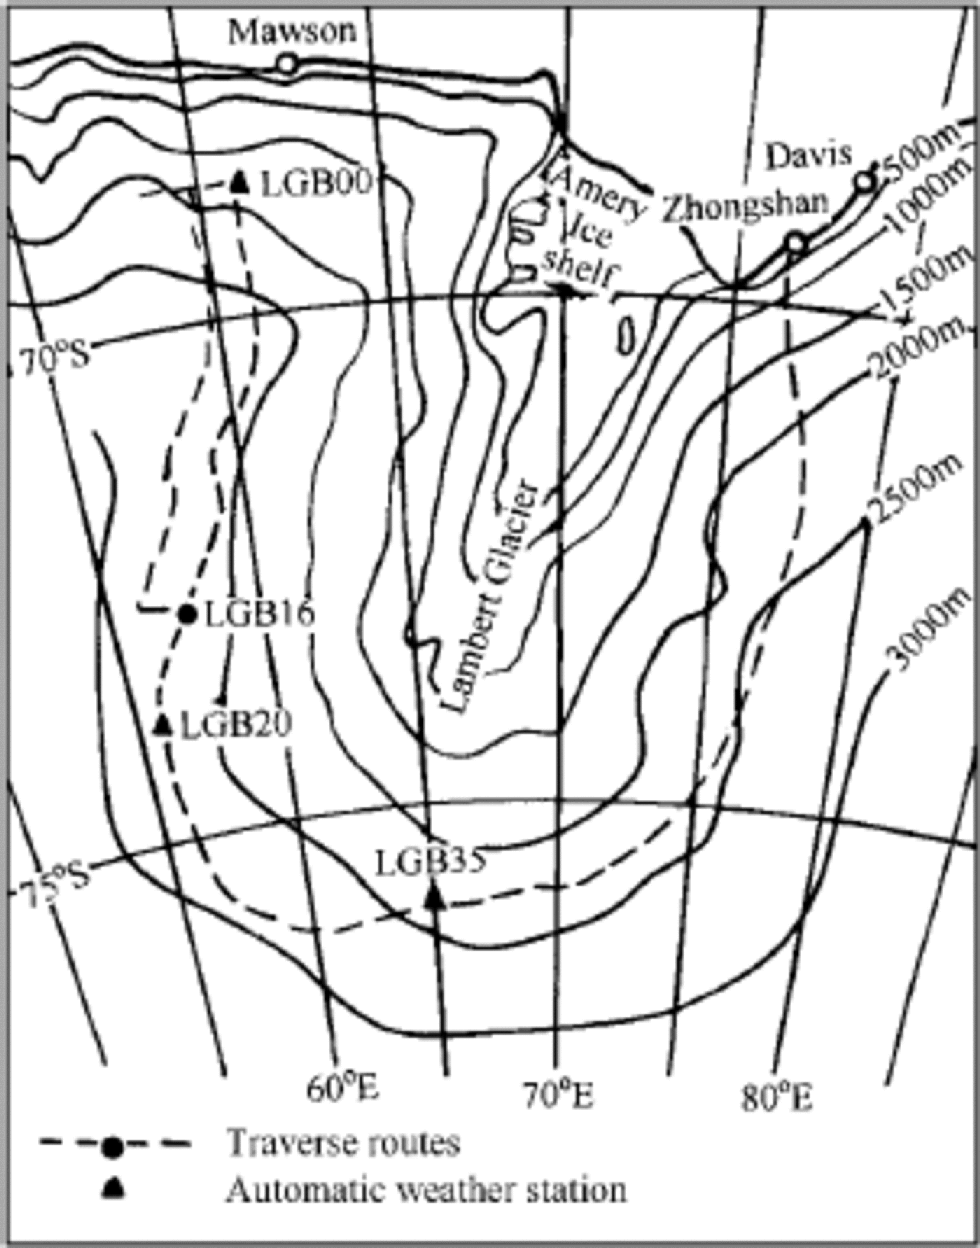
Fig. 1 Map of Lambert Glacier basin showing traverse routes and sampling sites.
Sampling Sites and Analytical Procedure
A 15.2 m firn core was recovered using a Polar Ice Coring Office (PICO) hand auger on 12 January, and a 2.7 m snow pit was excavated on 13 January 1993 at LGB16 (72.8˚ S, 57.3˚ E) in the Lambert Glacier basin (Fig. 1) (Ren and others, 1998). the sampling site is located about 650 km from the coast, at approximately 2690ma.s.l. the mean snow accumulation was 110 kg m–2 a–1 (corresponding to 25.7 cm snow a–1) from the 1989–94 cane measurements, and the 10 m firn temperature was approximately –42.9˚C. the prevailing winds at this location are of continental origin, predominantly from the south. the annual wind speeds are about 7–8ms–1, which is substantially less than on the coast (about 10–12ms–1) (Higham and Craven, 1997). to prevent samples from being contaminated, pre-cleaned gloves and a mask were worn. the stratigraphic profile was first observed when the snow pit was dug, and then the leeward wall of the snow pit was scraped clean for sampling. the snow pit was sampled at 3 cm intervals, resulting in around eight samples per year. Samples were directly collected into pre-cleaned polyethylene containers. Visible stratigraphy, density measurement and electrical conductivity measurements (ECM) were performed on the firn core, which was then cut into depth intervals of 3 cm. Firn core samples were placed in the pre-cleaned polyethylene bags. the upper 2 m firn core samples were left at the Antarctic CRC, University of Tasmania, Australia, for δ18O measurements. Other firn core samples and snow-pit samples were shipped to Lanzhou at –15˚C, and melted immediately before analysis.
Major anions (Cl–, NO3 –, SO4 2–), cations (Na+, NH4 +, K+, Mg2+, Ca2+) and δ18O in core and snow-pit samples were analyzed prior to MSA at the Laboratory of Ice Core and Cold Regions Environment, Chinese Academy of Sciences, Lanzhou (Ren and others, 1998,1999). MSA measurements were made using a Dionex Model DX-300 instrument with an AS11 analytical column, an AG11 guard column, anion self-regenerating suppressor and 0.35 mM sodium hydroxide eluent. As the snow pit and firn core were very close together and there is reasonable agreement between chemistry data from the snow pit and the upper firn core, the upper 2 m of the snow pit are used to create a continuous 15.2 m core record.
The firn core was dated by combining seasonal signal data observed in the isotopic and ECM records and from visible stratigraphy. In addition, the cane measurement data were taken as reference (Ren and others, 1999). the 15.2 m firn core spans about 60 years from 1933 to 1992 (see Fig. 2).

Fig. 2 The records of δ18O, ECMand ice layers with depth in the firn core drilled at LGB16. the time-scale is shown on the top axis.
The sea-ice data were obtained from the U.S. Navy/U.S. National Oceanic and Atmospheric Administration satellite maps of the northern limit of the sea-ice extent. the records of sea-ice extent were compiled by T.H. Jacka and included the distance from the South Pole to the ice edge for every 10˚ of longitude, with one map for each month from 1973 through 1997 (available at http://www.antcrc.utas.edu.au). the sea-ice area for each month was determined by calculating the area for each 10˚ wedge, summing them and then subtracting the continent area. the monthly sea-ice area for the South Indian Ocean sector was determined by using the distance to the ice edge for longitudes 40–90˚E.
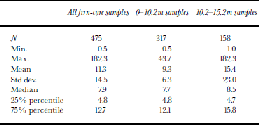
Table 1. Statistical parameters for MSA throughout the firn core and in 0–10.2 and 10.2–15.2 m sections (units are ng g–1 except for sample number N)
Results and Discussion
Table 1 shows the basic statistical data concerning the distribution of MSA in the LGB16 firn core. the mean MSA concentration for the whole firn core is 11.3±14.5 ng g–1 (1σ, n = 475); for the upper 10.2m it is 9.3±6.3 ng g–1 (1σ, n = 317), compared to 15.4±23.0 ng g–1 (1σ, n = 158) for the bottom part. However, the median and 25% percentile value of MSA concentration are similar for the upper and bottom parts. the difference between the mean and the 75% percentile value of MSA concentration suggests that there are more high MSA peaks in the bottom part than in the upper part. Thus, the amplitude of MSA is larger in the bottom part of the firn core than in the upper part, which is reflected in Figure 3. the mean value and the range of MSA concentrations at LGB16 are in good agreement with those measured in South Pole snow for 1922–80 (Legrand and Feniet-Saigne, 1991), at the Filchner–Ronne Ice Shelf (Minikin and others, 1994) and in northernVictoria Land (Udisti, 1996). However, the LGB16 MSA concentrations are much lower than those recorded in snow at Dolleman Island (Mulvaney and others, 1992), but higher than those in snow/ice at Dome C and Vostok during the Holocene (Legrand and others, 1991).
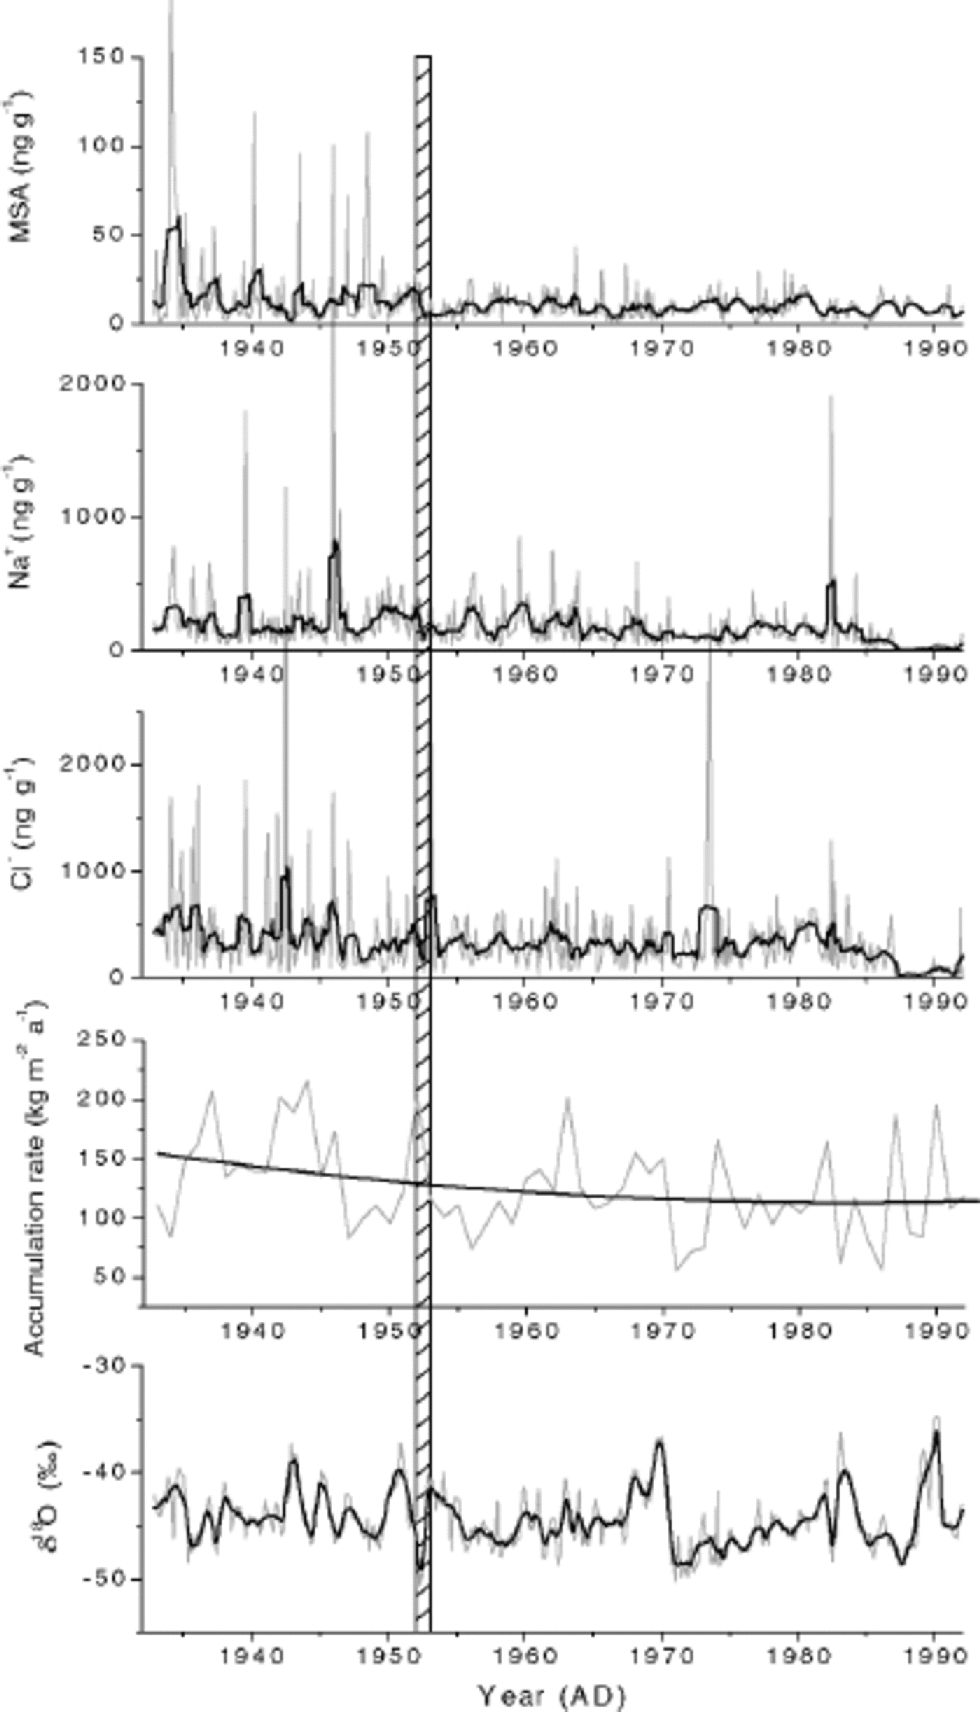
Fig. 3 Profiles of MSA, +,NaCl–, annual accumulation rate and δ18O in the LGB16 firn core. the thin lines are the raw data and the thick lines are curves obtained using seven-point (approximately 1year) running averages. the second-order regression line for the annual accumulation rate is shown. the shadowed area corresponds to AD 1952.
Records of MSA, Cl–, Na+, δ18O and the annual accumulation rate in the LGB16 firn core are shown in Figure 3. the superimposed thick black lines are a seven-point (approximately 1year) running mean of the raw data for MSA, Cl–, Na+ and δ18O, the second-order regression line for the annual accumulation rate. the 60 year MSA record shows a decreasing trend from 1933 to the present, and displays a sharp difference between the upper 10.2 m (corresponding to AD 1952) and the bottom part. This trend is consistent with the records of Cl– and, to a lesser extent, Na+ in the LGB16 core. As can be seen from Figure 3, the background value of MSA, Cl– and Na+ appears to be unchanged during the past 60 years. However, many more peaks exist before 1952 than after. High spikes are normally due to episodic events, which suggests that atmospheric transport capacity was stronger before 1952. A similar conclusion is drawn from the records of dust, formate and acetate concentration in firn core from Hercules Névé, northern Victoria Land (Maggi and Petit, 1998; Udisti and others, 1998).
The annual accumulation-rate record from 1933 to 1992 is also shown in Figure 3. the calculated second-order regression line confirms the continuous decrease from the 1930s to 1970s and slight increase up to 1992. This is consistent with the accumulation-rate changes seen in the ice core drilled in the coastal area of Dronning Maud Land (Isaksson and others, 1996) and of northern Victoria Land (Maggi and others, 1998). This further confirms that the intensity of the oceanic air-mass intrusion generally decreases from the 1930s to the 1970s and then increases.
To evaluate the significance of changes in precipitation rate for MSA trends, we have calculated the annual depositional flux of MSA (in μgm–2 a–1) from the product of the annual MSA concentration and annual accumulation rate (Fig. 4). the variation in MSA flux is similar to trends in MSA concentration. Figure 4 also shows that there is a linear relationship between annual accumulation rate and annual depositional MSA flux, and the y intercept, reflecting the contribution of dry deposition, is small. This suggests that the main deposition process is wet deposition for MSA, which is consistent with results from Greenland (Davidson and others, 1996; Saltzman and others,1997) and model and experimental estimates for coastal Antarctica (Wolff and others, 1998).
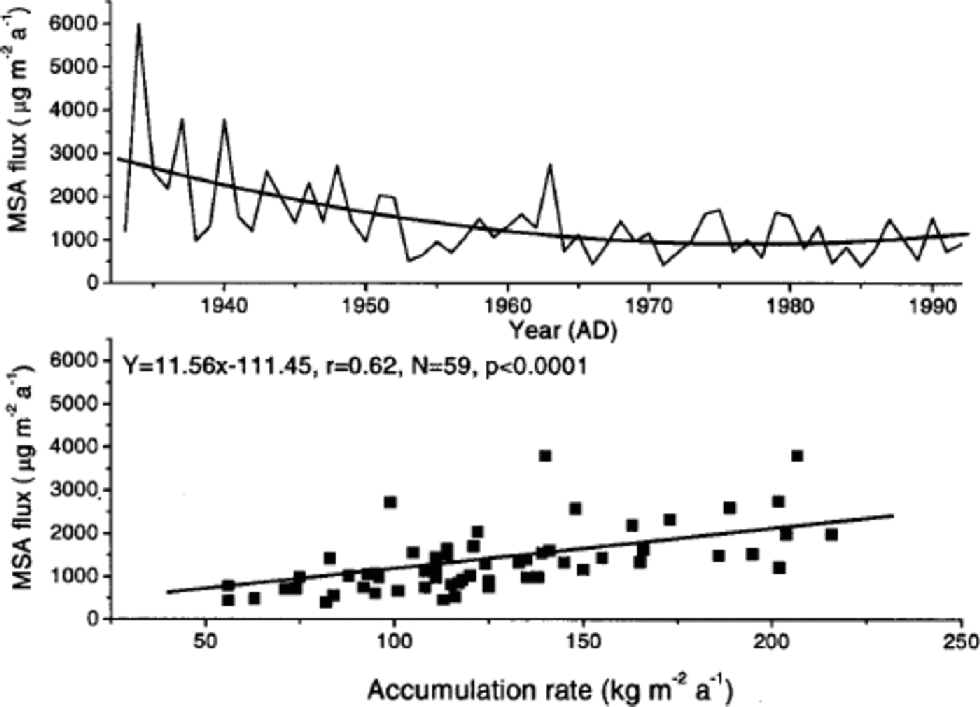
Fig. 4 Profiles of the annual depositional flux ofMSA with the second-order regression line, and the relationship between annual depositional flux ofMSA and annual accumulation rate with the first-order regression line.
Comparison of the MSA record with that of δ18O (Fig. 3) shows that there is no obvious correlation between local temperature at LGB16 and MSA concentration if δ18O can be used as a proxy of local temperature at this location. However, intercomparison of the 1973–92 annual mean MSA concentration and the annual sea-ice record for the South Indian Ocean sector between 40˚ E and 90˚E shows a negative correlation (Fig. 5). the correlation coefficient is –0.34, which is significant at confidence level 95%, and there is no relationship between the mean annual MSA concentration and the mean annual sea-ice areas for the whole Southern Ocean ![]() The anticorrelation of MSA concentration and sea-ice extent in the South Indian Ocean sector suggests that high MSA concentrations are associated with reduced ice extent. the seven-point running mean of the raw data for MSA, Cl– and Na+ shows that MSA is positively correlated to Na+
The anticorrelation of MSA concentration and sea-ice extent in the South Indian Ocean sector suggests that high MSA concentrations are associated with reduced ice extent. the seven-point running mean of the raw data for MSA, Cl– and Na+ shows that MSA is positively correlated to Na+
![]() and Cl–
and Cl–
![]() But Na+ and Cl– do not show a significant correlation either with annual sea-ice record for the South Indian Ocean sector between 40˚E and 90˚E or with the mean annual sea-ice areas for the whole Southern Ocean. A possible link between the 1973–92 annual mean MSA concentration and the annual sea-ice record for the South Indian Ocean sector between 40˚ E and 90˚E remains unproven. More work is needed to elucidate this relationship.
But Na+ and Cl– do not show a significant correlation either with annual sea-ice record for the South Indian Ocean sector between 40˚E and 90˚E or with the mean annual sea-ice areas for the whole Southern Ocean. A possible link between the 1973–92 annual mean MSA concentration and the annual sea-ice record for the South Indian Ocean sector between 40˚ E and 90˚E remains unproven. More work is needed to elucidate this relationship.
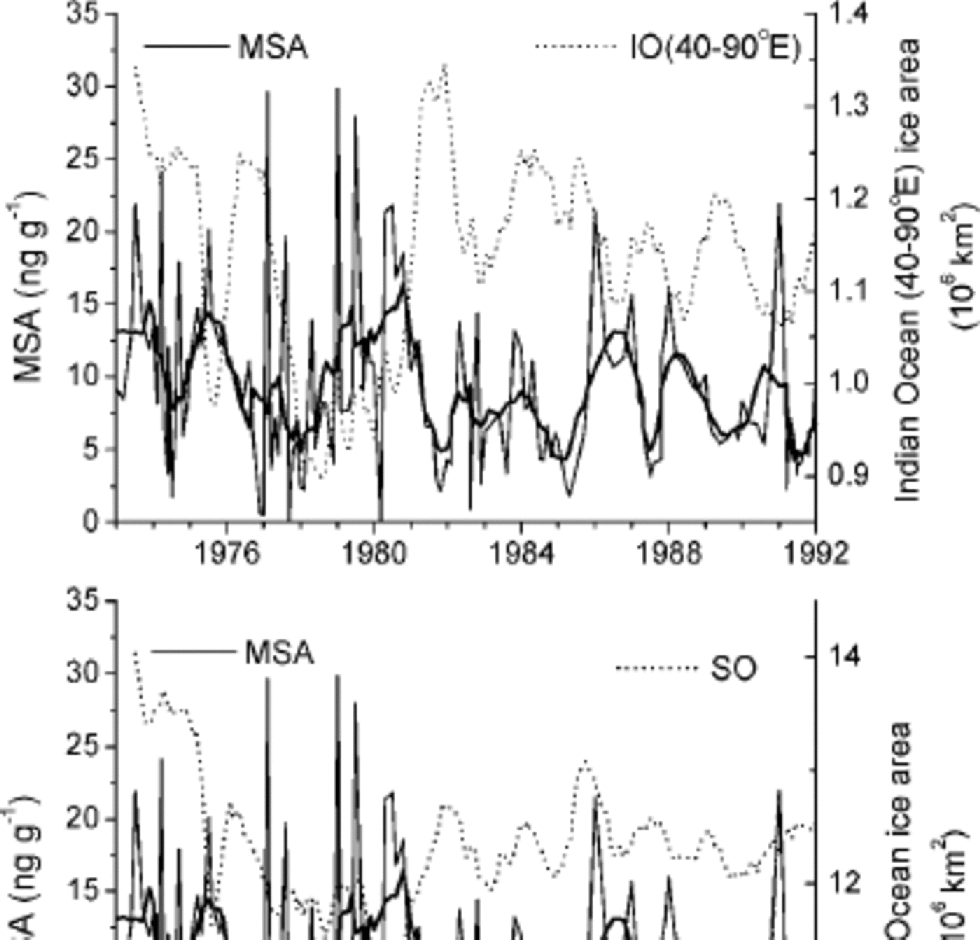
Fig. 5 MSA concentrations and sea-ice areas for the Southern Ocean and the South Indian Ocean sector between 40˚ E and 90˚ E vs time. Since the amplitude of the seasonal change in sea ice is much larger than the year-to-year variability, records of sea-ice area were smoothed using a 12 month running mean. the superimposed thick curves ofMSA were smoothed using a seven-point (approximately 1 year) running mean.
ENSO events during the period 1932–87, compiled by Quinn and others (1987), are shown in Figure 6. Although events are characterized as very strong (VS), strong (S) and moderate (M), there is no obvious correlation between El Niño events and MSA concentration at this site. This is consistent with the MSA record from Dolleman Island (Pasteur and others, 1995), but unlike the results from South Pole firn cores where the high MSA concentrations appear to be related to the major El Niño events (Legrand and Feniet-Saigne, 1991).
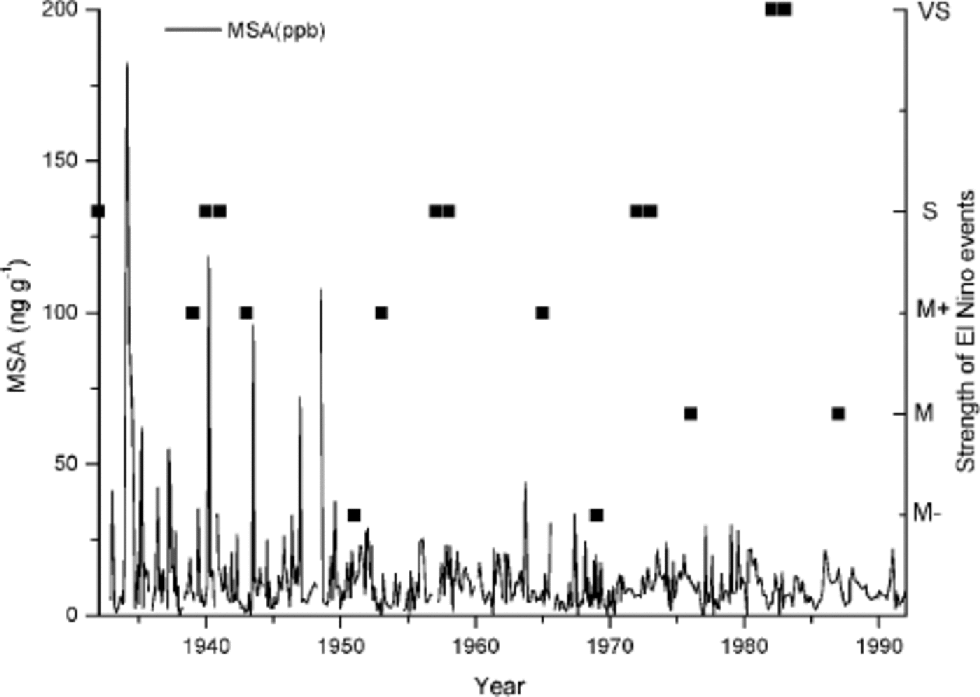
Fig. 6 Comparison of MSA concentration in the LGB16 and the reported El Niño events during the period 1932–87.
Conclusion
The LGB16 core was dated using seasonal signals observed in the isotopic and ECM records and from visible stratigraphy, as well as cane measurements taken as reference. the firn core spanned about 60 years from 1933 to 1992. the 60 years MSA record shows a decreasing trend, and displays a sharp difference between the upper 10.2 m (corresponding to AD 1952) and the bottom part. the greater number of high MSA peaks below 10.2 m suggests that the atmospheric circulation may have changed during the past 60 years in East Antarctica, and that the transport capability was larger in the period 1933–52 than after 1952. the relationship between annual MSA flux and annual accumulation rate suggests the main deposition process is wet deposition. A significant anticorrelation was observed with MSA concentration in the snow and sea-ice area of the South Indian Ocean sector (40–90˚E). But there is no obvious correlation of MSA concentration with strong El Niño events and local temperature at LGB16.
Acknowledgements
We thank the Australia Antarctic Science Foundation and the National Natural Science Foundation of China for providing part support for the authors to join the Lambert Glacier basin traverse expedition and to attend the International Symposium on Ice Cores and Climate, Kangerlussuaq, Greenland, respectively. We also thank M. A.J. Curran and two anonymous referees for valuable suggestions, T. H. Jacka for providing the sea-ice records, and R. Udist. for useful suggestions. Financial support for this research was provided by the Chinese Academy of Sciences (KZCX2-303), the Ministry of Science and Technology, the People’s Republic of China (2001CB711003), the National Natural Science Foundation of China (40071025, 49971021) and the Cold and Arid Regions Environmental and Engineering Research Institute (CACX210046,CACX210506).


