Introduction
Nitrate in ice cores has been the subject of intense research activity for many years, but it is still not fully understood because nitrate has many complex sources and is subject to several post-depositional processes (Reference Wolff and DelmasWolff, 1995). Nitrate sources include continental, atmospheric and stratospheric contributions (Reference Clausen, Langway, Oeschger and LangwayClausen and Langway, 1989). the linkage between gaseous compounds and ice (Reference Honrath, Peterson, Guo, Dibb, Shepson and CampbellHonrath and others, 1999; Reference Laird, Buttry and SommerfeldLaird and others, 1999) is still far from clear. the two precursors to nitrate in ice cores are nitrogen oxide (NO x = NO + NO2) and nitrous oxide (N2O).
In natural systems, NO x is produced mainly at high temperatures (typically by lightning) and from biogenic processes. Only small amounts of NO x come from the stratosphere or are produced by atmospheric oxidation of ammonium (Reference Jaffe, Butcher, Charlson, Orians and WolfeJaffe,1991). Biomass burning, such as in forest fires, does not oxidize substantial amounts of atmospheric nitrogen (Reference Van Loon and DuffyVan Loon and Duffy, 2000) because temperatures are too low. the main anthropogenic nitrogen oxide emission sources are automobile engines and the combustion of fossil fuels. Anthropogenic nitrogen oxide emissions are now about half of global nitrogen oxide emissions each year (Reference Whelpdale and KaiserWhelpdale and Kaiser, 1997).
Nitric acid, the end product of NO x , is rained out either as the free acid or, having reacted with ammonia, as ammonium nitrate (NH4NO3). Concentrations of nitric acid were 25–30% higher than those of aerosol nitrate (Reference Talbot, Vijgen and HarrissTalbot and others, 1992) in the Arctic atmosphere. In ice, the main fraction of nitrate is believed to be in the form of nitric acid, but a small fraction of nitrate is also associated with ammonium in Arctic areas (Reference Legrand, Léopold, Dominé, Wolff and BalesLegrand and others, 1996). It is expected that the nitrate budget originates from a broad geographical area (Reference Mayewski, Lyons, Spencer, Twickler, Buck and WhitlowMayewski and others, 1990) since much of the nitrate precursor is transported as a gas.
Nitrous oxide (N2O) is present in low concentrations in the atmosphere and is growing at a rate of about 0.2% per year due to anthropogenic input (Reference SchnellSchnell, 1986). the main anthropogenic sources are combustion processes and use of nitrogen fertilizers. Oceans and soils are the main natural sources. the present global cycle of nitrous oxide is not well understood (Reference Khalil, Rasmussen, Oeschger and LangwayKhalil and Rasmussen, 1989).
Svalbard is situated in a climatically sensitive area near to the over-turning point of the North Atlantic thermohaline circulation (Fig.1). It is also relatively close to large industrialized regions in northern Eurasia. Precipitation sampling at Ny-Ålesund, Svalbard, since 1980 (Reference Tørseth, Berg, Hanssen and ManøTørseth and others,1999) shows a clear seasonal cycle in nitrate, with much larger concentrations in winter and early spring in direct response to long-range transport of air masses from Eurasia (Arctic haze).
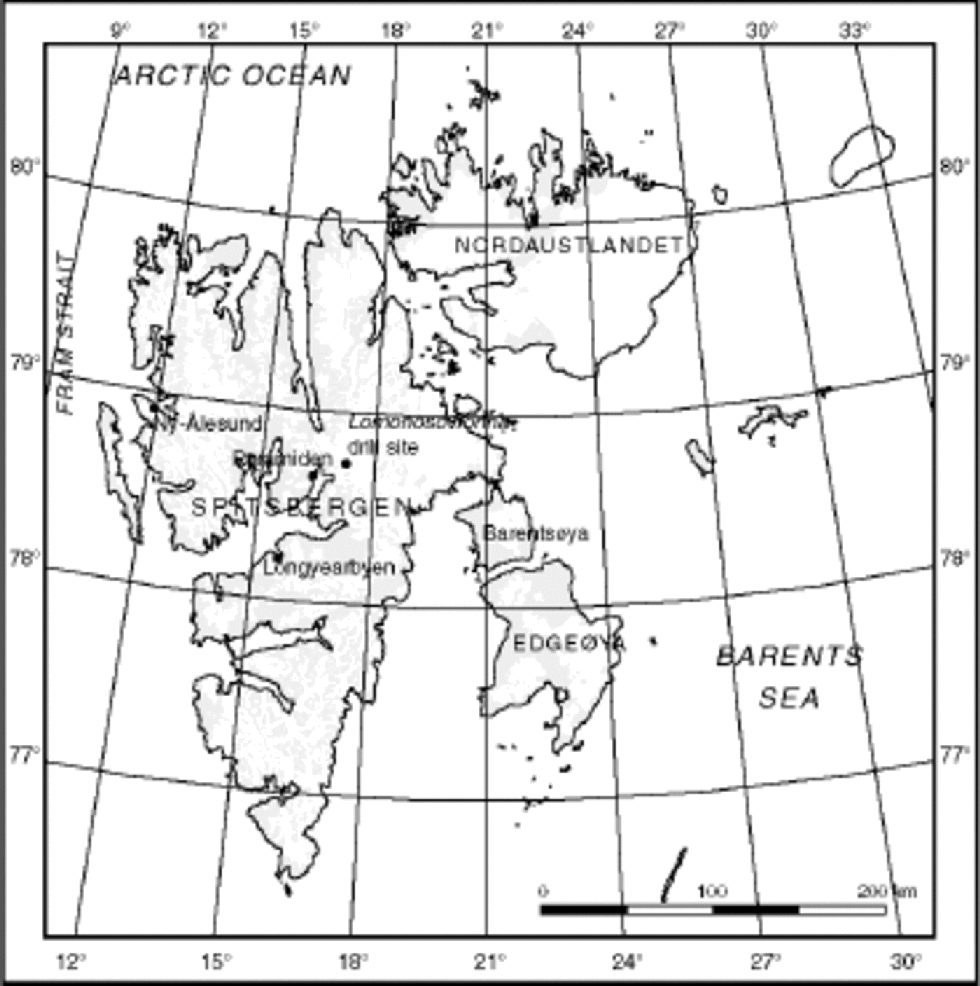
Fig. 1 Map of Svalbard.
Dating and Preservation of the Ice-Core Record
Here we report the results of the nitrate chemical analyses in the 122 m deep ice core spanning the period from the 12th century to 1997. the core was drilled on Lomonosovfonna (Fig. 1), the highest icefield in Spitsbergen (1255ma.s.l.) (Reference IsakssonIsaksson and others, 2001), in spring 1997 by a Dutch–Norwegian–British–Swedish–Finnish team. Total ice depth from radar sounding was 126.5 m, and the site is close to the highest point of the ice cap with roughly radial ice flow. the time-scale of the core was based on counting seasonal cycles in ion concentrations and stable isotopes, and an ice-layer thinning model (Reference NyeNye, 1963) tied with the known dates of prominent reference horizons (1963 radioactive layer and 1783 Laki (Iceland) volcanic sulphate layer). the accumulation rate is 0.41mw.e. a–1 for the 1997–63 period, and is somewhat lower (0.31mw.e. a–1) for the 1963–1783 period. Dating of the core is probably fairly inaccurate in the bottom part of the core since we have used the simple Nye flow model rather than more sophisticated models (e.g. the Dansgaard–Johnsen time-scale (Reference PatersonPaterson, 1994)), as we have no other fixed reference horizons. However, Reference PohjolaPohjola and others (2002) use decompression techniques on the seasonally varying stable-isotope record to derive slightly higher accumulation rates and consequently slightly different ages in the lower core, but here we use the simple dating model. It is also possible that ice flow may have disturbed stratigraphy near the bottom of the core. However, we see no moraine or sediment material in the core that may indicate a basal ice zone in the core, and the physical stratigraphy appears consistent with the higher parts of the core, with no obvious folding of layers.
Studies so far indicate that the core contains a reliable record of isotope and chemical concentrations that can be successfully used in climate studies (Reference Jauhiainen, Moore, Perämäki, Derome and DeromeJauhiainen and others, 1999; Reference O’DwyerO’Dwyer and others, 2000; Reference IsakssonIsaksson and others, 2001; Reference PohjolaPohjola and others, in press). the degree of redistribution of the different chemical species by meltwater seems to be dependent on their physical chemistry (Reference PohjolaPohjola and others, in press). Acids are vulnerable to percolation in the snow-pack (Reference Davies, Vincent and BrimblecombeDavies and others, 1982), but any melt is refrozen mostly within the previous winter’s snow, and the remainder within the next two or three lower annual layers.
Analytical Method
All samples (>1000 in total) were kept frozen during transport and stored in a cold room (–22˚C) at the Finnish Forest Research Institute Research Station in Rovaniemi. Sampling was done in the cold room, and samples were melted just before chemical analyses under a laminar flow hood. Reference Jauhiainen, Moore, Perämäki, Derome and DeromeJauhiainen and others (1999) describe details of core handling, and results from the upper part of the core were presented by Reference IsakssonIsaksson and others (2001). the middle part of the ice core (36–60m) was analyzed in the glaciology clean room at British Antarctic Survey, and the rest of the core was analyzed in Rovaniemi.
Three major anions (Cl–, NO3 –, SO4 2–), five cations (Na+, K+, NH4 +, Mg2+, Ca2+) and methanesulphonate (CH3SO3 –) in the ice core were determined using a Dionex Dx-120 ion chromatograph. Major anion separations were obtained with a Dionex AG9-HC (4650mm) guard column and a Dionex AS9-HC (46250mm) separator column. the volume of the sample loop was 500 μL, and 9 mM sodium carbonate (Na2CO3) eluent was used. Anions were analyzed via suppressed chromatography with a Dionex ASRS-ULTRA suppressor. Cations were analyzed via suppressed chromatography with Dionex CG12 (4×50 mm) and CS12 (4×250mm) columns, 500 μL loop and 20 mM methanesulphonic acid (MSA) eluent. the suppression was provided by a Dionex CSRS-ULTRA suppressor. Methanesulphonate was analyzed via suppressed chromatography with Dionex AG15 (4×50 mm) and AS15 (4×250mm) columns, 2 mL loop and 38mM sodium hydroxide (NaOH) eluent. the chromatographic data were collected and elaborated by Dionex PeakNet integration software.
Results
Trend in nitrate
The nitrate concentration profile for the core is shown in Figure 2a and b. A remarkable feature of the nitrate record is the increase of nitrate concentrations and the rapid rise toward the 20th century. Singular spectrum analysis (SSA; e.g. Reference Vautard, Yiou and GhilVautard and others 1992) using a window of 100 years and significance testing with 1000 statistically similar surrogate series was performed to make robust estimations of non-linear trends. SSA is a statistical technique to extract data from short and noisy time series, and thus provide insight into the unknown (and poorly understood) dynamics of the underlying system that generated the series. It does this by providing data-adaptive filters found by embedding the data in a M -dimension space (the window) using lagged copies of itself. the filters help separate the data into Mstatistically independent components that can be separated into (non-linear) trends, deterministic oscillations (quasi-spectral lines) and noise. the significance of each of the statistical components is addressed using Monte Carlo estimators of the red noise in the time series, allowing selection of the most significant components (a much smaller number than M).
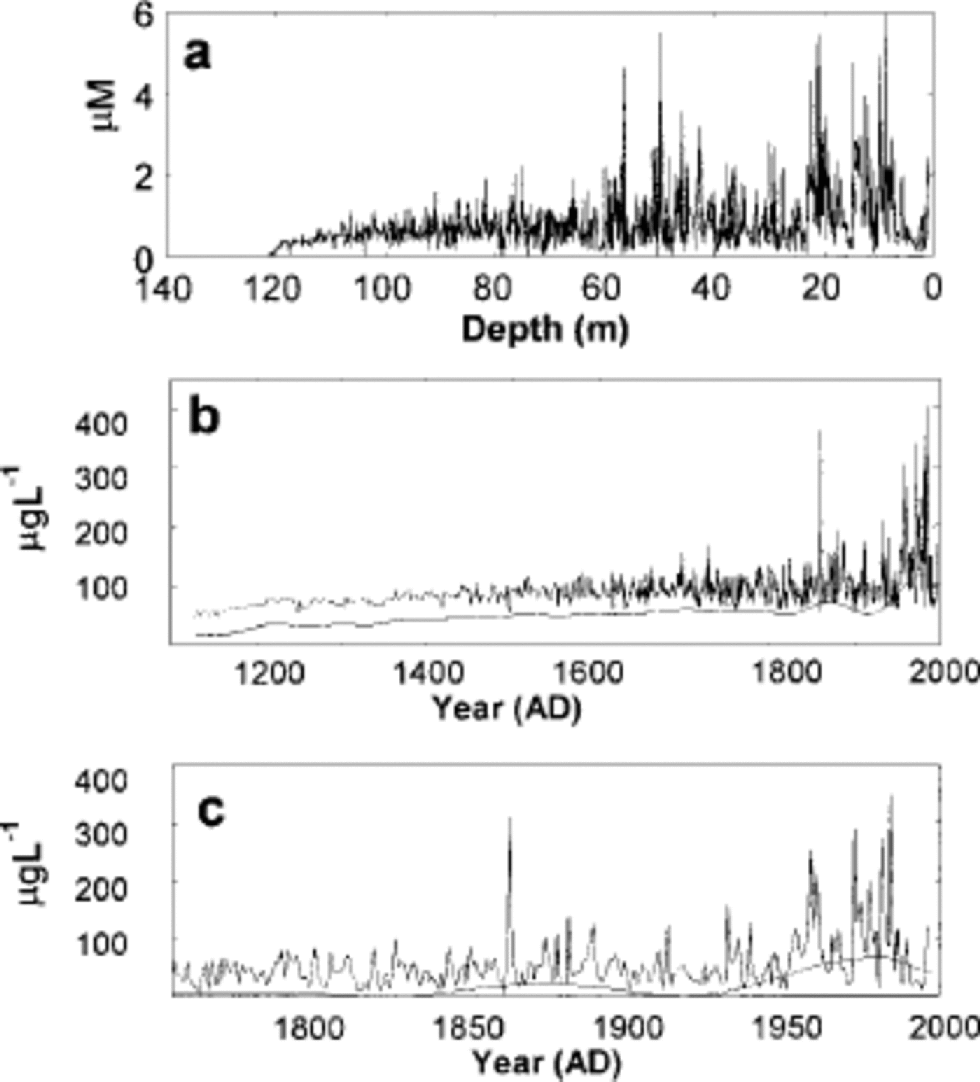
Fig. 2 (a) the nitrate concentrations (μM) of the Lomonosovfonna ice core as a function of depth. (b) the nitrate concentrations (μg L–1) of the ice core as a function of age: the raw data and the SSA non-linear trend after subtracting the mean nitrate concentration. (c) as for (b) but zoomed in from 1750 to 1997.
The highly significant non-linear trend accounts for 35% of the variance (Fig.2b and c). Agentle increase in nitrate concentrations can be seen at the beginning of the time series from the 12th to the mid-16th century (Fig. 2b). This increasing trend is probably not due to a simple increase in nitrate sources since most other ions that have marine, terrestrial or biogenic sources also show similar trends. One possible explanation for the lower concentrations in the deeper ice is migration of nitrate from the deepest and warmest ice to the bed. Loss of aqueous impurities at grain boundaries through pre-melting may occur as the impurities migrate towards the warmer bed where they are removed (Reference Rempel, Waddington, Wettlaufer and WorsterRempel and others, 2001). This idea is supported by the observation that many other ions show similar decreases in concentrations in the lowest few metres. Even if migration is not now occurring at a significant rate, it may have been more acute in the past as a result of warmer basal ice if, for example, the ice cap was thicker, or experienced increased ice deformation and strain heating.
Another possibility is that warmer surface conditions in the past increased summer meltwater such that it could not be refrozen within the next few lower layers. However, detailed studies of the physical stratigraphy of the core show that the melt percentage is generally 530% (Reference PohjolaPohjola and others, in press). This means all the meltwater is refrozen within the previous winter snow layers, and little or no meltwater penetrates previous annual layers. There is no run-off in the upper part of the core, and we have no evidence that the icefield experienced run-off during the period covered by the lower part of the core.
From the mid-16th to the mid-19th century, nitrate concentrations remain level (Fig. 2c). the Little Ice Age (Reference GroveGrove, 1988), a period of cold, dry conditions in much of Europe, coincides with the period of stable nitrate concentrations. Reference HerronHerron (1982) observed that nitrate concentrations decrease with an increasing accumulation rate in Greenland. A lower accumulation rate could enhance nitrate concentrations if dry deposition is important (Reference Mayewski and LegrandMayewski and Legrand, 1990). Detailed accumulation-rate estimates on the core by Reference PohjolaPohjola and others (2002) are available from 1715 to 1997, and suggest lower accumulation rates from 1715 to 1950, though there is much variability. Our nitrate concentrations are higher from 1715 to 1950 compared with the earlier part of the record, when it is plausible to suppose a higher accumulation rate. We have no direct measurements of accumulation rate for this period, but it is widely supposed to have been warmer (and wetter) than the Little Ice Age. This is consistent with Reference HerronHerron’s (1982) observations, but, as discussed above, we believe that from the 12th to the mid-16th century low nitrate concentrations are probably due to loss of nitrate, while higher nitrate concentrations from 1850 are due to anthropogenic impacts.
To summarize, we think that migration of nitrate towards the warmer base of the ice cap is the best explanation for the low nitrate concentrations from the 12th to the mid-16th century. Thefairly stable nitrate concentrations from the mid-16th to the mid-19th century probably reflect the stability of natural nitrate sources prior to significant anthropogenic impact.
Anthropogenic impacts
The nitrate level started to rise in the mid-19th century (Fig. 2c), probably due to the industrial revolution. the record of global NO x emissions (Reference Klimenko, Klimenko and TereshinKlimenko and others, 2000) shows a slight rise in the 1860s. the nitrate level decreased in the first two decades of the 20th century (Fig. 2c), increased slightly during the 1920s and 1930s and started to rise very sharply in the 1950s. This is consistent with the rapid growth of NO x emissions (Reference Erisman and DraaijersErisman and Draaijers, 1995; Reference Klimenko, Klimenko and TereshinKlimenko and others, 2000) that occurred around the mid-20th century. Maximum concentrations in the ice core were reached in the mid-1970s. from the mid-1980s to 1997, nitrate concentration dropped rapidly, which could be an effect of the strict pollution controls on NO x .
Figure 3 compares the nitrate concentration in the ice core to NO x emission records from Eurasia (including Russia) and North America since 1900 (Reference Erisman and DraaijersErisman and Draaijers,1995). NO x emissions for Eurasia and North America show similar trends to the nitrate concentrations in the core from the beginning of the 20th century. Emissions dramatically increased from the 1940s until the 1980s and then decreased. Only sulphate and nitrate ion concentrations in the core show a dramatic increase in the mid-20th century. This strongly suggests that the increase of nitrate ions is due to increasing industrial emissions.
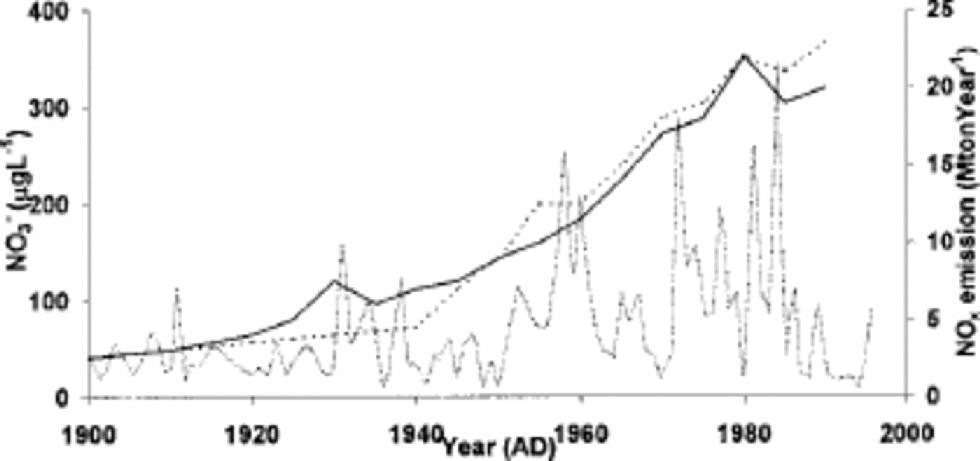
Fig. 3 Trends in emissions of NOxin North America (black line) and Eurasia (dotted line) (Reference Erisman and DraaijersErisman and Draaijers, 1995), and the nitrate concentration of the ice core (grey line).
Other studies from Svalbard have observed that nitrate concentrations started to increase in the 1950s (Reference Goto-AzumaGoto-Azuma and others, 1995) and to decrease in the late 1970s. Goto-Azuma and others (1995) indicated nitrate values decreasing in the 1980s to levels lower than those before 1950. They assumed leaching of nitrate caused by melting had been most pronounced during the 1980s. Our data also show a notable decrease after 1985, but detailed stratigraphy of the upper 36 m of the core (Reference PohjolaPohjola and others, in press) indicated no run-off.
In south Greenland, nitrate concentrations started to rise rapidly in the 1940s and increased until 1980 to a level twice as high as the pre-1940 level (Goto-Azuma and Koerner, 2001). Reference Finkel, Langway and ClausenFinkel and others (1986) observed that nitrate concentrations had risen by about 30% above natural levels in Greenland by the 1950s. Reference HerronHerron (1982) suggested that the anthropogenic contribution to nitrate concentrations is not detectable in Greenland until after 1900. Reference MayewskiMayewski and others (1986) indicated relative constancy in nitrate levels from 1869 to 1955 and an increase from 1955 to 1984 in a south Greenland ice core. However, in closer inspections of the other studies in south Greenland, Reference Neftel, Beer, Oeschger, Zürcher and FinkelNeftel and others (1985) and Reference Mayewski, Lyons, Spencer, Twickler, Buck and WhitlowMayewski and others (1990) indicated nitrate increased from the beginning of the 20th century. the Canadian high Arctic shows a marked increase in nitrate concentrations beginning around the1950s (Reference Koerner, Fisher and Goto-AzumaKoerner and others, 1998), and the Canadian low Arctic shows increasing nitrate concentrations from the 1960s (Goto-Azuma and Koerner, 2001). Summarizing the Arctic ice cores, anthropogenic nitrate concentrations show the most notable increase during the 1940s or 1950s (except for the Canadian low Arctic) and some of the cores show only slight increases earlier.
Volcanic eruption and nuclear tests
Some ice-core studies show changes in the atmospheric nitrogen cycle during volcanic eruptions. Decreased nitrate concentrations are seen at the same depth as the volcanic eruption is recorded (Reference Yang, Mayewski, Zielinski, Twickler and TaylorYang and others, 1996). the only volcanic eruption that we noticed very clearly in the sulphate profile of the Lomonosovfonna core was Laki in 1783. Our nitrate record is unchanging during the volcanic eruption (Fig. 4). the volcano nitrate migration effect has not been observed in several other ice cores (e.g. Reference Koerner, Fisher and Goto-AzumaKoerner and others, 1998; Reference Kreutz, Mayewski, Whitlow and TwicklerKreutz and others, 1998). It has been suggested that the nuclear tests in 1961 and 1962 injected rather large amounts of NO into the atmosphere (Reference GilmoreGilmore, 1975). Our results do not show any significant difference in nitrate concentrations during those years.
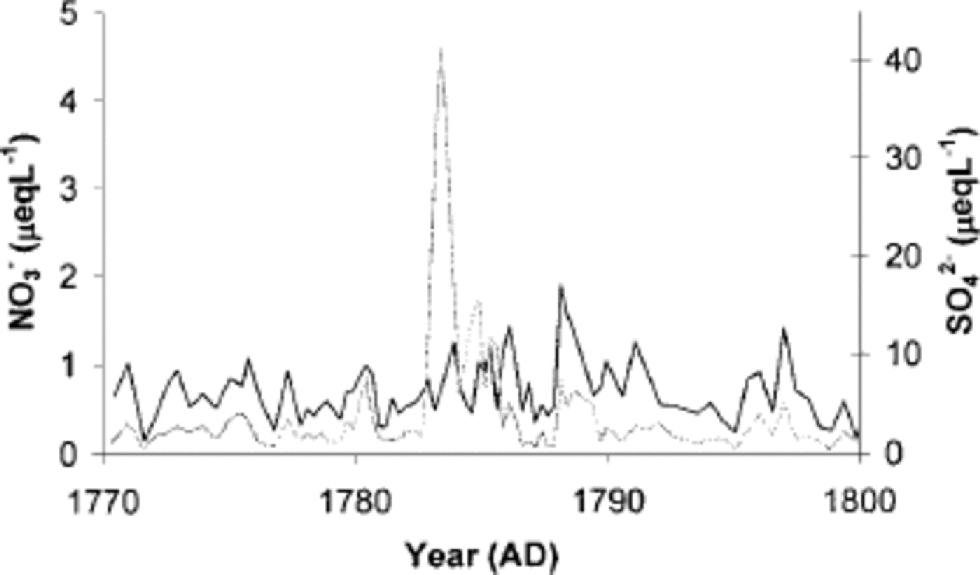
Fig. 4 Sulphate (grey line) and nitrate (black line) concentrations of the ice core across the 1783 Laki volcanic peak.
Correlations with other ions
Nitrate and ammonium concentrations exhibit complex covariation during the last 100 years (Fig. 5): they are rather well correlated for some periods (e.g. before 1920 and after 1960), but at other periods they are relatively uncorrelated. Figure 5 shows that nitrate and ammonium peaks are at close stoichiometric equilibrium in some years, such as during peaks in concentrations of both ions around 1910 and 1985. Empirical orthogonal function (EOF) analysis shows there is no clear association between nitrate and ammonium over the whole core. the correlation between ammonium and nitrate concentrations indicates that ammonium nitrate (NH4NO3) has been common at Lomonosovfonna before 1920 and after 1960. In recent years this is presumably related to Arctic haze aerosol, but the correlation during the earlier period suggests naturally significant sources of ammonium nitrate.

Fig. 5 The nitrate (grey line) and ammonium (black line) concentrations of the ice core. R values: 1900–20, R =0.576 (n =77); 1920–60, R =0.196 (n =118);1960–97, R =0.577 (n =130). n =number of data points. All correlations are significant at the 99% level.
Reference Röthlisberger, Hutterli, Sommer, Wolff and MulvaneyRöthlisberger and others (2000) suggest that calcium may be associated with nitrate via the stabilizing effect of calcium preventing volatilization of nitrate from surface snow layers. Figure 6 shows that there are places in the core where nitrate is very closely associated with calcium. the close stoichiometric ratio suggests that around 1830 there is calcium nitrate (Ca(NO3)2) in the core, though this may be a post-depositional reaction rather than reflecting a source of calcium nitrate. There is also a clear association between nitrate and calcium in other parts of the core (e.g. around 1800,1860,1910 and 1955), but EOF analysis also suggests that, in general, calcium is not particularly associated with nitrate.
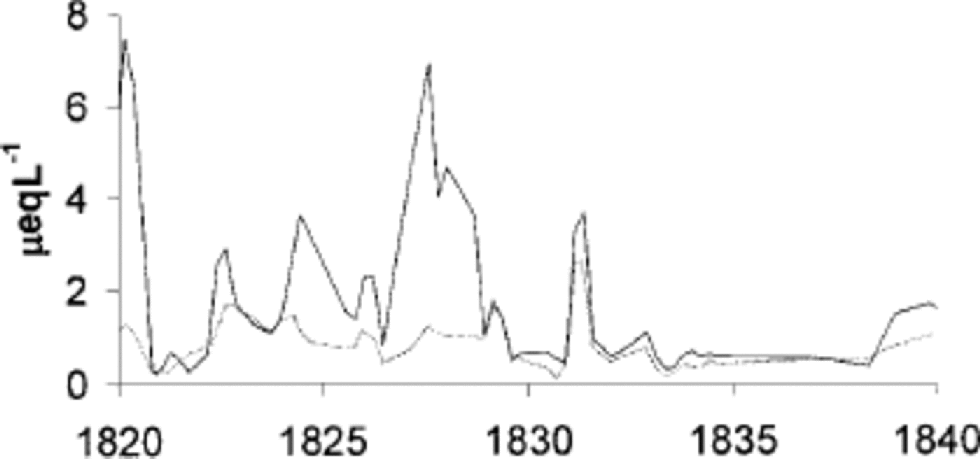
Fig. 6 The nitrate (grey line) and calcium (black line) concentrations of the ice core. for 1829–35, R =0.978 (n =22). Other correlations observed: 1789–1803, R = 0.745 (n = 27); 1858–63, R = 0.884 (n = 20); 1907–10, R = 0.866 (n =16); 1953–57, R = 0.798 (n =12) (not shown). All correlations are significant at the 99% level.
Conclusions
The nitrate record indicates that only rather small nitrate changes may be assigned to natural climate changes in the past. Our data show a continuous increase from about the 12th to the mid-16th century, with higher, fairly stable values throughout the period from the mid-16th to the mid-19th century. the increase in nitrate concentrations from the 12th to the mid-16th century may be an artefact due to loss of impurities in aqueous solution migrating towards the warmer base of the ice cap, where they are lost. Themost clear-cut changes of the nitrate concentrations in the Lomonosovfonna ice core are due to anthropogenic effects. the growth of nitrate concentrations in the mid-20th century is an atmospheric signal resulting from growing NO x emission. Other ice-core records from the Arctic show similar trends. We observe rather variable correlation between nitrate and ammonium. It seems clear that for some periods ammonium nitrate is common, possibly related to variations in atmospheric acidity. Calcium is sometimes associated with nitrate, possibly through the influence of dust particles on nitrate volatilization.
Acknowledgements
We thank the Finnish Forest Research Institute Research Station in Rovaniemi for cold- and clean-room facilities. the drilling of the Lomonosovfonna ice core was financed by the Norwegian Polar Institute (NP) and the Institute for Marine and Atmospheric Research, Utrecht.The analytical work presented was funded by the Finnish Academy. the editor, K. Goto-Azuma, and the reviewers, R. M. Koerner and an anonymous reviewer, are gratefully acknowledged for helpful comments. All the field participants and the Nordic Arctic Research Programme are also thanked. the map was drawn by A. Igesund at NP.


