Introduction
Dynamical models of the flow regime of glaciers are frequently employed to analyze their present state and estimate their response to climate changes. In order to do such an analysis, a realistic model for the mass-balance distribution is necessary. Reference HindmarshHindmarsh (1990) pointed out that the volume of ice sheets is primarily sensitive to the slope of the equilibrium-line altitude (ELA) and the ratio of ablation to accumulation and has only a weak dependence upon the rate factor, which presents deformation and temperature for an ice cap of a given size, and the magnitudes of the accumulation and ablation. Moreover, model studies have shown that the mass-balance–elevation relationship has a decisive influence on the stability and the size of ice sheets (Reference WeertmanWeertman, 1961; Reference OerlemansOerlemans, 1981). It is thus important to develop a model that describes the observed mass-balance distribution and contains the basic features of climate control which can be used to force ice-dynamic models.
Several methods have been developed to quantify the mass-balance distribution on the ice-sheet surface and its relationship to climatic variables. One commonly applied model is the so-called degree-day model which determines melting of snow and ice as a function of the cumulative sum of positive air temperature (e.g. Reference ReehReeh, 1991; Reference BraithwaiteBraithwaite, 1995; Johannesson and others, 1995; Reference HockHock, 1999). Another commonly used method computes the surface melt rates from energy-balance considerations (e.g. Reference Braithwaite and OlesenBraithwaite and Olesen, 1990; Reference Van de Wal and OerlemansVan de Wal and Oerlemans, 1994). Both these methods have been widely used on many different glaciated areas. A current research project (TEMBA) is working towards establishing such an energy-balance model for Vatnajökull, Iceland (Reference De Ruyter de Wildt, Oerlemans and BjörnssonDe Ruyter de Wildt and others, 2002). The data required for the model calculations are not readily available in all areas. It is also difficult to determine the variation of input data, and the coherence of the model parameters is poorly understood.
Here we present a parameterization of the mass-balance distribution of Vatnajökull. This parameterization is based on measurements collected over the ice cap during the period 1992–2000 (Reference Björnsson, Palsson, Guðmundsson and HaraldssonBjörnsson and others, 1998; H. Björnsson, unpublished information). The dependence of ELA on location is described with a linear function of the x and y coordinates. Two mass-balance gradients are determined, one above the ELA and the other below it. Temporal variation in mass balance is described through a time-dependent shift in the height of the equilibrium line. The parameters in this model are determined with an optimization procedure.
This parameterization of the mass-balance distribution is based on measurements of the present mass balance and cannot be used to compute a mass-balance distribution for an ice cap considerably different in size from the present ice cap. The parameterization is a useful method for interpolating available data and can be used to estimate the specific balance where no measurements are available.
Mass-Balance Measurements
Vatnajökull ice cap is located close to the southeastern coast of Iceland. It measures approximately 150 km from west to east and 100 km from south to north, and is 8100 km2 in area (Fig.1). It is situated in a maritime climate with low summer temperatures and heavy winter precipitation that arrives at the coast from the Atlantic Ocean. Mass-balance monitoring has been carried out on the western and northern outlets of the ice cap since 1992 and on Breiðarmerkurjökull in the southeast since 1996 (Reference Björnsson, Palsson and GuðmundssonBjörnsson and others, 1995a, Reference Björnsson, Palsson and Guðmundssonb, Reference Björnsson, Palsson, Guðmundsson and Haraldsson1997, Reference Björnsson, Palsson, Guðmundsson and Haraldsson1998; H. Björnsson, unpublished information).

Fig. 1. Contour map of Vatnajökull and its surroundings. The crosses indicate the locations of the mass-balance measurements in 1992–2000.
Figure 1 shows the location of all available mass-balance measurements. It can be seen that the data coverage is good and that most of the larger outlet glaciers are monitored. The smaller glaciers flowing eastwards, Skeiðararjökull in the south and the outlet glaciers of Öræfajökull, are, however, not well covered. The data indicate that the ELA varies across the ice cap. Breiðamerkurjökull, on the southeast coast, has an ELA of about 1100 ma.s.l., while the northern and western outlet glaciers have ELAs of 1200–1400ma.s.l.
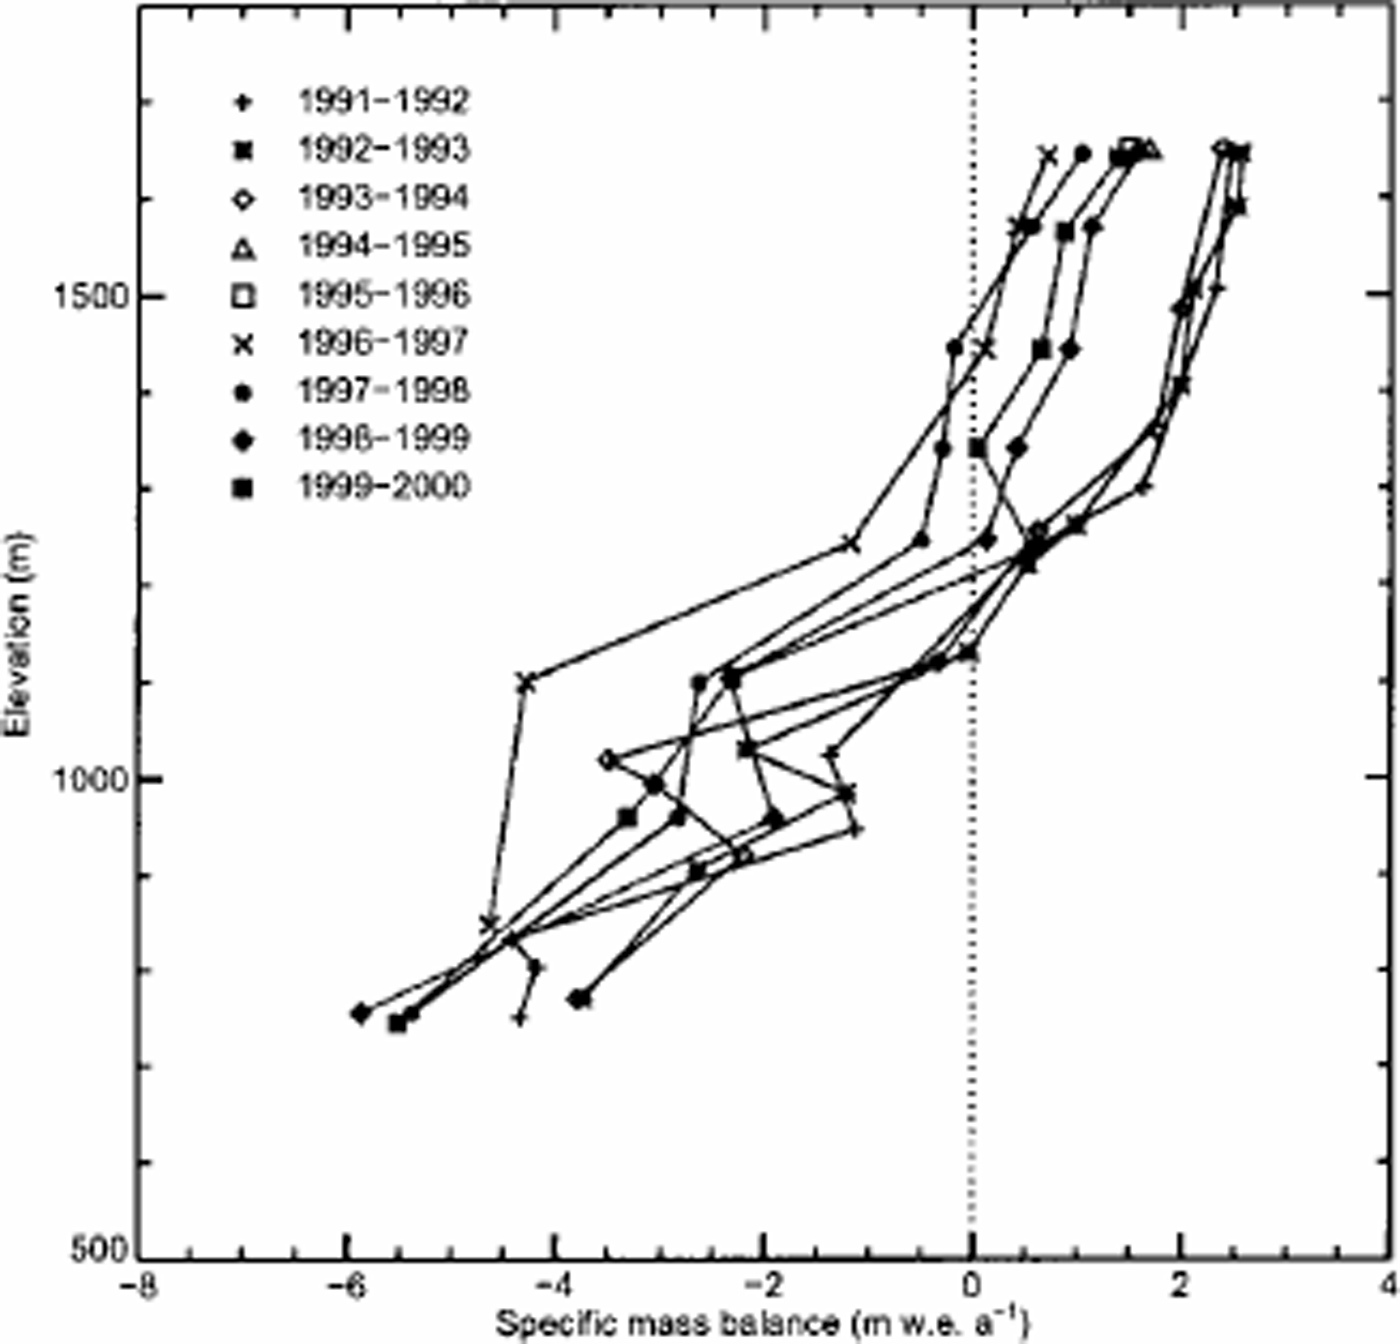
Figure 2 shows the mass-balance distribution for Tungnaárjökull, an outlet glacier on the western side of Vatnajökull, in water equivalent values as a function of altitude. The often observed linear dependence of the specific mass balance on elevation is clearly seen in this figure. Furthermore it can be seen that the mass-balance–altitude gradient is larger below the ELA than above it. These characteristics of the mass-balance data will be used to parameterize the mass-balance distribution of Vatnajökull.

Fig. 2. Measured specific mass balance (in w. e. values) function of elevation for Tungnaárjökull (H. Björnsson, unpublished information).
Parameterization of the Mass Balance
As mentioned above, two characteristics of the mass-balance data are observed. The first is the dependence of the ELA on the distance from the southeast coast of Iceland. This suggests that the ELA can be described with
How well this describes the actual data is tested by analyzing the distribution of the residuals. The other characteristic is the linear altitude dependence of the mass balance, with a larger gradient below the ELA than above it. The temporal variation of the mass-balance distribution is presented with a spatially uniform shift of the ELA plane (ΔELA (t)) . The mass-balance rate can then be computed as:

This model for the mass-balance distribution contains six parameters, three in the equation for the ELA plane, two mass-balance gradients, a maximum value for the surface mass-balance rate (3.5ma–1), and a time-dependent step function as a (ΔELA(t)) describing the year-to-year variation in ELA. These parameters are determined with an optimizing procedure by finding the values which minimize the sum of squares of the residuals, that is, the difference between the model output and the measured mass balance,

where σi is the uncertainty in each measured value. This is a non-linear least-squares problem which was solved with the Levenberg–Marquardt method (Reference Press, Teukolsky, Vetterling and FlanneryPress and others, 1996). A reference mass-balance distribution is defined as the parameterized mass-balance distribution for which the mean specific annual mass balance is zero. The ΔELAs are shifts in the ELA with respect to the ELA of this reference mass-balance distribution . The resulting values for the parameters are given in Table 1. The best fit to the data yields an ELA plane tilted by about 0.3° towards the ocean, with the slope perpendicular to the coast as shown in Figure 3. The direction and the tilt of the plane are g iv e n in the two last columns of Table 1.

Fig. 3. Modeled ELA plane. Outline of the ice cap and the coast is shown. The straight lines are level lines of the plane with equidistant levels of 100 m.
Table 1. The resulting values of the parameters determined with the mass-balance model. The last two columns, direction and slope, are the orientation (to the right from north) and the tilt of the ELA plane, shown in Figure 3

Figure 4 shows the resulting reference mass-balance distribution for Vatnajokull. The accumulation–area ratio (AAR) , the area of accumulation area divided by the area of the whole glacier, for this distribution is 0.65.

Fig. 4. Reference mass-balance distribution for Vatnajökull for which the mean specific annual balance is zero. The accumulation–area ratio is 0.65.
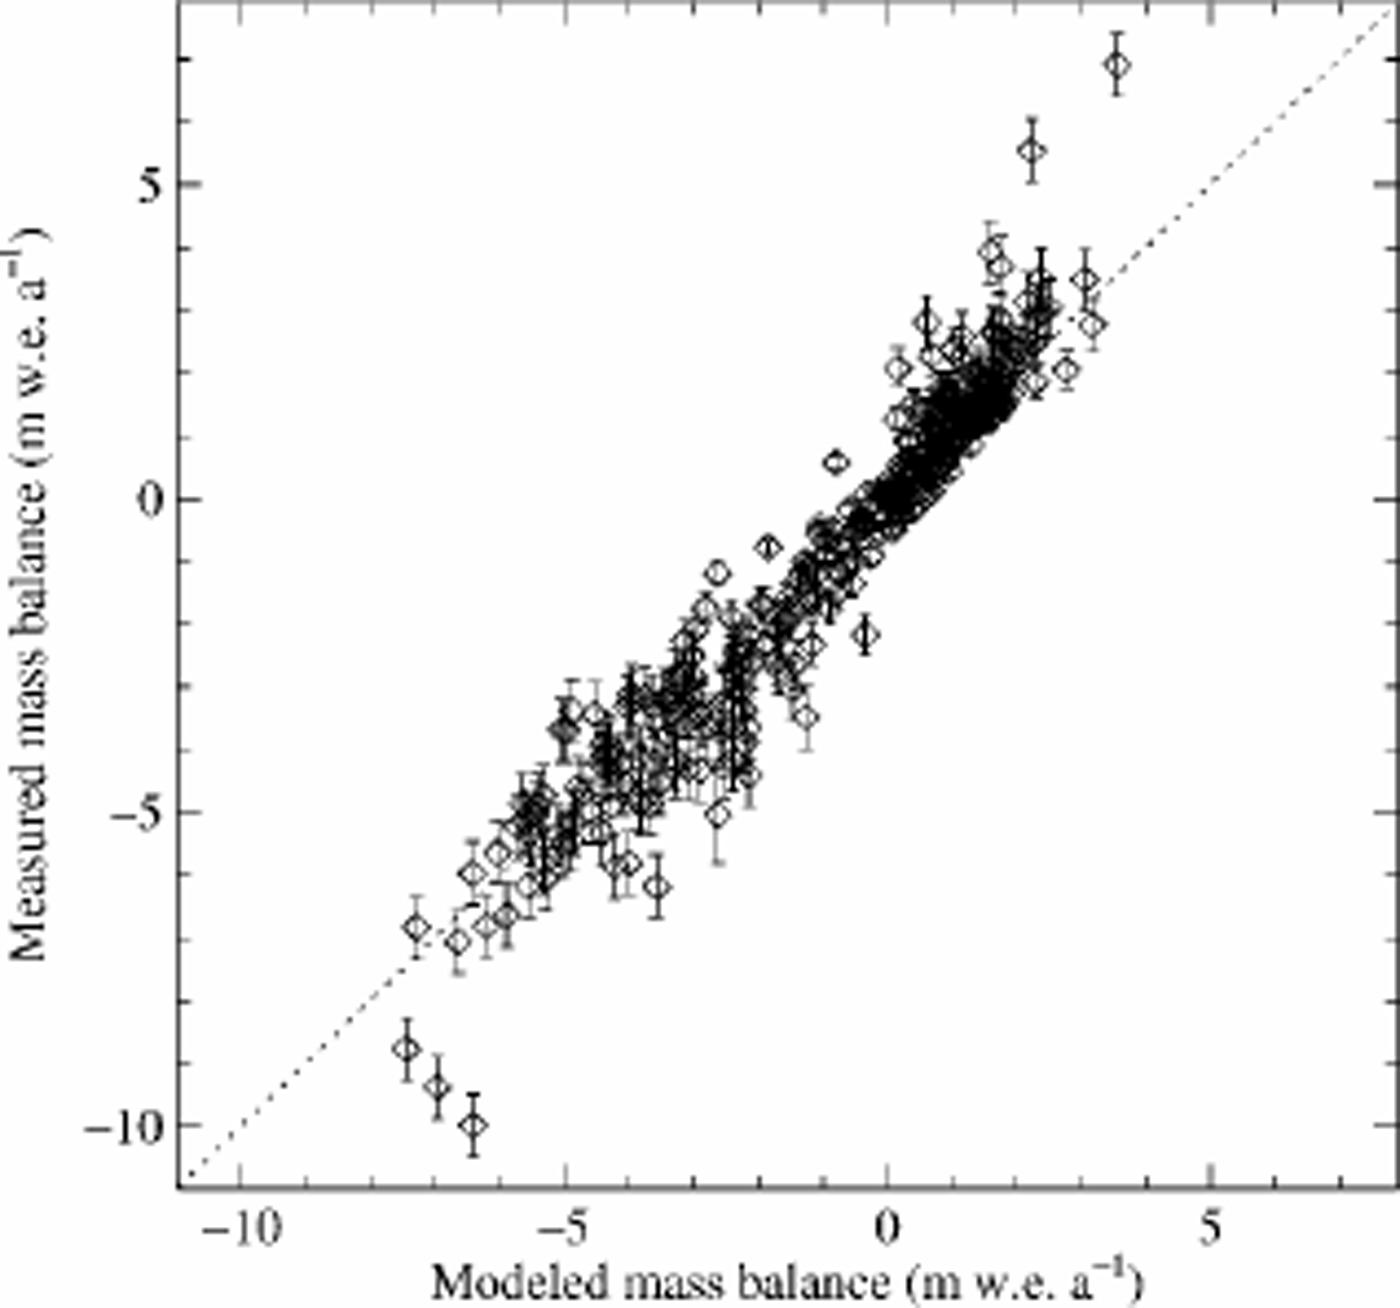
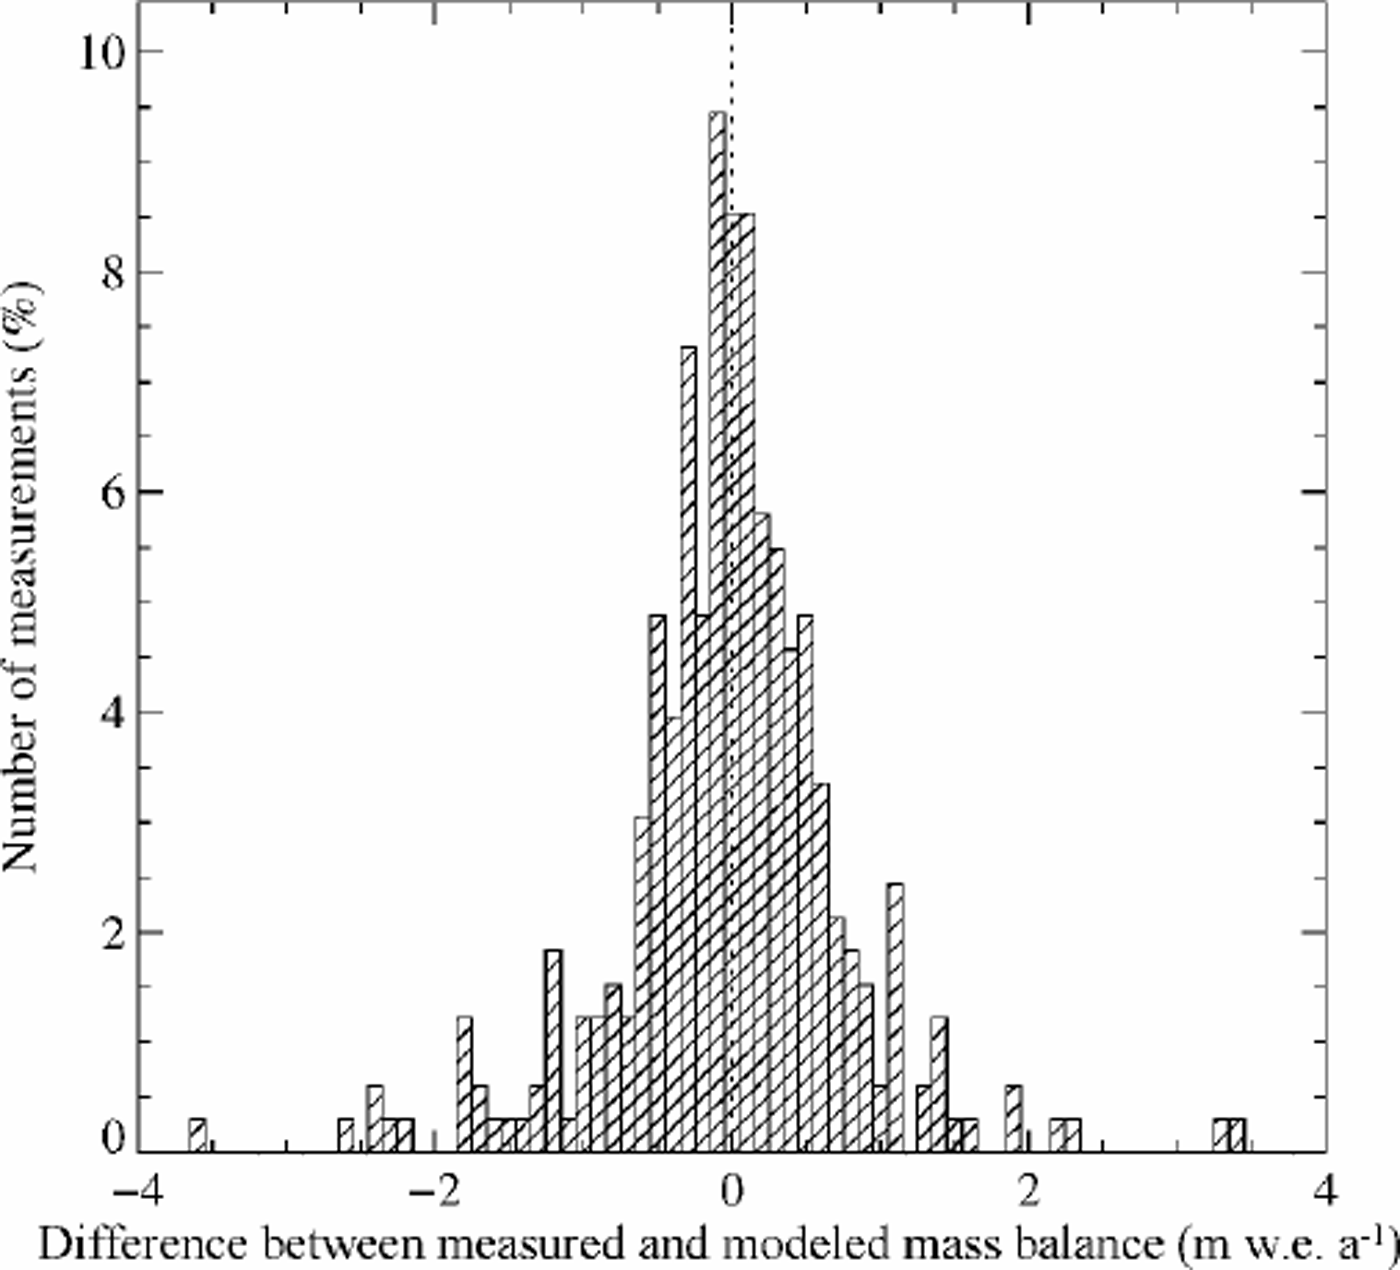
To assess how well the model presents the measured mass balance, the measurements of the mass balance are plotted against the modeled values (Fig. 5). This figure shows that the model reproduces the measurements relatively well, with a correlation between the modeled and the measured values of 0.96. The model is not capable of reproducing the most extreme values of measured accumulation or ablation. The distribution of the residuals between the model and the measurements is shown in Figure 6. It is a Gaussian-shaped distribution, which is taken as an indication that there are no significant systematic errors in the model. The geographical distribution of the residues was also investigated and no systematic pattern in the error distribution found, that is, the errors are randomly distributed in space. It is concluded that the mass-balance parameterization accurately reproduces the observed values.

Fig. 5. The measured specific mass balance plotted against the corresponding modeled values.

Fig. 6. Distribution of the difference between the model and the measurements. The width of each column is 0.1 m.
Discussion
The parameter values explain 96% of the spatial and temporal variance observed in the mass-balance data. The large-scale atmospheric circulation governing the climate in Iceland causes most of the precipitation to arrive at the coast with humid southerly air masses. The amount of precipitation decreases away from the coast. The southern part of Vatnajökull receives about 10 times more precipitation than the northern and western parts, which are shadowed by the coastal mountains and the ice cap itself (Reference Björnsson, Palsson, Guðmundsson and HaraldssonBjörnsson and others, 1998). The slope and the direction of the ELA plane determined with the regression describe this characteristic of the precipitation pattern. The modeled ELA is about 300–400m lower at the southeast coast than at the northern and western margins of the ice cap.
The mass-balance gradients determined with the regression model are 0.0040mw.e. a–1m–1 above the ELA and 0.0082mw.e. a–1 m–1 below the ELA (see Table 1). Johannesson (1991) finds a similar value for Hofsjökull, a neighboring glacier of Vatnajökull, of 0.0075mw.e. a–1 m–1 based on measurements in the ablation area. These values are also comparable with other published values measured on two glaciers in the Swiss Alps in the years 1993–99. During this time, Griesgletscher had mass-balance gradients in the range 0.0010– 0.0015 and 0.0057–0.0080mw.e. a–1m–1, and Silvrettagletscher had the values 0.0022–0.0026 and 0.0071– 0.0092 mw.e.a–1m–1 above and below the ELA, respectively (Reference Herren, Hoelzle and MaischHerren and others, 1999a, Reference Herren, Hoelzle and Maischb, Reference Herren, Hoelzle and Maisch2001). Also, measurements in the ablation area of Unteraargletscher, Swiss Alps, indicate gradients of 0.011, 0.009 and 0.016 mw.e. a–1m–1 for the years 1996/97, 1997/98 and 1998/99, respectively (Reference BauderBauder, 2001). It is thus apparent that the mass-balance gradients have a fairly constant value on temperate glaciers.
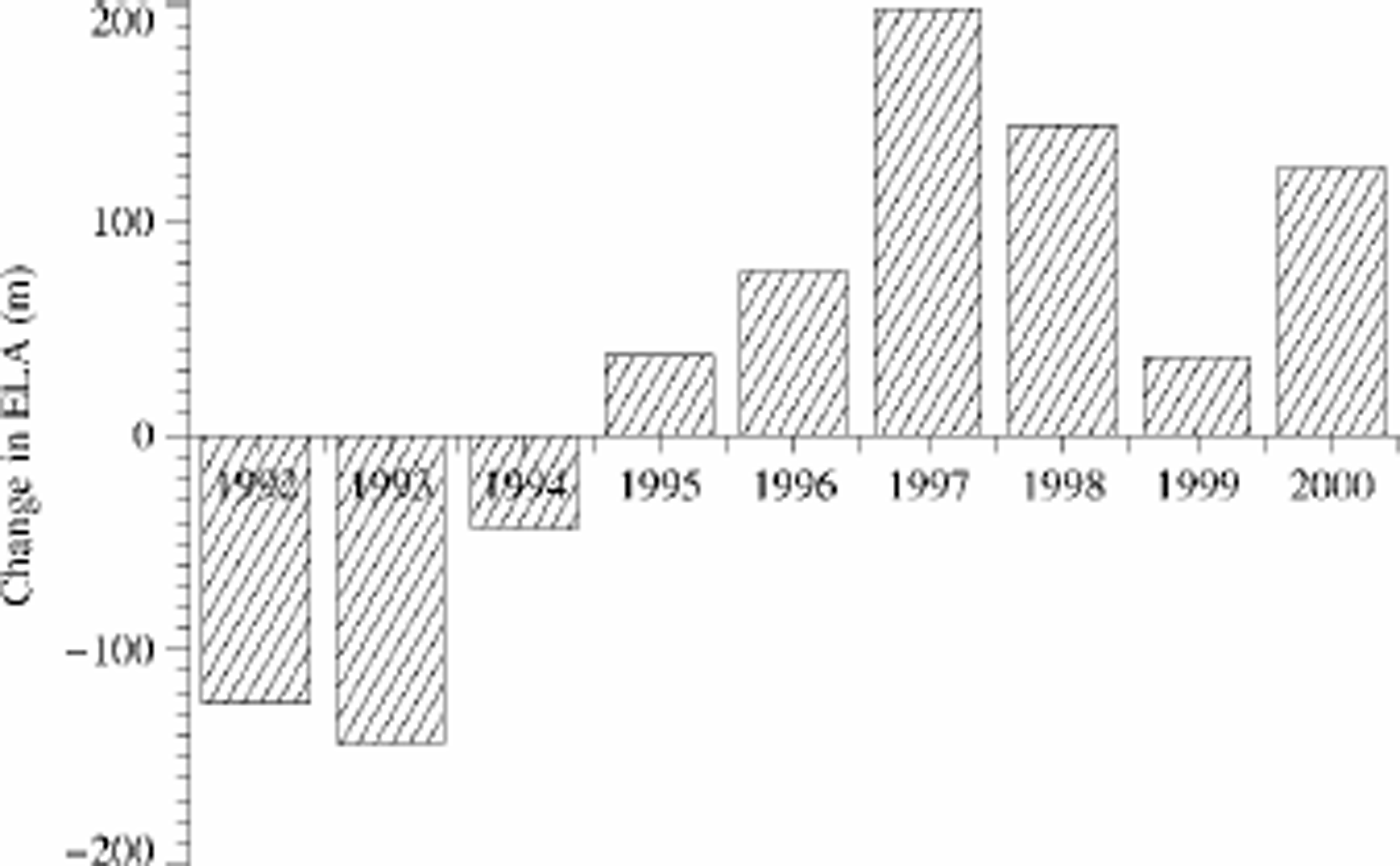
For the measurement period, the calculated shift in ELA with respect to the reference ELA is plotted in Figure 7. The variation in the ELA during this period shows the same pattern as the estimated total balance of Vatnajökull (Reference Björnsson, Palsson, Guðmundsson and HaraldssonBjörnsson and others, 1998), with a high ELA corresponding to a negative mass balance and vice versa. Johannesson and others (1995) use a degree-day model to compute changes in the ELA due to warmer climate for a glacier in Iceland. They predict that a warming of 2 K will lead to a 220 or 180 m rise in the ELA of Sátujökull, central Iceland, for no precipitation change or a 10% precipitation increase, respectively. These values are similar in magnitude to the observed yearly variation in Figure 7.

Fig. 7. Temporal change in the ELA for the measured years.
During the time of observation, a slight trend towards more negative mass balance is observed. A positive mass balance was observed for the first 3 years, but since 1995 the net balance has been negative. The year-to-year variation in the ELA is large, of an order of magnitude similar to the computed changes in the ELA due to expected climatic warming during the next decades. The mass-balance distributions for the highest and the lowest value of the ELA are shown in Figures 8 and 9, respectively. These figures show how large an influence these yearly fluctuations have on the net balance. The mean specific annual balance of the ice cap for the high value of the ELA is –1.17 m, with an AAR of 0.44, and for the low value it is 0.75 m, with an AAR of 0.77. The net balance is not sensitive to changes in the mass-balance gradients, αa and αb, a 5% change in the values of the gradients changes the net balance by 3–4 cm.

Fig. 8. Mass-balance distribution for Vatnajökull computed with the highest obtained ELA value that fits the data from 1997 (ELA raised by 198.9 m). The mean specific annual balance is –1.17 m, and the AAR is 0.44.

Fig. 9. Mass-balance distribution for Vatnajökull computed with the lowest obtained ELA value that fits the data from 1993 (ELA lowered by 143.9 m).The mean specific annual balance is 0.75 m, and the AAR is 0.77.
This parameterization for the mass balance has the advantage of being very simple and transparent in the way that changes in the ELA are directly related to climatic variation. The mass balance at each location is a function of the location, elevation and the time-dependent shift in the ELA. It must be emphasized that this parameterization is only valid for an ice cap similar in size to the present ice cap. The presence of the ice influences the precipitation pattern, and with different shape and size of the ice cap the mass-balance gradients can have different values. How the mass-balance distribution changes with changing size of the ice cap is an important question which has not been addressed in this study. In scenarios where the size of the ice cap will change considerably, other methods to determine the mass balance must be applied.
Conclusion
The model presented here, which describes the mass-balance distribution with a piecewise linear function of the elevation, with ELA which is linearly dependent on the distance from the coast and annual variation presented with a shift in the ELA, was tested statistically and found to closely simulate the measured mass balance for the period 1992–2000.
The shift in the ELA determined with the parameter selection shows a large annual variation, which is of the same magnitude as the change expected to be caused by possible climate variation during the next decades. Decreased precipitation is observed during the short period of available measurements, which causes the mean specific annual balance to become negative and raises the height of the ELA.
Acknowledgements
We acknowledge F. Palsson for work on the collection and processing of mass-balance data on Vatnajökull. We are also grateful for the logistical support provided by the Glaciology Society of Iceland (JORFI) and its many helpful members during the fieldwork. Thiswork was supported by the National Power Company (Landsvirkjun) and the National Research Council of Iceland (grant No. 01810001). We thank the two anonymous reviewers for their comments on the manuscript.


