DOI: 10.1017/S0007114512003753. Published by Cambridge University Press, 5 September 2012
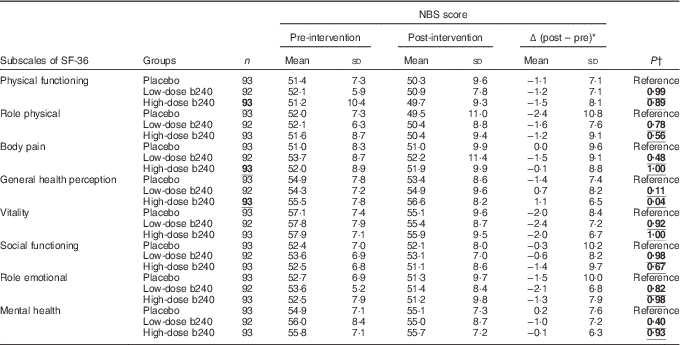
The authors regret to announce that there were some errors in Table 3 of this paper, namely that the number of subjects and the statistical analytical method for QOLs were incorrect. The corrected Table 3 and texts are below. We apologize for any inconvenience caused.
Original text and correction
1. Abstract (P 1856, L11-12)
General health perception, as determined by the SF-36®, dose-dependently increased in the b240 groups ( P for trend=0·016).
(Correction)
General health perception, as determined by the SF-36®, dose-dependently increased in the b240 groups ( P <0·025)
2. Experimental methods (Statistical analysis) (P 1859, L13-19 of the right column)
Dunnett’s multiple comparison test was performed for the inter-group comparison of QOL score. To examine whether the effect of b240 on QOL score was independent of common cold experience, we used generalized linear models in which we entered changes in score (Δpost – pre) as the target variable, and group (placebo to high-dose) and common cold experience (yes or no) as explanatory variables.
(Correction)
Shirley-Williams’ multiple comparison test was performed for the inter-group comparison of QOL score. To examine whether the effect of b240 on QOL score was independent of common cold experience, we used generalized linear models in which we entered changes in scoreΔ (post – pre) as the target variable, and group (placebo to high-dose) and common cold experience (yes or no) as explanatory variables.
3. Results (Change in quality of life) (P 1862, L2-6 of the left column)
Table 3 shows a comparison of pre- and post-intervention QOL scores. From pre- to post-intervention, the score for the general health perception subscale in the b240 groups significantly improved as compared with that in the placebo group ( P for trend=0·041).
(Correction)
Table 3 shows a comparison of pre- and post-intervention QOL scores. From pre- to post-intervention, the score for the general health perception subscale in the b240 groups significantly improved as compared with that in the placebo group ( P <0·025).
4. Table 3. (P 1862)
Table 3 Changes in quality of life as assessed by the SF-36 (per-protocol set) (Mean values and standard deviations)

NBS, norm-based scoring for Japanese; b240, Lactobacillus pentosus strain b240.
* Change in score was derived by subtracting pre-value from the post-value.
† Dunnett’s multiple comparison test.
(Correction)
Table 3 Changes in quality of life as assessed by the SF-36 (per-protocol set) (Mean values and standard deviations)

NBS, norm-based scoring for Japanese; b240, Lactobacillus pentosus strain b240.
* Change in score was derived by subtracting pre-value from the post-value.
† Shirley-Williams’ multiple comparison test (one – side, 2·5 %). NS not significant.


