INTRODUCTION
The monitoring and surveillance of animal diseases, particularly zoonotic diseases, is becoming increasingly important to government policy-makers. The effect of the bovine spongiform encepatholopy (BSE) epidemic on the British livestock industry and the more recent spread of highly pathogenic avian influenza by wildlife are typical examples of diseases which cause considerable challenges for those deciding national policy on human and animal health [1]. Additional challenges are raised by new and emerging diseases which may have an unknown risk to humans and animals. One of the most important factors in the control and management of such diseases is early detection.
To achieve this early detection, it is important to derive the best value from surveillance activities and information. Currently, in England and Wales, the Veterinary Laboratories Agency (VLA), routinely analyse surveillance data to determine, e.g. seasonal trends, the frequency of outbreaks and patterns in animal disease reporting. Typically these data are analysed retrospectively following identification of an increasing trend in disease reporting, which results in intervention measures being implemented potentially some time after the observed increase. However, the data can be analysed as it is collected within an early detection system; an approach that is becoming increasingly popular particularly in public health surveillance (see e.g. [Reference Farrington2, Reference Stroup, Williamson and Henden3]).
Early detection systems use data from ongoing surveillance to identify significant increases in disease reporting by comparing the most recently recorded number of cases (the ‘current count’) with a threshold value derived from the historical data. If the current count is above the threshold value, a warning flag is raised indicating that a significantly aberrant number of reports have been observed. In other words, there is an increase in reports above what is expected in the absence of natural variation. Under these circumstances, the warning flag will alert those charged with monitoring disease to investigate these cases further which might involve more detailed epidemiological or pathological study. It is anticipated, using this approach, that a warning flag would be raised shortly after a disease problem occurred in the field, thereby facilitating timely further in-depth investigation and reporting to policy-makers enabling control measures to be implemented with minimal delay. An early detection system can be a useful tool for enhanced surveillance to be used alongside other traditional statistical and epidemiological methods.
The benefits of implementing early detection systems have been readily observed in the public health arena where they are relatively commonplace (see [Reference Stroup, Williamson and Henden3, Reference Hutwagner4]). However, their application to animal health data has been limited. This issue has recently been addressed through the development of a system for detecting outbreaks of salmonellosis in British livestock [Reference Kosmider5]. This system is based on an algorithm applied to public health surveillance data in England and Wales [Reference Farrington2] and has been implemented on a monthly basis for the last 2 years. Given the usefulness of the Salmonella system as an additional enhanced surveillance tool, it was considered important to apply this system to other animal health data.
In this paper, we consider applying an early detection system to a subset of endemic disease surveillance data that focuses on new and emerging conditions. Specifically, within the data on endemic diseases and conditions, there is a category of data for which a diagnosis was not obtained due to either poor quality of the original sample, lack of appropriate testing or because the condition or disease had not yet been diagnosed. It is for this latter reason that it is of importance to monitor this specific subset of data, i.e. the ‘diagnosis not reached’ (DNR) data. The data are analysed quarterly using a normal statistical test to compare the reported proportion of DNR reports (DNR reports divided by total submissions) between quarters and years. This analysis is only undertaken if there are more than 40 reports for a given syndrome for a given quarter. All proportions that are statistically significant at the 5% level (z value 1·96) are flagged. This analysis is summarized each quarter within the Scanning Surveillance for New and Emerging Diseases section of the quarterly reports produced for each species by the VLA (http://www.defra.gov.uk/vla/reports/rep_surv.htm). In this paper we describe how the use of an early detection system on this DNR data subset can supplement the current quarterly data analysis and, thereby, enhance routine scanning of new and emerging diseases. An overview of the surveillance data, the early detection system approach and a summary of the system outputs are provided.
METHODS
Surveillance data
Data relating to submissions of animal samples (e.g. faeces, blood, carcasses) to the VLA have been recorded within a central database since 1975. In November 1998 a new central database, FarmFile, was established that is networked between all the VLA laboratories serving England and Wales and collates both administrative and surveillance data. Upon submission of a sample from a practitioner to a VLA laboratory, epidemiological data relating to the affected species and breed, the age of the animal, the clinical history and any supplementary information is entered into the database. The samples are then tested and when the results are available, a diagnosis is made by the Veterinary Investigation Officer (VIO) and entered into the database using one of a series of specific diagnostic codes. In addition, there is scope to include free text information.
Within FarmFile a wide range of endemic diseases and conditions are represented (e.g. lead poisoning, mastitis due to Psuedomonas spp., Mycoplasma bovis infection). The diseases and conditions are grouped according to whether they are systemic diseases, diseases of the digestive system, the respiratory system, the urinary system, the musculoskeletal system, the nervous system, skin, the blood and lymph circulatory system or the reproductive and mammary system. In addition to the common ailments within each disease category are conditions that are not readily identified by the tests performed and are classed as DNR. These data are for submissions which do not fulfil the criteria for diagnosis of endemic disease despite reasonable testing given the clinical history, post-mortem and/or laboratory findings. The reasons for this include: it was a diagnosable endemic disease but at the time of the submission the animal was at the wrong stage of disease, treated with an antimicrobial or had an inconclusive test result; it was not a disease that could be diagnosed in the laboratory (e.g. nutritional disease); or it is a new and emerging disease. It is for this latter reason that it is important to monitor and analyse this subset of endemic data.
A DNR diagnosis can be derived under two different circumstances, i.e. limited testing has been undertaken or reasonable testing has been performed. It was considered that in the situation of limited testing, an alternative diagnosis could have been made if further testing had been undertaken. Therefore, only DNR diagnoses despite reasonable testing were considered within the analysis. This was the case for all the disease categories where DNR can be recorded: systemic disease, digestive disease, urinary disease, musculoskeletal disease, nervous disease, skin disease, circulatory disease, and reproductive disease. In addition there are DNR reports for a disease category other than those listed and for disease type unknown. For each of these categories and testing scenarios, the DNR dataset spans the period from November 1998 to the present time. However, due to the large-scale outbreak of foot-and-mouth disease (FMD) in Great Britain in 2001 all data pertaining to 2001 was excluded from the analysis due to the impact FMD had on collection of samples for surveillance. Further, the data from November and December 1998 were also excluded. Initially, attention was focused on DNR reports in cattle and sheep as there is a greater quantity of data for those species compared to, for example, poultry and pigs, whereby fewer DNR reports are recorded each month.
Early detection system
There are several statistical techniques that can be applied to detect aberrations in reporting such as time series, regression analysis, cumulative sums and scan statistics. It was considered that the log-linear regression model developed by Farrington et al. [Reference Farrington2] was the most suitable approach as it readily accounts for seasonality and trends in the data, within a single robust algorithm. The log-linear regression model has been described in detail elsewhere [Reference Farrington2] in relation to the CDSC dataset and by Kosmider et al. [Reference Kosmider5] in its application to Salmonella animal health data. Therefore, in this paper, only an overview of the approach is provided.
In order to apply the regression analysis, several assumptions were made. First, it was assumed that samples were submitted at a constant rate over the same time period. Given this assumption, the denominator data was considered constant for any given month of analysis and hence the observed numbers of DNR reports were representative of the burden of DNR disease conditions in the livestock population. Second, the counts were assumed to follow a Poisson distribution and were assumed to be independent. It is acknowledged that violation of these assumptions will impact on the validity of the regression model.
Prior to applying the regression model, a baseline dataset to account for the observed seasonality in DNR reporting was derived. This was achieved by aggregating the historical data into calendar months and segmenting it into small windows of time, centred on the current observed month. More specifically, a data segment contained the current month and 1 month either side of the current month resulting in three data-points per year for all historical data (i.e. 1999 to present, excluding 2001). This process was repeated for each year in the database; the combined data for each year formed the baseline dataset. Consequently for September 2009, the baseline dataset contained 27 data-points comprising the current counts for August, September and October for 1999–2008 (excluding 2001).
A log-linear regression model was applied to this baseline dataset. This accounted for dispersion in the dataset as the surveillance data may not adequately fit the Poisson distributional assumption of equal mean and variance due to under- or over-dispersion in the data [Reference Farrington2]. The model also incorporated a linear trend in the number of DNR reports over time, an assumption that was later tested and removed if found to be insignificant. After fitting the regression model, the expected count for the current month was derived. Next, a confidence limit was estimated. This limit was defined as the interval, which contains the expected number of reports with 95% probability [Reference Farrington2]. Any current number of reports above or below this interval is considered aberrant. As in disease reporting a statistical increase is of most importance for disease control, the threshold value was defined as the upper confidence limit. Last, an exceedance score, i.e. a score that dictates the degree to which the current count deviates from the threshold value, was derived. An exceedance score >1 was considered indicative of a significant increase in reports. The main benefit of deriving the exceedance score is that it enables different DNR syndromes to be ranked and compared with ease, a factor that is important in communicating the results to relevant stakeholders. This model was only applied to those data in which the current month's observed count was >0.
The early detection system described was developed in R, a freely available language environment for statistical programming and graphics (www.r-project.org). The monthly historical data is stored within text files and imported into R upon implementation; these text files are updated each quarter.
To illustrate the system outputs that are generated each month for the quarterly reports, the current and expected number of reports, threshold value and exceedance scores were derived using the full dataset for each DNR category for cattle and sheep assuming July–September 2009 is the current quarter (quarter 3). In addition, outputs for the expected number of reports and threshold values were derived for each month of the historical dataset spanning from January 2003 to March 2010 for DNR reports within respiratory and other categories for cattle, and digestive and reproductive categories for sheep. Using this approach, the efficiency of the system can be determined over time rather than for single point in time as above. This analysis was undertaken for each syndrome category and species prior to routine implementation.
Model implementation and routine data analysis
Since 2007, any significant outputs from the DNR early detection system have been included within the Scanning Surveillance for New and Emerging Diseases section of the quarterly reports produced for cattle and sheep by the VLA. At present, any significant increases in the proportion of DNR reports using the normal statistical test are compared with statistical increases reported by the early detection system (i.e. flags). Once a flag or increase is identified, the raw data is analysed further to discern if there is an increase in a specific cohort (e.g. adults, presenting signs, housing, submission type). If there is, a sample of relevant original submissions is analysed to ascertain whether there were any reasons a diagnosis was not reached (e.g. poor sample quality, previous antibiotic treatment). If following this analysis, the reason for the DNR increase was not clear, further action is warranted including assessing whether there is a consistent pattern of disease presentation emerging within the relevant submissions. Further action would then be discussed by the VLA species groups (experts in cattle and small ruminant diseases and ailments) which, if required, would involve relevant government departments or groups.
RESULTS
The patterns of DNR reporting for each disease syndrome in cattle and sheep from January 1999 (month 0) to December 2009 (month 120) are illustrated in Figures 1 and 2. It is evident that the reporting patterns vary between syndromes and species. For example, the number of DNR reports for systemic, digestive, respiratory, and reproductive diseases in cattle is highly variable over time whereas DNR reports for urinary and circulatory syndromes are relatively consistent and range between 0 and 1 or 2 each month. In addition, the number of DNR reports is generally lower for sheep than cattle. The reproductive DNR reports in sheep display a highly cyclical pattern, which varies over time. For all syndromes, the number of reports in the most recent months is relatively low (<20) except for reports of DNR for digestive and reproductive diseases in cattle whereby 174 and 46 reports, respectively, were recorded for December 2009.
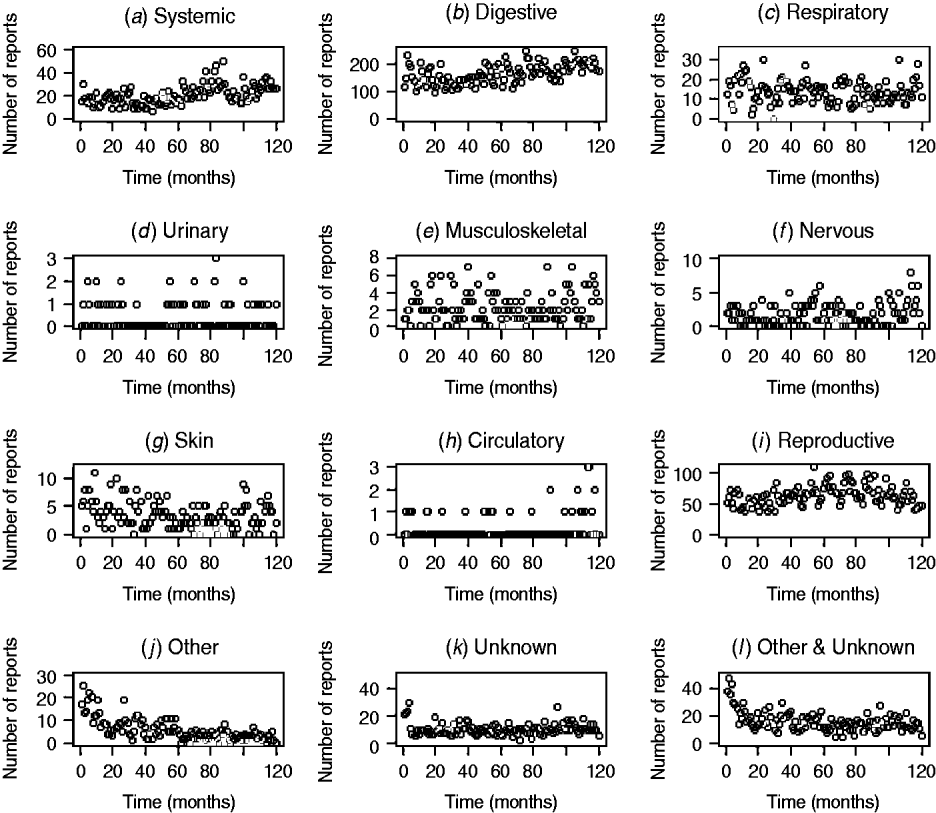
Fig. 1. Number of diagnosis not reached (DNR) reports by syndrome in cattle from January 1999 (month 0) to December 2009 (month 120) minus data for 2001.
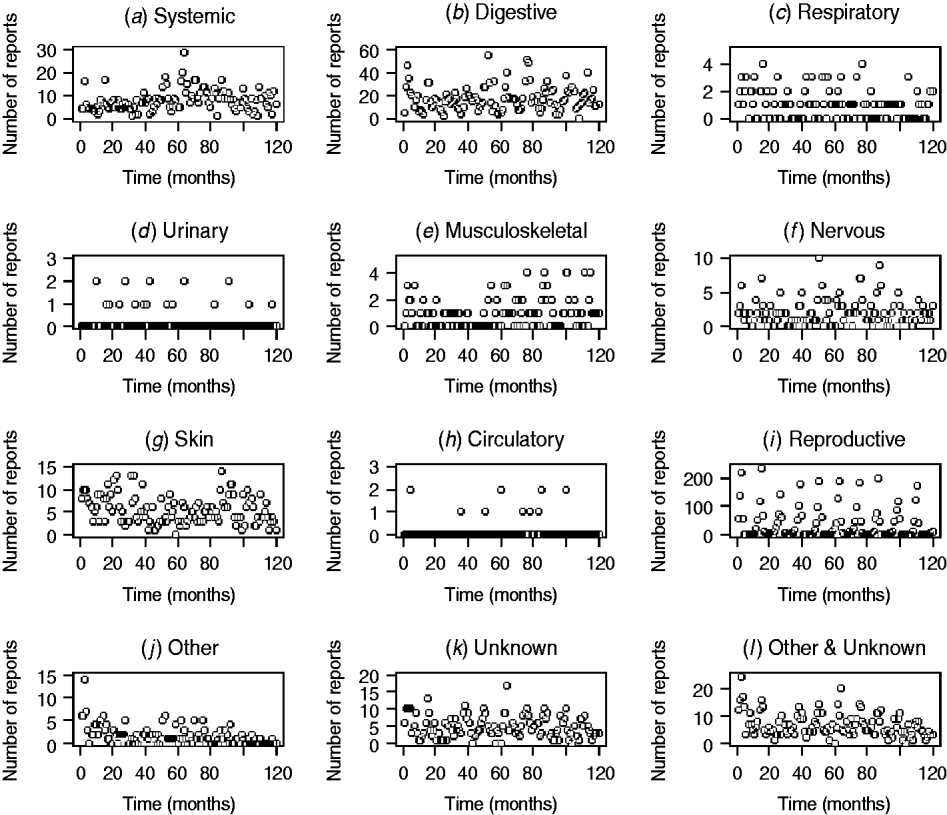
Fig. 2. Number of diagnosis not reached (DNR) reports by syndrome in sheep from January 1999 (month 0) to December 2009 (month 120) minus data for 2001.
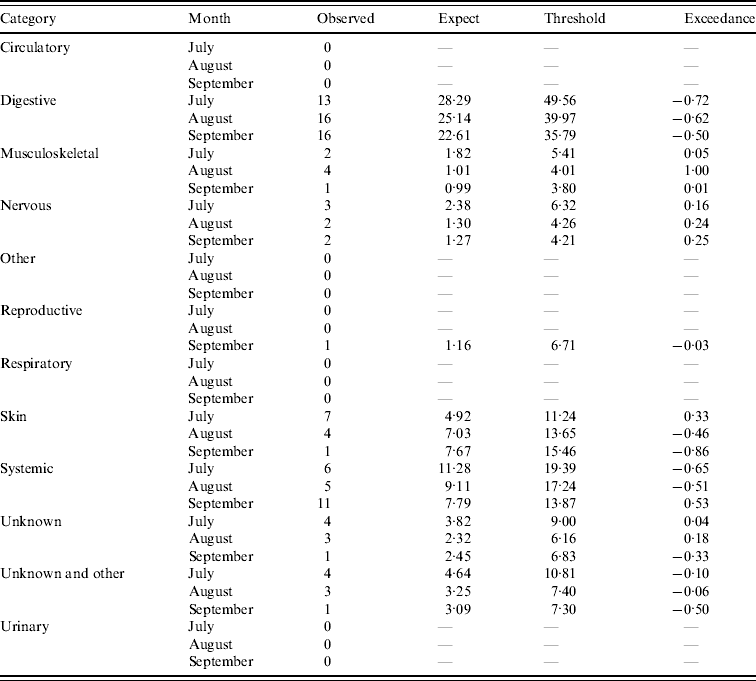
Assuming July–September 2009 is the current quarter, the number of DNR reports predicted by the system is outlined in Table 1 (cattle) and Table 2 (sheep). Outputs are provided for categories whereby the current number of reports is >0. It can be seen for several of the categories that the expected number of reports is in close agreement with the observed number of reports (e.g. systemic and unknown syndromes in cattle and reproductive in sheep). However, for other categories, the expected number of reports is greater than the observed number of reports (e.g. reproductive in cattle and systemic in sheep). This is predominantly due to the fact that, as observed in Figures 1 and 2, the historical reporting pattern is irregular, over time, and the regression model is unable to replicate this irregular pattern, thereby producing variant results between the expected and observed counts. However, the threshold derivation does allow for variation in underlying reporting and, overall, few flags (i.e. exceedance score >1) are raised. Indeed, the majority of exceedance scores are <1, except for ‘nervous’ (July), ‘respiratory’ (August) and ‘skin’ (August, September) DNR reports for cattle indicating that four potentially statistically significant aberrations in reporting occurred in that quarter. Further examination of the data revealed that in July there was a spike of nervous cases relating to six animals. No further investigation was considered necessary as no other months in the quarter were affected and, overall, there was a decrease in the proportion of DNR reports for the nervous syndrome in the quarter. A similar observation was made for respiratory cases except there was an increase in the proportion of DNRs reported for the quarter but it was not significant. For skin disease, the significant increase was investigated further by reviewing the submission reports relating to the 15 cases. The majority of these were in adult cattle and it was concluded that the DNR reports could be undiagnosed psoroptic mange or Parafilaria bovicola which has not yet been recorded in Great Britain, therefore further monitoring of the situation was required as part of the scanning surveillance programme [6].
Table 1. Output from the early detection system for cattle (current month=September 2009)
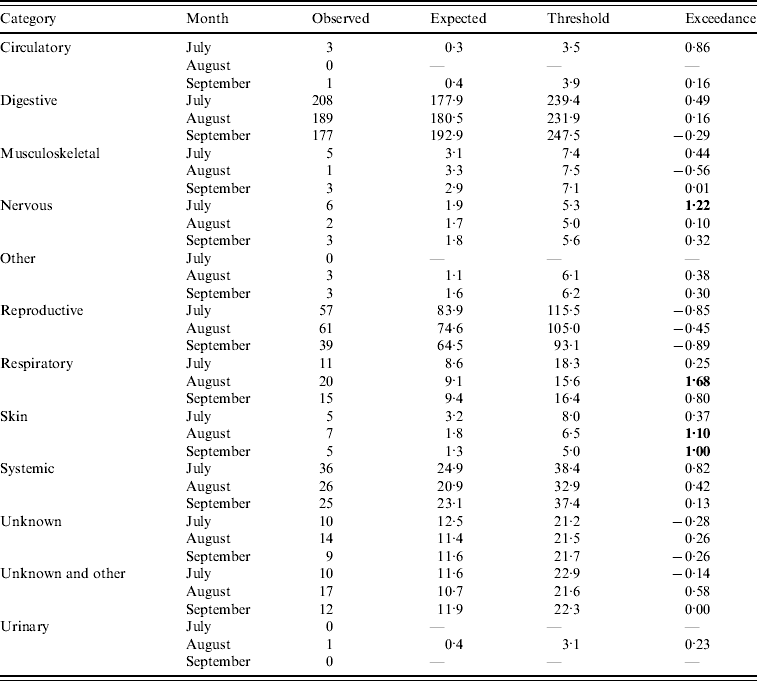
Bold values represent a potential outbreak.
Table 2. Output from the early detection system for sheep (current month=September 2009)
Assessment of the historical observed number of reports with the expected number of reports and threshold values for the four case studies (respiratory and other in cattle, digestive and reproductive in sheep) during the period January 2003 and March 2010 is illustrated in Figure 3. It is apparent that for the case studies, the number of reports over time is highly variable except for reproductive DNR reports in sheep which are highly cyclical. There is broad agreement between the trends observed for the expected number of reports and the current observed number of reports for respiratory and other DNR reports in cattle. It is acknowledged, however, that the specific peaks and troughs observed are not replicated exactly. For the digestive DNR reports in sheep, there is closer agreement indicating that the algorithm is more sensitive for this case study. For reproductive DNR reports in sheep, there is close agreement between the observed and expected number of reports suggesting that the algorithm can provide the most plausible outputs for this case study. Further, it indicates that the system is able to cope well with the highly cyclical pattern in reporting.
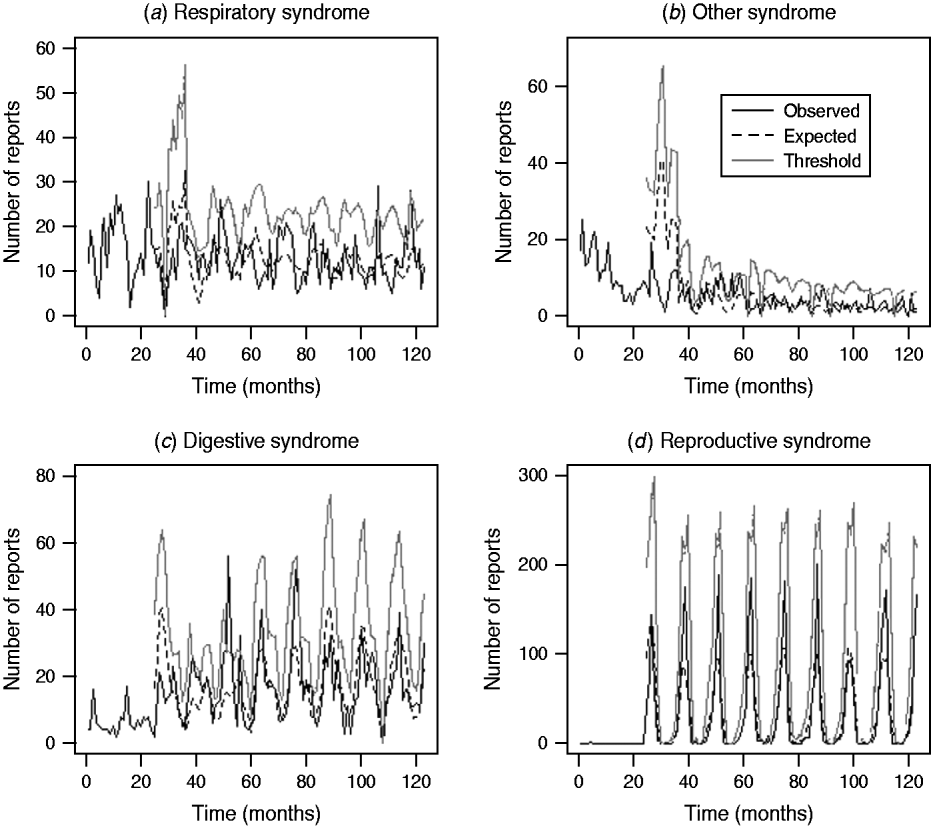
Fig. 3. Number of observed and expected diagnosis not reached (DNR) reports and threshold values for respiratory and other DNR reports in cattle and digestive and reproductive DNR reports in sheep for the period January 2003 (month 37) to March 2010 (month 123).
Based on these and other case studies, it was concluded that the system could provide an additional indication of increasing trends in DNR reporting and be a useful supplementary tool for enhanced scanning surveillance. Consequently, the approach has been implemented on a quarterly basis for the last 2 years. The outputs are compared to an alternative data analysis approach (the z test) and the two methods are in broad agreement. Indeed, the two approaches raised significant increases in reporting for undiagnosed skin diseases in July–October 2009 in cattle (Table 1) which warranted further investigation of the original submission data.
Thus far, since its implementation in the second quarter of 2006, the early detection system has raised 24 flags in cattle and five flags in sheep. For cattle, the majority of flags have been in the second and fourth quarters and in the systemic, nervous, unknown, unknown and other syndromes. In sheep, the flags are evenly distributed across the quarters and have each been for differing syndromes (skin, respiratory, other, digestive). Several of the flags raised have been in agreement with the z test on the proportion of DNRs reported (e.g. nervous flag in second quarter 2009, skin flag in third quarter 2009 and musculoskeletal flag in fourth quarter 2009 for cattle). Overall, no flag has resulted in the detection of a new and emerging pathogen but has rather indicated the need for further monitoring of the situation. It is planned, therefore, that the early detection system will continue to be used on a routine basis in the future and the flags (i.e. exceedance score >1) reported within the quarterly surveillance reports for cattle and sheep compiled by the VLA.
DISCUSSION
In order to identify new and emerging diseases and underlying changes, particularly increases, in endemic disease reporting in British livestock, it is critical that quality data are collected from a surveillance system. The data inputted into FarmFile are audited on a routine basis to adhere to quality standards and the database itself is a robust information technology system that is reviewed routinely for efficiency in reporting and inputting the data. This has been particularly important in deriving the best value from the data including analysing the data within an early detection system.
The DNR data within FarmFile are relatively young (i.e. 1999 onwards) but may provide an insight into a new and emerging pathogen, hence their relevance to scanning surveillance. In reviewing the patterns in reporting for the various syndromes in cattle and sheep, it is apparent that there is wide variation between syndromes (Figs 1, 2). In particular, there are high numbers of reports for systemic, digestive and reproductive syndromes in cattle but few reports for urinary and circulatory syndromes. This is a reflection on not only the physiological types of diseases which cattle, may exhibit (e.g. diarrhoea) but also the number of submissions which may require bacteriological laboratory results vs. biochemistry results. Further, within a syndrome, the frequency of reports varies over time, a factor which is not always readily replicated by the early detection system. Using a time-series approach may provide a means for alleviating this issue but this, potentially, could require a different time-series model for each DNR category and species. As it is anticipated that the system will be extended to include pigs and poultry in the future, the time-series approach is not considered an efficient way forward. However, the system is able to cope with the highly cyclical pattern of reporting for reproductive DNR reports in sheep, for example, where there is close agreement between the observed and expected number of reports suggesting that the algorithm can provide plausible outputs for this syndrome.
The varying pattern of submissions over time impacts on the fit of the model to the data and, in turn, on the decision of what value to set the threshold. Any value above the threshold value is considered statistically aberrant and therefore impacts on the frequency of false and positive flags being raised. Presently, the threshold value is the upper 95% confidence interval around the expected count. This value was selected to reduce the number of false-positive flags being raised by the system while maximizing the number of true flags. It is acknowledged that it may be more appropriate to use a threshold value based on epidemiological or biological characteristics of the pathogen. However, as these data pertain to DNR reports there are no biological or epidemiological characteristics on which to base such a threshold value. It is not the first time that a high threshold value has been set in an early detection system when considering a broad range of varying reporting patterns, as is the case with the DNR data (Figs 1, 2). Indeed, the same threshold value is used in the public health early detection system for multiple pathogens in England and Wales [Reference Farrington2].
The outputs from the system for the four case studies suggest that there is broad agreement between the trends observed for the expected number of reports and the current observed number of reports particularly for digestive and reproductive DNR reports in sheep. It is acknowledged, however, that the specific peaks and troughs observed are not replicated exactly for respiratory and other DNR reports in cattle which is to be expected when applying a single algorithm to varying reporting patterns. In considering the outputs for the third quarter of 2009 (July, August, September) the majority of exceedance scores are <1, except for ‘nervous’ (July), ‘respiratory’ (August) and ‘skin’ (August, September) DNR reports for cattle. The latter flags raised for skin were in agreement with the z test in which a statistically significant increase in the proportion of skin DNR submissions for July–August was observed. Both analyses indicated a potential problem and further monitoring of the situation is required. For the other syndromes, nervous and respiratory, the flags raised did not agree with the z test at a significance level. It is anticipated that not all the flags will be an accurate reflection of real increases, due the system being <100% sensitive and specific. Importantly, the system is not intended for use in isolation but rather to be used as an additional tool within an enhanced communication network of VIOs and stakeholders.
It is acknowledged that this system is not suited for early detection of all types of disease. Clinically obvious pathogens, for example, would be detected in the laboratory before a DNR flag is raised and in these cases the system could provide a later rather than early indication. However, for other pathogens, particularly those that are less clinically obvious, the system should provide an early indication of a significant increase in reporting. It is believed that if such a system had been in place in the 1980s, BSE would have been detected via significant increases in DNR reports in nervous and potentially musculoskeletal syndromes in cattle. It is important, therefore, that this system is used in conjunction with other surveillance tools and it is a supplementary system for use in the detection of new and emerging pathogens in cattle and sheep.
An important component of any early detection system is the implementation process and how quickly a significant increase in reporting, where appropriate, will be investigated and action taken. To assist in this process, a protocol has been devised which involves a series of logical steps. Immediately after the early detection system has been run for the quarter, the outputs are distributed to key scientists responsible for the reporting of the DNR analysis in the quarterly surveillance reports. At this time, a significant increase is investigated by examining the submission data to ascertain whether there is a logical reason for the increase (e.g. a diagnosis could have been made but the sample was of poor quality). If no reason can be found and other analyses concur that there is a statistically significant increase, the cattle and small ruminant species groups are alerted and a decision is made as to what further action is required (e.g. alert government officials, produce a new case definition, alert practitioners, conduct farm visits, implement control measures). Depending upon the biological attributes of the new and emerging pathogen, the speed and efficiency at which the above actions are undertaken will dictate the degree to which the pathogen can be identified and controlled and the overall efficiency of the early detection system.
In addition to early detection systems, the DNR data can be analysed using other statistical methods, e.g. using spatio-temporal approaches (K. Hyder et al., unpublished data) in order to ascertain if there are any spatial clusters of DNR reports. Using the two approaches in conjunction could provide a further useful epidemiological tool for identifying new and emerging diseases in both cattle and sheep.
ACKNOWLEDGEMENTS
The authors thank the Department for Environment, Food and Rural Affairs for funding this study (Project Codes ED1001 & ED1039). We also thank Jackie Willmington (VLA Aberystwyth) and Ailsa Milnes (VLA Langford) for their comments on the outputs of the detection system, and to the ED1039 project team for their support in implementing the system.
DECLARATION OF INTEREST
None.


