Article contents
Did Incomes for Most of the Population Fall from 1923 Through 1929?
Published online by Cambridge University Press: 03 March 2009
Abstract
This paper uses independent real wages, earnings, labor force data, and an examination of Kuznet's 1953 data to explore the recent contention that real per capita incomes for most of the American population declined from 1923 through 1929. It concludes that there is little evidence to support this contention.
- Type
- Papers Presented at the Forty-Second Annual Meeting of the Economic History Association
- Information
- Copyright
- Copyright © The Economic History Association 1983
References
1 Holt, Charles F., “Who Benefited from the Prosperity of the Twenties?” Explorations in Economic History, 14 (07 1977), 277–89.CrossRefGoogle Scholar
2 Kuznets, Simon, Shares of Upper Income Groups in Income and Savings (New York, 1953).Google Scholar
3 From 1920 to 1930 the labor force in relation to the total population—which is relevant for a per capita income analysis —rose from 37.95 to 38.91 percent. This was largely due to the declining fraction of the population aged 14 and under.Google Scholar
4 Per capita incomes could decline while average annual per worker incomes remained constant or even rose if employment had shifted from higher to lower annual earnings industries. From Historical Statistics the average annual per employee earnings and total employment in 1923 and 1929 for the eight major non-agricultural sectors are available. The weighted (by sectoral employment) real average annual per employee earnings were $1,396 in 1923 and $1,540 in 1929, or a 9.8 percent increase from 1923 to 1929.Google Scholar
5 The NICB surveyed 25 major industries quarterly throughout the 1920s. From 1923 through 1929 the average hours of work per week for all wage earners fell one percent—too small to explain the nonfarm per capita income decline. See National Industrial Conference Board, Wages in the United States, 1914–1929, 17, p. 51; hereafter cited as NICB, Wages.Google Scholar
6 Bell, Spurgeon, Productivity, Wages, and National Income (Washington, D.C., 1940), pp. 234 and 239.Google Scholar
7 Kuznets, Simon, National Income and Its Composition, 1919–1938, 2 vols. (New York, 1941).Google Scholar
8 NICB, Wages, Tables 19–44, pp. 52–103.Google Scholar
9 The 1925 figure in the last row of Table 1 differs from Holt's 1925 figure by $1.00. This is most likely due to a rounding error.Google Scholar
10 Tables presenting per capita employee compensation, per capita enterpreneurial income, and so forth, for all of these percentile classes are in the longer version of this paper and are available from the author.Google Scholar
11 The percentage changes in per capita employee compensation for 1922 to 1923 and for 1923 to 1924 for the other classes are: second-third percentile, −12.2 and +9.0 percent; fourth-fifth percentile, −29.6 and +6.2 percent; and sixth-seventh percentile, −8.2 and +0.15 percent respectively.Google Scholar
12 The per capita incomes in column 2 are higher than those in column 1 because the income used in column 2 is Economic Income whereas Basic Income is used in column 1.Google Scholar
13 Kuznets, Shares, p. 387.Google Scholar
14 Ibid., p. 394.
15 The incomes shown here are Kuznets's real per capita Economic Incomes for the nonfarm lower 93 percent. The family status adjustment was made to adjust per capita incomes for variations in the number of individuals in the households. The shares of the upper percentile groups were adjusted directly and the adjustments to the lower 93 percent were the residuals from these adjustments.Google Scholar
16 Seltzer, Lawrence H., The Nature of Tax Treatment of Capital Gains and Losses (New York, 1951).Google Scholar
17 Kuznets, Shares, p. 340.Google Scholar
18 Mueller, John, “Lessons of the Tax-Cuts of Yesteryear,” The Wall Street Journal, March 5, 1981. James Gwartney and Richard Stroup, Tax Rates, Incentive Effects, and Economic Growth (manuscript 1981), chap. 3, “The Tax Cuts of the 1920's.” Richard Stroup graciously sent me a draft of the chapter on the 1920s and called my attention to the tax data.Google Scholar
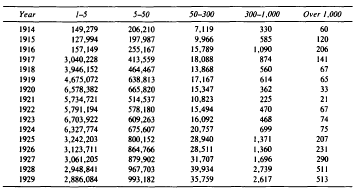
19 The Bureau Internal Revenue's annual Statistics of Income reported the number of returns by net income classes. (Brackets in thousands of dollers.)

All of the data on tax cuts and the timing of the tax cuts comes from Gwartney and Stroup, Tax Rates, Chap.3.
20 Ibid., p. 46.Gwartney and Storup refer to Mellon, Andrew W., Taxation: The People's Business (New York,1924) for Mellon's view.Google Scholar
21 Gwartney and Stroup, Tax Rates, p. 50.Google Scholar
22 Kuznets, Shares, Chap. 11, section 2, pp. 437–41.Google Scholar
23 This does not suggest that there was no increase in income inequality in the 1920s. What the trend in income inequality was in the 1920s is a matter for future research.Google Scholar
- 7
- Cited by


