Introduction
Recently there has been world-wide interest in the use of nitride semiconductors (e.g., GaN, InN, and AlN) for opto-electronic devices such as lasers and light-emitting diodes. The large changes in physical properties such as band gap, crystal structure, phonon energy, and electronegativity difference between GaN and GaAs, demonstrate that nitride semiconductors are fundamentally distinct from traditional III-V semiconductors. In spite of the impressive progress made in recent years [Reference Nakamura and Fasol1] in the development of LEDs and lasers, significant work needs to be done in terms of the optimization of device performance. In order to achieve this goal, the physics underlying the operation of these devices must be better understood. Furthermore, new diagnostic techniques for the characterization of materials and devices will greatly aid in the long-term commercialization of this technology.
It has been recognized that under typical growth conditions there is a positive enthalpy for indium mixing in GaN. Electron microscopy and cathodoluminescence of InGaN has demonstrated the existence of nanometer and micron scale regions of high indium concentration [Reference McCluskey, Romano, Krusor, Bour, Johnson and Brennan2]. It has been hypothesized that the nanoscale regions of high indium concentration are critical to LED operation [Reference Nakamura and Fasol1]. We have previously used time-resolved photoluminescence to investigate indium concentration fluctuations, in InGaN/GaN multiple quantum wells and LEDs.[Reference Pophristic, Long, Tran, Ferguson and Karlicek3] In this paper we discuss the result of time-resolved photoluminescence obtained from a set of LEDs with different quantum efficiency.
Experiment
The light emitting diodes were grown by metal organic chemical vapor deposition at EMCORE Corp. The average indium mole fraction was about 11 %. LEDs consist of ten layers of In0.11Ga0.89N, each 35 Å thick, and nine layers of GaN, each 45 Å thick. The whole structure was on c-plane sapphire with 3 microns of unintentionally doped (n-type 5×10¹⁶/cm3) GaN as a substrate. The LEDs studied in this work were grown under slightly different conditions, leading to large changes in brightness. After final processing, the electroluminescence from samples was in order of 100 μW, 400 μW and ≥ 2 mW. Based on the electroluminescence efficiency we divide samples in three groups dim, bright, and super bright LEDs.
An amplified and doubled Ti-sapphire laser from Coherent Corporation operating at 250 kHz was used. TRPL measurements were performed with a Hamamatsu streak camera (model C5680). The excitation pulse was at 400 nm (3.10 eV) for time-resolved PL. Calibrated neutral density filters adjusted the excitation power used in the experiments. The typical response time was 60 ps and was determined by electrical jitter in the triggering electronics. The laser power used was 1.6 mW, 2.56 μJ/cm2.
Results and Discussion
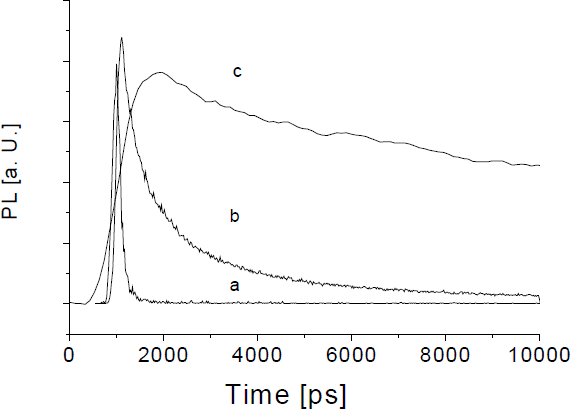
Time-resolved PL data for dim, bright and super bright LED are shown in Fig.1. The lifetime of the emission for dim LED is quite short, 110 ± 20 ps at PL maximum, and the kinetics are not dependent upon wavelength. The short lifetime and low PL intensity of dim LED are due to fast non-radiative recombination processes, which are dominant in this case. This lifetime is short compared to bright and super bright LEDs, which we have examined under similar conditions. The kinetics of bright and super bright LEDs are clearly wavelength dependent, highly non-exponential, and are on the nanosecond time scale. The lifetimes are on the order of 1 ns for bright and 10 ns for super bright LED at the PL max. Such long times are consistent with carrier localization in regions of high indium concentration.

Figure 1. TRPL from a) dim, b) bright and c) super bright LED.
The non-exponential PL kinetics of bright and super bright LEDs, can be described by a stretched exponential function, equation 1, where β is between 0 and 1 and I(t) is the PL intensity as a function of time. τ is the stretched exponential lifetime and β is the stretching coefficient.

There is growing evidence from our group [Reference Pophristic, Long, Tran, Ferguson and Karlicek3] and others [Reference Vertikov, Ozden and Nurmikko4-Reference O′Donnell6] that stretched exponential decays correctly describe the PL decays from InGaN under a variety of conditions. Stretched exponential decays are consistent with disorder and have been observed in wide variety of physical systems. In the case of InGaN, the dominant source of disorder is alloy disorder. Results of fitting the time-resolved PL from a super bright LED to equation one are shown in figures 2 and 3. Both the stretched exponential lifetime and stretching parameter are dependent upon the emission wavelength. The existence of stretched exponential decays is consistent with a broad distribution of lifetimes, which must be included in the theoretical modeling of LEDs. The trends observed in figures 2 and 3 are typical of a series of InGaN LEDs examined. The wavelength dependence of β, the stretching parameter for the super bright LED is shown in figure 4. We note that β is maximum at the PL maximum and decreases at both higher and lower emission energies.

Figure 2. Analysis of the time-resolved PL from super bright LED. The stretching parameter β is clearly wavelength dependent. The stretching parameter is largest at the PL maximum of 480 nm and decreases on both the high and low energy sides of the spectra.

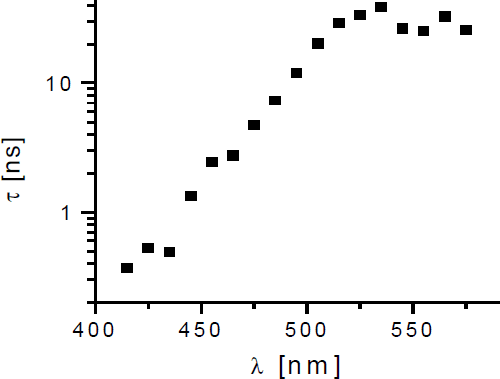
Figure 3. Analysis of the time-resolved PL from super bright LED. The stretched exponential lifetime is observed to dramatically increase as the emission wavelength is varied from 420 to 500 nm. The PL maximum is at 480 nm.

Figure 4.. The temperature dependence of β for the super bright LED
By analogy with previous simulations of localized excited states in other disordered semiconductors, the wavelength dependence of β and τ, Fig. 2, imply that excited state migration is important in InGaN LEDs. Without excited state migration, β would be expected to be wavelength independent.[Reference Pophristic, Long, Tran, Ferguson and Karlicek3]
Figure 3 clearly demonstrates that the stretched exponential lifetime is strongly dependent upon wavelength or emission energy. The data can be successfully fit to an exponential dependence of τ on emission energy., where ω is the emission frequency and E0 is a parameter that depends upon the potential fluctuations associated with the disorder.[Reference Vial7]

For the super bright LED, E0 was found to be 570 meV, which is much greater than the thermal energy. Similar results were obtained for bright and super bright several LEDs. It can be shown that equation 2 is consistent with a tunneling mechanism [Reference Vial7]. We conclude that the carriers produced in the TRPL experiments migrate between different indium quantum dots by a tunneling mechanism. By using a simple model, the average tunneling distance can be estimated to be approximately 20 Å [Reference Vial7]. Therefore the TRPL data confirms the existence and importance of nanometer scale indium alloy fluctuations on the operation of super bright LEDs.
If there is a distribution of barrier heights, one would expect the stretching parameter to vary linearly with temperature, with the slope being equal to the inverse of the width of the distribution of barriers.[Reference Pophristic, Long, Tran, Ferguson and Karlicek8,Reference Schlesinger9]
Temperature dependent measurements shown in figure 4 suggest that the potential fluctuations associated with the disorder are approximately 75 meV, which is much bigger than thermal energy at room temperature (25 meV). This result implies that the excited states are heavily localized in the LED. Furthermore, the magnitude of the potential fluctuations in the super bright LED are much larger than the previously examined 300 Å film, 25 meV.[Reference Pophristic, Long, Tran, Ferguson and Karlicek8]
It is well known that piezoelectric fields are large in nitride semiconductors and can influence optical properties. In a previous study, we examined a series of MQWs with the same physical structure but very different PL spectra and dynamics.[Reference Pophristic, Long, Tran, Ferguson and Karlicek3] Because the piezoelectric fields are determined by physical structure, the changes in PL spectra are attributed to the dominance of indium alloy fluctuations in our samples.
Conclusions
In summary we have used TRPL to examine wafers of InGaN LEDs before the final stages of processing. We have found that in the bright and super-bright LED examined, PL lifetimes at room temperature were on the nanosecond timescale. The PL kinetics were strongly dependent upon the emission wavelength and were well described by a stretched exponential. Both observations are strong experimental evidence for the importance of disorder in actual light emitting diodes. An analysis of the data based on this hypothesis confirms the existence and importance of nanometer scale indium alloy fluctuations on the operation of super bright LEDs.
Acknowledgements
We thank EMCORE Corp. for partial support of this work.


