Introduction
Dietary sugars intake has gained prominence as a highly controversial subject in regard to public health( Reference Rippe and Angelopoulos 1 , Reference Lustig, Schmidt and Brindis 2 ). Although government and health organisations worldwide have issued dietary guidelines for sugars intake, these guidelines vary considerably. Guidelines typically take the form of either quantitative targets or qualitative advice and tend to differ regarding: the type and amount of sugars recommended; the procedures used to establish the evidence base; and the health outcome(s) on which the evidence may be based( Reference Hess, Latulippe and Ayoob 3 ). Examples of quantitative guidelines range from: added sugars should not exceed a maximum of half of the discretionary energy allowance from the American Heart Association( Reference Johnson, Appel and Brands 4 ); a maximum 10 % energy from free sugars from the WHO( 5 ); a maximum of 25 % energy from added sugars from the Institute of Medicine( 6 ); through to the European Food Safety Authority being unable to set a dietary reference value for (added) sugar due to insufficient data( 7 ). It is expected that these guidelines will be further updated in 2014, as draft guidelines have recently been issued by the WHO for public consultation( 8 ), and policy in relation to sugars intake is also being reviewed in the UK( 9 ). Estimates of population sugars intake can be compared with guidelines by the routine monitoring of food intake using indirect or direct methods of assessment. Indirect methods include examination of supply or availability data (for example, food balance sheets and household budget surveys), whereas direct assessments include food diary or record methods, diet histories, FFQ or 24 h recall by the individual. With regard to sugars intake, supply data have been reliably collated by the FAO since 1961( 10 ). These data indicate that, between 1961 and 2009, world total food energy supply (corrected for population numbers) has progressively increased by about 2510 kJ/capita per d (600 kcal/capita per d). Supply of sugars and sweeteners accounts for about 5 % of this increase (126 kJ/capita per d (+30 kcal/capita per d))( 10 ). These data provide an indication of per capita availability of sugars; however, they do not account for wastage, which may be significant, particularly in developed countries, nor can they inform on estimated actual consumption in individuals or specific subpopulations( 10 , Reference Crane, Lewis and Yetley 11 ). Furthermore, supply data are limited to estimating refined sugar (sucrose), or ‘added’ sugars and sweeteners (added to food/drinks by food manufacturers or independently by individuals), and therefore cannot be used to estimate the availability of total sugars, i.e. including sugars naturally present in fruits, vegetables and dairy products.
Direct assessment methods, on the other hand, estimate actual food consumption and can be employed at the individual level and then aggregated to provide summary data at subpopulation or population level. To the best of our knowledge, very few authors have attempted to use national food consumption data to examine trends in dietary intake of sugars in individual countries( Reference Stephen, Sieber and Gerster 12 – Reference Barclay and Brand-Miller 14 ). Stephen et al. ( Reference Stephen, Sieber and Gerster 12 ) examined trends in carbohydrate and components of carbohydrate intake in North America and the UK. However, this review was undertaken nearly two decades ago, and was compiled from a variety of published studies that reported sugars intake in various population groups, but were not necessarily nationally representative samples. More recently, Barclay & Brand-Miller( Reference Barclay and Brand-Miller 14 ) reported small increases in estimated total sugars intake using dietary intake data for Australian adults and children/adolescents, although, again, the data for adults were gathered nearly two decades ago, and Welsh et al. ( Reference Welsh, Sharma and Grellinger 13 ) reported that both absolute and relative estimated intakes of added sugars have decreased in the US population between the years 1999–2000 and 2007–2008. A recent review of nutritional surveillance systems indicates that a number of countries in the developed world have now undertaken national surveys of dietary intake in individuals at more than one time point( Reference Harris and Caballero 15 ). Therefore, the purpose of the present review was to investigate within-country trends in dietary sugars intake using published data arising from national nutrition surveys. Where data allowed comparison, the review also examined the relationship between supply data (i.e. from the FAO) and estimated population intakes (i.e. dietary survey data) with regard to sugars.
Methods
Selection of data
A recent review of dietary surveys in the developed world was employed to identify countries and surveys within countries, which had undertaken multiple national nutrition surveys, and which might contain data to contribute to the present review( Reference Harris and Caballero 15 ). The results of these surveys, which were published in government reports or as scientific papers in peer-reviewed journals, and which documented dietary sugars intake, were accessed where possible. No trend data were available for the developing world( Reference Neufeld, Tolentino and Caballero 16 ). Data were only included for a country if all the following criteria were met: (a) the results of more than one survey had been published for a specific population within that country; (b) where reporting of results was comparable with respect to category of sugars, sex and age group; and (c) where surveys had analysed dietary intake at the individual level. Surveys were included, regardless of dietary assessment methodologies (for example, FFQ, diet histories or recalls, and food diaries), or other differences in survey methodologies (for example, difference in the number of days assessed), or changes in population demographics (for example, slight differences in age ranges reported, or ethnic representation). Where a dietary survey had been undertaken, but where sugars intake had not been reported, no further investigation was undertaken by the authors to determine sugars intake and that survey was not included.
Analysis and presentation of results
Mean or median results are summarised by country within age group and sex where available. The distribution of dietary intakes of sugars is illustrated, where available, with 95 % CI, standard deviations or standard errors of the mean as reported in the original reports. To allow consistency between results, all energy intakes are reported in MJ/d. Where energy intake was originally reported in kcal/d, this was converted to MJ/d using a conversion factor of × 0·00 418. Where % energy from sugars was not provided, this was calculated using a conversion factor of 1 g sugar providing 16 kJ energy. Due to differences between dietary assessment methodologies and population demographics there was no attempt to undertake statistical tests to analyse trends or differences. Apparent changes or trends were merely inferred from the data. However, where authors had already attempted to statistically analyse differences or trends in dietary sugars intakes these differences or trends have been reported.
Comparison with supply data
Where a country presented trends in dietary intake data for ‘added sugars’ or sucrose, and for all individuals (i.e. total population, regardless of age or sex), the intake data were compared with FAO supply data (FAOstat( 10 )) for the same time period.
Results
Reports for multiple national nutrition surveys, providing estimates of the population dietary intake of sugars, were accessed for thirteen countries, comprising ten European countries, together with Australia, New Zealand and the USA. Although multiple surveys have reportedly been undertaken in Belgium, Canada and South Korea( Reference Harris and Caballero 15 ), we were unable to locate publicly available reports or data on sugars intake which met the inclusion criteria and could contribute to the present review. As already stated, multiple surveys appear to have not been undertaken, as yet, in developing countries( Reference Neufeld, Tolentino and Caballero 16 ). While the sugars categorisation varied by country, the categorisation appeared, in the main, to remain constant within a country for successive surveys with some exceptions. In the USA, the category of added sugars has been adopted in preference to that of total sugars in surveys since the late 1990s. In addition, the definitions of both categories have changed to encompass a wider range of nutritive sweeteners (for example, various syrups, including corn syrup and high-fructose corn syrup). Due to this dramatic change in sugars definition, an early US report did not meet with our inclusion criteria and was therefore excluded from our investigation( Reference Glinsmann, Irausquin and Park 17 ). Both total sugars and non-milk extrinsic sugars (NMES) are reported in the UK. In the UK, NMES includes the sugars in fruit juice and 50 % of the sugars in canned, stewed, dried or preserved fruits( Reference Kelly, Summerbell and Rugg-Gunn 18 ), and intake is therefore usually greater than most definitions of ‘added sugars’ but less than that of total sugars. In addition, both sucrose and mono- and disaccharides have been reported in Germany, allowing the possibility of different changes/trends for these categorisations. The definition of relative energy from sugars also varied, being estimated relative to total energy in most countries and surveys, although some reported intakes relative to food energy (i.e. excluding alcohol) and these are indicated in the tables. The method of dietary analysis varied, with the majority of surveys employing 24 h recall (about 44 %) or dietary records (about 39 %), but with some surveys using diet history (about 8 %) or FFQ (about 8 %). The method of dietary analysis employed within countries in their dietary surveys also changed for most, though not all, countries over time. Analysis of trend data (i.e. from the earliest to the most recent survey) for countries ranged from 9 to 37 years, with the earliest included survey being undertaken in the USA in 1971–1975, and with inclusion of the most recent surveys for Australia and the UK (2011–2012).
Tables 1 and 2 summarise, for each country and population subgroup, the apparent direction and magnitude of change in absolute and relative intake of dietary sugars for the number of years spanned by successive surveys. The direction and magnitude of change are based on country-specific data, the detail for which can be found in Tables 3–9 for all individuals, adults (men and women combined), adult men, adult women, children/adolescents (males and females combined), male children/adolescents and female children/adolescents, respectively. Statistical comparisons between intakes in successive surveys have been undertaken for four countries (Australia, France, New Zealand and the USA).
Table 1 Direction of change in absolute sugar(s) intake together with magnitude of change (g/individual per d) and time span of surveys (years)

NMES, non-milk extrinsic sugars; ↑ , sugar(s) intake has increased; ↓ , sugar(s) intake has reduced; ↔ , sugar(s) intake has remained stable.
† Inconsistent changes across age groups.
‡ Changes are supported by statistical comparison.
Table 2 Direction of change in relative intake of dietary sugar(s) together with magnitude of change (% point change) and time span of surveys (years)

NMES, non-milk extrinsic sugars; ↑ , sugar(s) intake has increased; ↔ , sugar(s) intake has remained stable; ↓ , sugar(s) intake has reduced.
† Inconsistent changes across age groups.
‡ Changes are supported by statistical comparison.
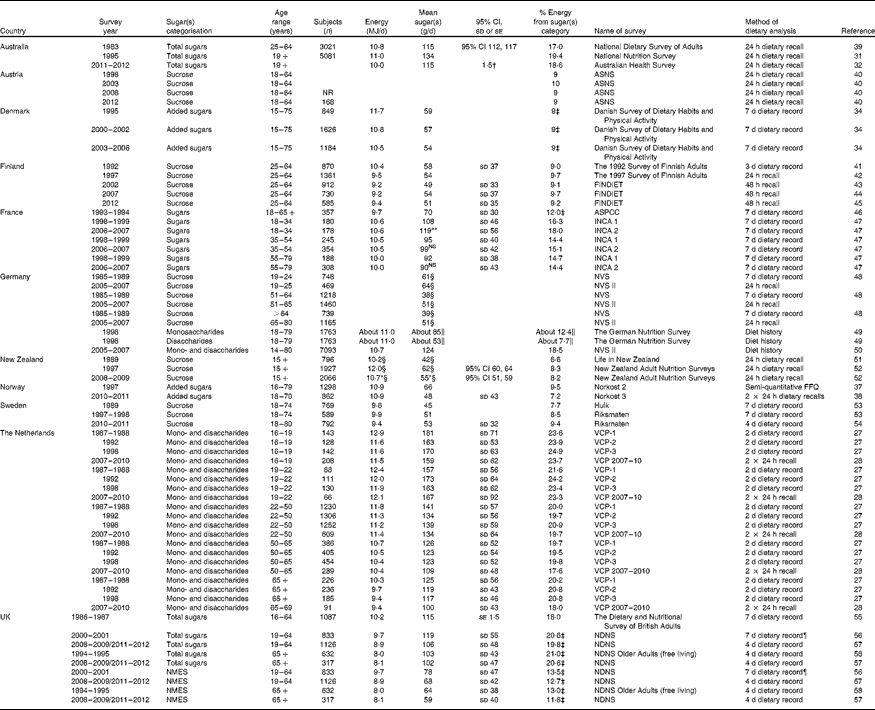
Table 3 Energy and ‘sugars’ intake for all individuals ordered by country

VCP, Voedselconsumptiepeilingen; NHANES, National Health and Nutrition Examination Survey; CSFII, Continuing Survey of Food Intake by Individuals.
Significant linear trend during the five 2-year NHANES cycles from 1999–2000 to 2007–2008: * P< 0·05, *** P< 0·001.
Table 4 Energy and ‘sugars’ intake for adults (men and women combined) ordered by country
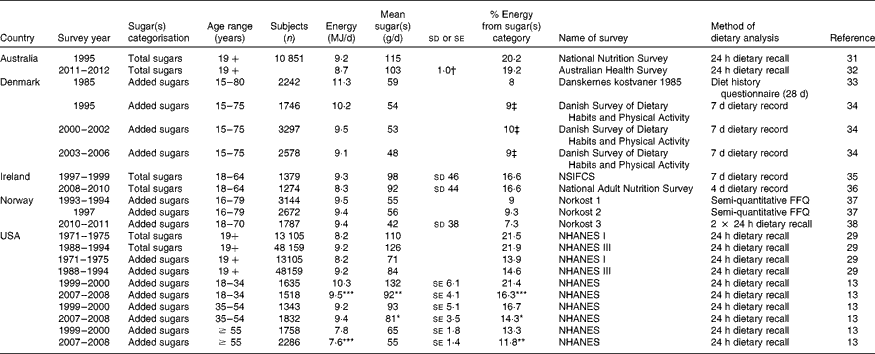
NSIFCS, North/South Ireland Food Consumption Survey; NHANES, National Health and Nutrition Examination Survey.
Significant linear trend during the five 2-year NHANES cycles from 1999–2000 to 2007–2008: * P< 0·05, * P< 0·01, *** P< 0·001.
† Relative standard error of estimate (%).
‡ Percentage food energy (excluding energy from alcohol).
Table 5 Energy and ‘sugars’ intake for adult men ordered by country
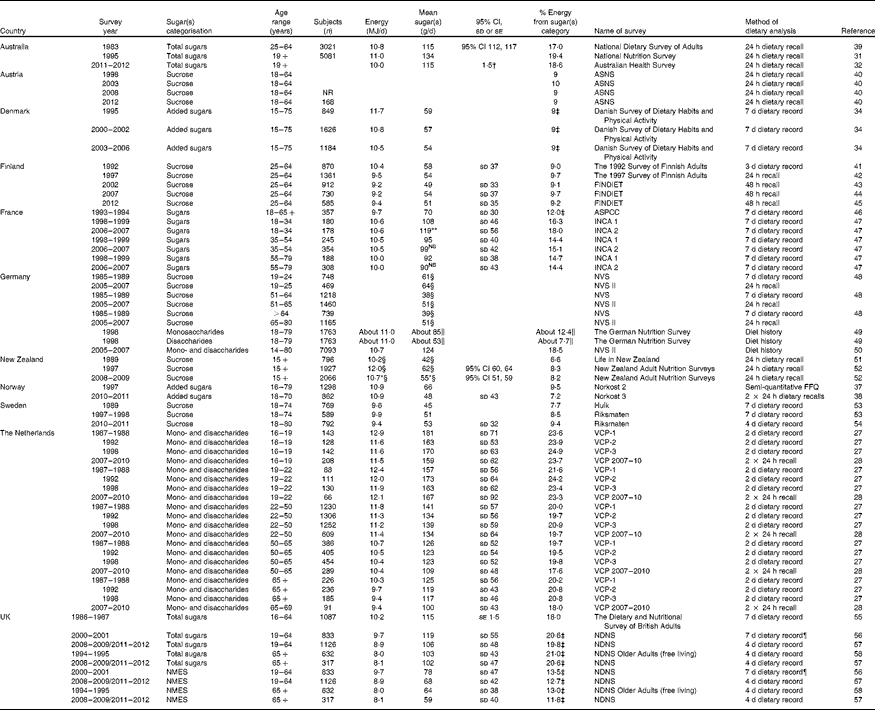
NR, not reported; ASNS, Austrian Study on Nutritional Status; ASPCC, French Association Sucre Produits Sucrés Consommation et Communication; INCA, Individuelle Nationale des Consommations Alimentaires; NS, not significantly different to previous survey; NVS, German National Food Consumption Survey; VCP, Voedselconsumptiepeilingen; NDNS, National Diet and Nutrition Survey; NMES, non-milk extrinsic sugars.
Mean value was significantly different from the previous survey: * P< 0·05, ** P< 0·01.
† Relative standard error of estimate (%).
‡ Percentage food energy (excluding energy from alcohol).
§ Median value.
∥ Results have been estimated based on not significantly different results reported for adult males sampled in East and West parts of Germany separately.
¶ Reanalysed to provide estimates for 4 d to allow comparison with later surveys.
Table 6 Energy and ‘sugars’ intake for adult women ordered by country
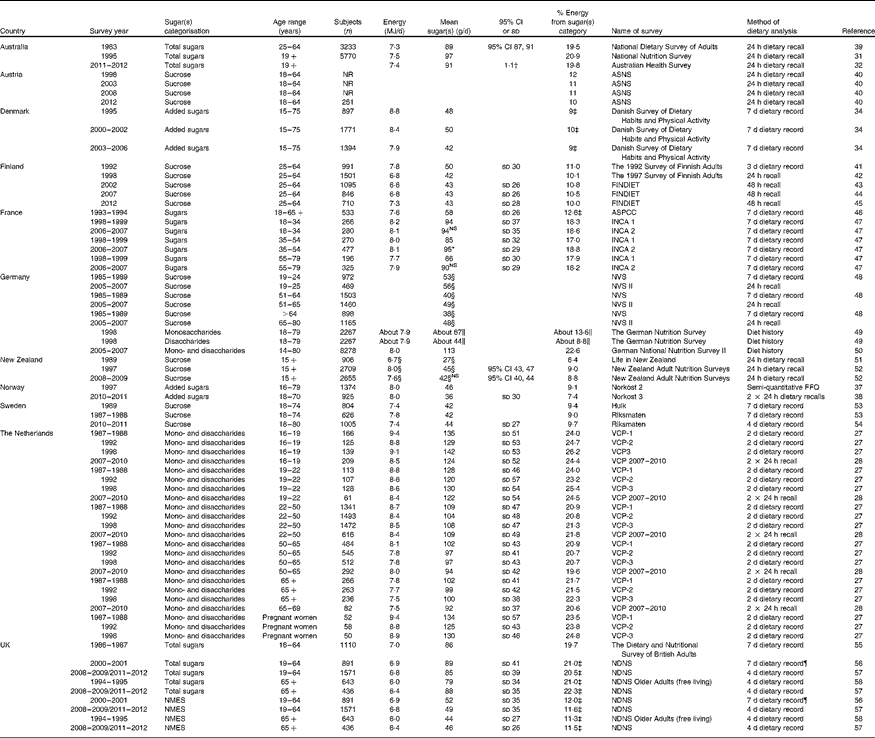
NR, not reported; ASNS, Austrian Study on Nutritional Status; ASPCC, French Association Sucre Produits Sucrés Consommation et Communication; INCA, Individuelle Nationale des Consommations Alimentaires; NS, not significantly different to previous survey; NVS, German National Food Consumption Survey; VCP, Voedselconsumptiepeilingen; NDNS, National Diet and Nutrition Survey; NMES, non-milk extrinsic sugars.
* Mean value was significantly different from previous survey (P< 0·05).
† Relative standard error of estimate (%).
‡ Percentage food energy (excluding energy from alcohol).
§ Median value.
∥ Results have been estimated based on not significantly different results reported for adult males sampled in East and West parts of Germany separately.
¶ Reanalysed to provide estimates for 4 d to allow comparison with later surveys.
Table 7 Energy and ‘sugars’ intake for children and/or adolescents (males and females combined) ordered by country
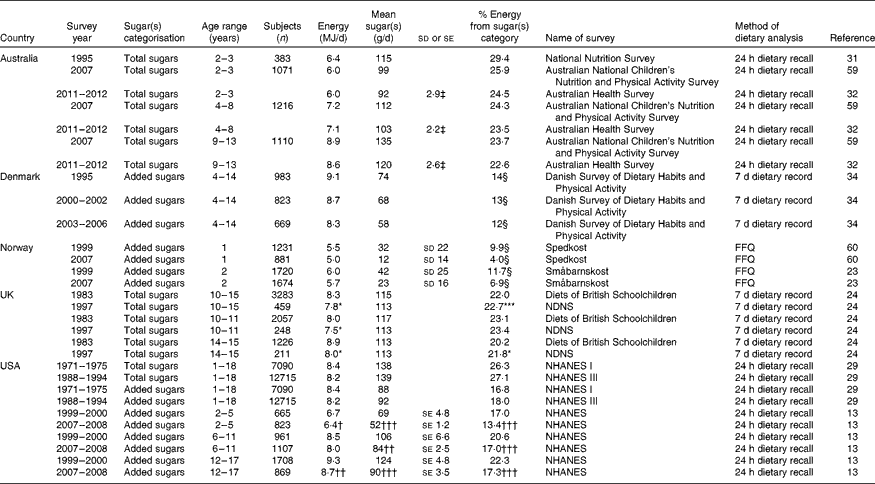
NDNS, National Diet and Nutrition Survey; NHANES, National Health and Nutrition Examination Survey.
Mean value was significantly different from previous survey: * P< 0·001, ** P< 0·01, *** P< 0·05.
Significant linear trend during the five 2-year NHANES cycles from 1999–2000 to 2007–2008: † P< 0·05, †† P< 0·01, ††† P< 0·001.
‡ Relative standard error of estimate (%)
§ Percentage food energy (excluding energy from alcohol).
Table 8 Energy and ‘sugars’ intake for male children and adolescents ordered by country
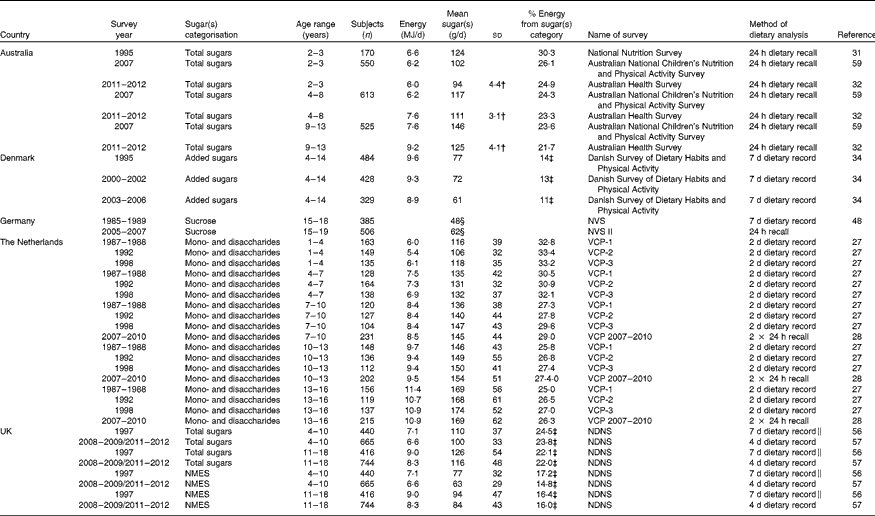
NVS, German National Food Consumption Survey; VCP, Voedselconsumptiepeilingen; NDNS, National Diet and Nutrition Survey; NMES, non-milk extrinsic sugars.
† Relative standard error of estimate (%).
‡ Percentage food energy (excluding energy from alcohol).
§ Median value.
∥ Reanalysed to provide estimates for 4 d to allow comparison with later surveys.
Table 9 Energy and ‘sugars’ intake for female children and adolescents ordered by country
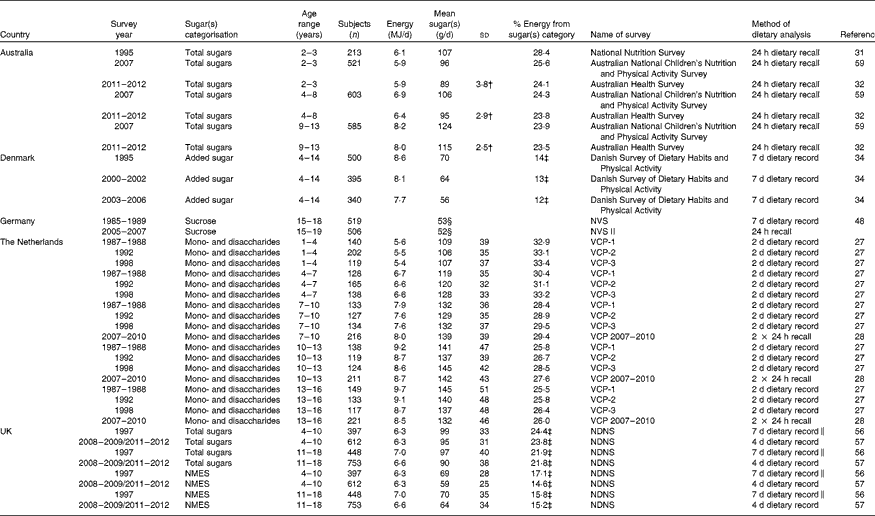
NVS, German National Food Consumption Survey; VCP, Voedselconsumptiepeilingen; NDNS, National Diet and Nutrition Survey; NMES, non-milk extrinsic sugars.
Mean value was significantly different from previous survey: * P< 0·05, ** P< 0·01.
† Relative standard error of estimate (%).
‡ Percentage food energy (excluding energy from alcohol).
§ Median value.
∥ Reanalysed to provide estimates for 4 d to allow comparison with later surveys.
Changes and trends on an absolute basis
Of the forty-nine possible country-, population- and category-specific comparisons which could be made on an absolute intake basis (g/d; Table 1), estimated intake of dietary sugars (irrespective of the categorisation) increased in seven comparisons, decreased in twenty-six comparisons, and remained relatively stable in one comparison. Dietary sugars intake increased before a subsequent decrease in seven comparisons, and with inconsistent findings by age-group subcategories in eight comparisons. Consistent trends, in terms of direction of change, and regardless of age or sex, were observed in Denmark, Finland and Norway where estimates of absolute intakes of dietary sugars appear to have decreased, in France where estimates of intakes have increased, and in the USA and New Zealand where intakes increased before a subsequent decrease. The direction of change in absolute intake of dietary sugars intake varied between age groups and/or sex for all other countries.
Where data were reported for both sexes and all age groups combined, sugars intake has decreased in The Netherlands, and increased and then decreased in the USA (zero overall change). In adults, when reported for both sexes combined, sugars intake decreased in Australia, Denmark, Ireland and Norway, and increased and then decreased in the USA (overall change varied by age group). In adult males, sugars intake increased in France, Germany (sucrose) and Sweden; decreased in Denmark, Finland, Germany (mono- and disaccharides), Norway and the UK (both for total sugars and NMES); and increased and then decreased in Australia (zero overall change) and New Zealand (overall positive change). In adult females, the category of sugars intake increased in France and Germany (sucrose); decreased in Denmark, Finland and Norway; remained stable in Germany (mono- and disaccharides), Sweden and the UK (NMES); and increased and then decreased in Australia and New Zealand (both overall positive change). In children/adolescents, sugars intake for both sexes combined decreased in Australia, Denmark and Norway, and increased and then decreased in the USA (overall change varied by age group). Sugars intake decreased in Australian, Danish and UK children/adolescents (both total sugars and NMES) when reported separately by sex, and in female German adolescents. Sugars intake increased in male German adolescents.
There were only four countries that reported dietary intake of what are considered to be added sugars (NMES in the UK). In Denmark, Norway and the USA, estimated intake of added sugars decreased, although in the USA this decrease occurred following a prior increase. In the UK, most estimates of NMES intake decreased, although findings are inconsistent in some sex/age group combinations.
The magnitude of change and the time span covered by successive surveys varied widely (see Table 1), with the largest increase apparent in New Zealand adult females (estimated 15 g increase over a 20-year period for sucrose). The largest overall decrease seems to have occurred in Norway, with an apparent 18 g decrease in added sugars for adult males over a 14-year period. However, the estimated intake of added sugars has also apparently fallen by 23 g over the last 9 years in the USA.
Changes and trends on a relative basis
Of the forty-four possible comparisons that could be made on a relative basis (% energy; Table 2), increasing % energy from dietary sugars was apparent in six comparisons, with decreasing % energy from dietary sugars in seventeen comparisons, and apparent stability in eight comparisons. Findings were inconsistent for age-group subcategories in ten comparisons. The % energy from dietary sugars increased before decreasing again in three comparisons. The direction of change in relative intake of dietary sugars was only consistent across both sexes and for all age groups (adults and children/adolescents) in New Zealand and Sweden (both increased), Norway (decreased) and the USA (increased and then decreased). The direction of change in relative intake of dietary sugars varied between age groups and/or sex for all other country comparisons.
In the countries that reported intake as added sugars (NMES in the UK), with the exception of adult women aged 65+ years, where estimated intake of NMES has increased by less than 1% energy, estimated % energy from added sugars decreased or remained stable.
In relative energy terms, the magnitude of change and the time span covered by successive surveys varied widely (see Table 2), with the largest increase (2 % points) apparent in Australian adult males (over a period of 25 years) and New Zealand adult males and females (over a period of 20 years). The largest decreases were apparent in Danish male children/adolescents (3 % points decrease over 11 years). The estimated intake of added sugars has also decreased, over more recent years, in the US population (3 % points decrease in added sugars over 9 years). Although the direction of change for the dietary intake of sugars was comparable in absolute and relative terms in some countries (Norway and the USA), in all other countries there was no consistent agreement between the directions of change in relative and absolute terms.
Comparison with supply data
The USA was the only country that reported dietary intake data in a form (i.e. for the total population and as ‘added sugar’ or ‘sucrose’) that could allow comparison with supply data. By our approximations, simultaneous US supply data as reported to the FAO appear to exceed estimates of absolute intake by about 100 %. Estimated intake and supply data appeared closer in magnitude when reported in relative terms (% energy); however, a simple Pearson correlation revealed no relationship between dietary intake and supply data in either absolute (r 0·46; P>0·1) or relative (r − 0·32; P>0·1) terms.
Discussion
A number of developed countries have now undertaken multiple national nutrition surveys, which allowed us to investigate trends in dietary sugars intake. The main finding of the present review was that in the majority of age group/sex combinations, where comparisons could be made, estimates of mean population sugars intake appear to have been stable or decreasing. In a relatively small subset of country-, age- and sex-specific subpopulations intakes may have increased. Although it was possible to investigate trends within a country, differences in categorisation and definitions of sugars, dietary assessment methodologies, and age/sex reporting categories employed between countries made it difficult to draw broader conclusions.
Data were available for thirteen countries where multiple national nutrition surveys have been undertaken and which included analysis on dietary sugars intake. With regard to specific country, sex and age groups, dietary intake of sugars appeared to be stable or have decreased in 55 % of absolute and 57 % of relative (energy-adjusted) comparisons. Absolute increases ranged from 2 g/d over a 10-year period in Swedish adult females to 15 g/d over a 20-year period in New Zealand adult females. Such changes resulted in relative increases that ranged up to a maximum 2 % points increase in Australian adult males (over a period of 29 years) and New Zealand adults (over a period of 20 years). In contrast, dietary intake of sugars appears to have increased in 14 % of comparisons when examined either by absolute or relative intake. Absolute decreases ranged from 1 g/d in German female children/adolescents over a period of 22 years to 18 g/d in male Norwegian adults over a period of 14 years. Relative decreases ranged up to a 3 % points decrease in male Danish children/adolescents over a period of 11 years. The remainder of the comparisons increased and then decreased or varied in direction by subgroup of age. In countries that specifically reported intake as ‘added sugars’ (Denmark, Norway and the USA) intakes appear to be decreasing in absolute terms, and decreasing or stable in relative terms. Estimated NMES intake in the UK is slightly less consistent, although in general intakes are decreasing or stable. The adolescent population is frequently considered to be of particular concern regarding their dietary sugars intake, as they have reported the highest intake of sugars in some countries( Reference Ervin, Kit and Carroll 19 ). Although the dietary intake of sugars may have increased in some adolescent population groups (Dutch males), it has reduced in others (Denmark, USA, UK males and Dutch females).
There was relatively little agreement between direction of change in dietary sugars intake in absolute and relative terms, which indicates that energy intakes from other energy-providing nutrients are also changing. It was outside the scope of the present review to report on these other changes, which undoubtedly also vary by country, sex and age group. However, as dietary guidelines are frequently presented in % energy terms, any change in a particular energy-providing nutrient in % energy terms may not necessarily reflect absolute changes in intake of that nutrient. For example, authors have reported that attempts to reduce dietary fat consumption in the USA have been successful with % energy from fat having decreased( Reference Hu 20 ). However, closer examination of the data reveals that absolute fat intake (g) does not appear to have decreased, and the reduction in % energy from fat merely reflects the effects of an increase in absolute energy intake from other macronutrients (mainly total carbohydrates in this example)( Reference Austin, Ogden and Hill 21 ).
The magnitude of change in dietary sugars intake, where it could be ascertained, also varied widely between countries, sexes and age groups. The method of dietary analysis, which was employed in countries, frequently varied over time. Small changes in dietary intake of sugars could be due to changes in the method of dietary analysis. However, some marked differences in sugars intake between earlier and later surveys were apparent in specific population groups in certain countries. These differences have been suggested to be due to methodological aspects in France( 22 ) and a reduction in sugar-sweetened beverage intake in Norwegian children( Reference Kristiansen, Andersen and Lande 23 ).
In contrast to total world food supply, per capita supply of both refined sugar (sucrose) and total sugars and sweeteners has been stable since the late 1970s (FAOstat)( 10 ). Supply data do not easily account for wastage, cannot inform on specific subpopulation intake, and their use in informing public health guidelines has been criticised in at least the USA( Reference Crane, Lewis and Yetley 11 ). The USA was the only country that reported dietary intake data in a form that allowed comparison with supply data, i.e. reported data for added sugars intake for all individuals. By our approximations, simultaneous US supply data, as reported to FAO, may exceed estimated intake by about 100 % and there appears to be no relationship (P>0·05) between dietary intake and supply data in either absolute or relative terms. Although examination of trends in supply data may have its uses in forming research hypotheses and in ascertaining availability of nutrients to a population, a lack of, or poor, association between supply and estimates of actual consumption suggests greater caution should be exerted when using supply data as an interpretation of dietary intake.
There are a number of noteworthy limitations in this analysis of trends in dietary sugars intake. The data currently extend to relatively few countries in the developed world and, in some cases, cover somewhat short time periods (the shortest time period was 9 years for mono- and disaccharide intake in German adults). Therefore, the degree to which our findings may be considered worldwide is limited. The methods of assessing dietary intake also varied, with most surveys employing food diaries or 24 h recalls. An exception to this was Norway, which used FFQ in some surveys. We are unable to comment on the degree to which misreporting may have affected the results of surveys, since only a few reports and papers specifically refer to this source of potential error. For example, analysis of UK data in children and adolescents provided different results for total sugars intake in one age group depending on whether identified over- and under-reporters of energy intake were included in the analysis( Reference Gibson 24 ). It may be proposed that an increased focus on dietary sugars intake in the scientific and general media could affect self-reporting in some or all population sectors in more recent surveys.
As noted previously( Reference Hess, Latulippe and Ayoob 3 ), a variety of terms is employed by countries in estimating dietary sugars intake. Such diversity makes comparisons between countries, or indeed within some countries, difficult. It has previously been suggested that the most useful terminology is total sugars, with further division, where necessary, into mono- and disaccharides( Reference Cummings and Stephen 25 ). Very few countries or authors appear to have examined differences or trends in sugars intake( Reference Crane, Lewis and Yetley 11 , Reference Stephen, Sieber and Gerster 12 , Reference Barclay and Brand-Miller 14 ), or the statistical significance of these differences where they were reported. The rudimentary level of our analysis is acknowledged and it is suggested that all comparisons should be viewed with caution. Although some changes may reflect real differences in dietary intake, they may also reflect methodological or demographic differences between surveys. In addition, the analysis only allows some comparison by sex and age group with no further analysis by ethnic groups or socio-economic status.
Summary
Results of national nutrition surveys are important in informing research and public health policy. Multiple national nutrition surveys have been undertaken in a number of developed countries, and reveal that the direction of change of dietary sugars intake can vary by subpopulation. Therefore, references to changes in dietary sugars intake should be made, wherever possible, in relation to specific populations, i.e. by country, sex and age group. Although estimates of mean population dietary sugars intake may be increasing in some specific subpopulations, most comparisons reveal stable or decreasing trends in dietary sugars intake.
Acknowledgements
The present review was supported by the World Sugar Research Organisation (WSRO).
A. W. sourced the publications, entered the data to be included in the report, analysed the trends, and wrote the first draft of the manuscript; J. W. verified the trends, aided in interpreting the data, provision of data, advised on the content and helped revise subsequent drafts for intellectual content. Any differences of opinion were mutually agreed following discussion between the authors.
A. W. is an employee of the WSRO. J. W. received a fee from the WSRO for academic support of the present review. International Life Sciences Institute (ILSI) guidelines relating to financial conflicts and scientific integrity( Reference Rowe, Alexander and Clydesdale 26 ) were followed.

