Introduction
The Convention on Biological Diversity (CBD), adopted at the 1992 UN Conference on Environment and Development in Rio de Janeiro, Brazil, was intended to stimulate and encourage governments to counteract rapid declines in the extent and condition of natural ecosystems, the abundance of wild species and the benefits to humanity that wild nature provides. Under the Convention 190 countries pledged in 2002 to reduce significantly the rate of biodiversity loss by 2010. This objective was also incorporated into the Millennium Development Goals (UN, 2009) in recognition of the adverse effects of biodiversity loss on human well-being (Sachs et al., Reference Sachs, Baillie, Sutherland, Armsworth, Ash and Beddington2009). The European Union (EU) went further by adopting a target of halting biodiversity decline in Europe by 2010.
Various indicators of the state of biodiversity, benefits derived from it and factors affecting it were adopted by the CBD and EU to measure whether or not these targets had been attained (EEA, 2009; Walpole et al., Reference Walpole, Almond, Besançon, Butchart, Campbell-Lendrum and Carr2009). Although data of sufficient quality were not obtained for all of the chosen indicators it is now clear that neither the CBD nor the EU targets were reached (EEA, 2009; Butchart et al., Reference Butchart, Walpole, Collen, van Strien, Scharlemann and Almond2010). At the global level most indicators of the state of biodiversity have worsened during the last 4 decades and none shows a significant recent reduction in the rate of decline (Butchart et al., Reference Butchart, Walpole, Collen, van Strien, Scharlemann and Almond2010). This dismal result stimulated the 10th Conference of the Parties to the CBD in Japan in October 2010 to adopt a revised strategic plan for tackling biodiversity loss, including stronger, more comprehensive, more explicit and more measurable targets for 2020 (the 20 Aichi biodiversity targets; CBD, 2010a).
Targets in the new CBD Strategic Plan will require indicators with which to track progress and the CBD has called for a process, beginning in 2011, to develop a new suite of indicators, building on the existing CBD indicator framework (CBD, 2010b). This placed indicators in seven focal areas: status and trends of the components of biodiversity; sustainable use; threats to biodiversity; ecosystem integrity and ecosystem goods and services; status of traditional knowledge, innovations and practices; status of access and benefit sharing; and status of resource transfers. Yet, although this framework was adopted widely, it was not always obvious how the focal areas relate to one another, or how the indicators can be used in combination to inform and monitor policies for slowing or preventing biodiversity loss.
A consensus is emerging that indicators placed into a framework of responses, pressures, state and benefits are more logical, understandable, user-friendly, policy relevant and communicable. This idea was incorporated into the recommendations of an International Expert Workshop on post-2010 Indicator Development held at Reading, UK in July 2009 (UNEP–WCMC, 2009; Walpole & Herkenrath, Reference Walpole and Herkenrath2009), restated in Walpole et al. (Reference Walpole, Almond, Besançon, Butchart, Campbell-Lendrum and Carr2009) in their review of progress in global biodiversity indicator development, and discussed at the 14th meeting of the CBD’s Subsidiary Body on Scientific, Technical and Technological Advice in May 2010. Such a framework was used to present an analysis of all global biodiversity indicators by Butchart et al. (Reference Butchart, Walpole, Collen, van Strien, Scharlemann and Almond2010). The draft new CBD Strategic Plan places proposed new targets under five goals of which four are directly related to this framework. Walpole et al. (Reference Walpole, Almond, Besançon, Butchart, Campbell-Lendrum and Carr2009) went further to recommend that sets of indicators under these four focal areas should refer to underlying measures that are causally linked. This would clarify to policy-makers how biodiversity loss affects people and how actions to reduce threats make a difference, allowing better assessment of the effectiveness of responses and adaptive improvement where necessary. Such an approach would be useful within a CBD context but also more broadly for monitoring responses to biodiversity loss in any sector and at any scale.
Here we further develop the idea of a linked framework and explore its practicality by applying it to two examples: humid tropical forests and marine fish populations. We conclude that the approach has considerable merit, although there are barriers to implementation. Indicators may not yet be available at the appropriate scale, or in the required form (e.g. we often need, but do not yet have access to, appropriate data to judge the degree to which extraction of an ecosystem service is sustainable). Furthermore, at the present time, some linkages between indicators are assumed to be causal but these remain to be demonstrated.
The linked indicators framework
The 2009 Reading workshop participants concluded that a new indicator framework was needed with a clearer logical structure. They advocated the adoption of indicators from four focal areas: threats to biodiversity, state of biodiversity, ecosystem services and policy responses. This was a simplification and modification of the widely used driver-pressure-state-impact-response (DPSIR) framework. They also recommended that relationships between the focal areas and between indicators and targets should be made explicit. Here, we develop these ideas further and make more detailed proposals. These four focal areas can be modified for simplicity of use and communication as:
Responses: indicators measuring the implementation of policies or actions to prevent or reduce biodiversity loss
Pressures: indicators monitoring the extent and intensity of the causes of biodiversity loss that responses aim to address
State: indicators analysing the condition and status of aspects of biodiversity
Benefits: indicators quantifying the benefits that humans derive from biodiversity
The order begins with responses, rather than pressures, to emphasize that the guidance of policy and other practical actions is the central purpose of the indicator set. Hence, we term this approach Response-Pressure-State-Benefit (RPSB). Although this suggests a linear relationship, in reality it forms a feedback loop (Fig. 1). As with the DPSIR framework there are instances when it can be argued that individual indicators could belong to more than one category; e.g. the offtake of a fishery could be seen as a benefit or a pressure, depending on whether it is sustainable or not.
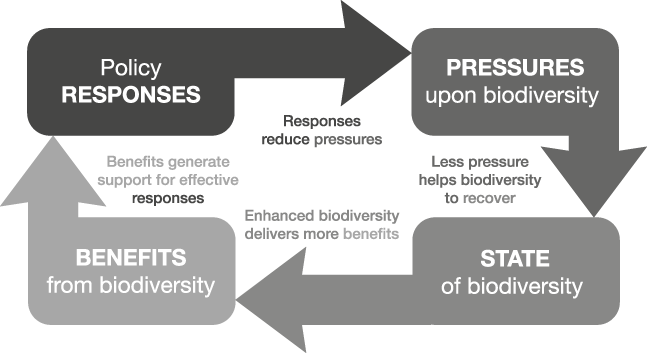
Fig. 1 A schematic diagram showing how the four types of indicators can be linked to create a more informative set that will better guide policy.
For any given system or sector of concern (as defined by the policy context), indicators of all of these four types should be obtained and linked together into a set, with the assumed or demonstrable causal or logical connections between them made explicit. Consideration needs to be given to spatial scale, ecological characteristics and stakeholder interests. The most appropriate scale will be determined by the level at which decision making and management occurs. For terrestrial habitats such as forests the national scale may be most appropriate, whereas for resources shared among nations, such as marine fisheries, the appropriate scale will probably be larger. There could be one or several indicators of each type for a given system. Initially, the connections between indicators may be no more than the conceptual, logical linkages that are implicit in the DPSIR and other similar frameworks. Explicitly stating the logical connections among indicators of all four types is important if adverse changes are to be counteracted effectively, as this makes clear the assumptions and working hypotheses about the mechanisms by which policies and actions affect the system.
These connections are illustrated in Fig. 1. The framework posits sequential links between all four types of entities represented by the indicator types, including a link between the last in the list (benefits) and the first (responses). Hence, the framework implies that responses influence the pressure on biodiversity and hence its state, which in turn influences the quantity and quality of benefits, with changes in the benefits derived from biodiversity then influencing policy and other responses (e.g. by increasing public support for continued or enhanced conservation).
Although Fig. 1 only shows effects of benefits on responses, it could be argued that there could also be a direct link between states and responses. However, reinforcement of those responses is likely to depend rather upon the values and benefits attributed to biodiversity. Thus, the link is actually routed through benefits, although not necessarily ones that involve marketed or consumed goods and services.
Finally, uncertainties exist in the cause-effect relationships between responses, pressures, states and benefits. These uncertainties may be magnified by imperfect indicators in each focal area. Consequently there will be a need for an adaptive management approach to the interpretation and use of indicators in which both the responses and the effort put into them are modified iteratively according to outcomes.
To explore the practicality of the linked indicators approach we applied it to two systems: humid tropical forests and marine fisheries. We looked for data and indicators that are currently available to populate the framework, recognizing that the majority of these require further development and enhancement. In some cases the indicators we use are surrogates for more directly relevant, but currently unavailable, measures, or are regional examples for which global data are not yet available.
Example 1 Humid tropical forests (Fig. 2)
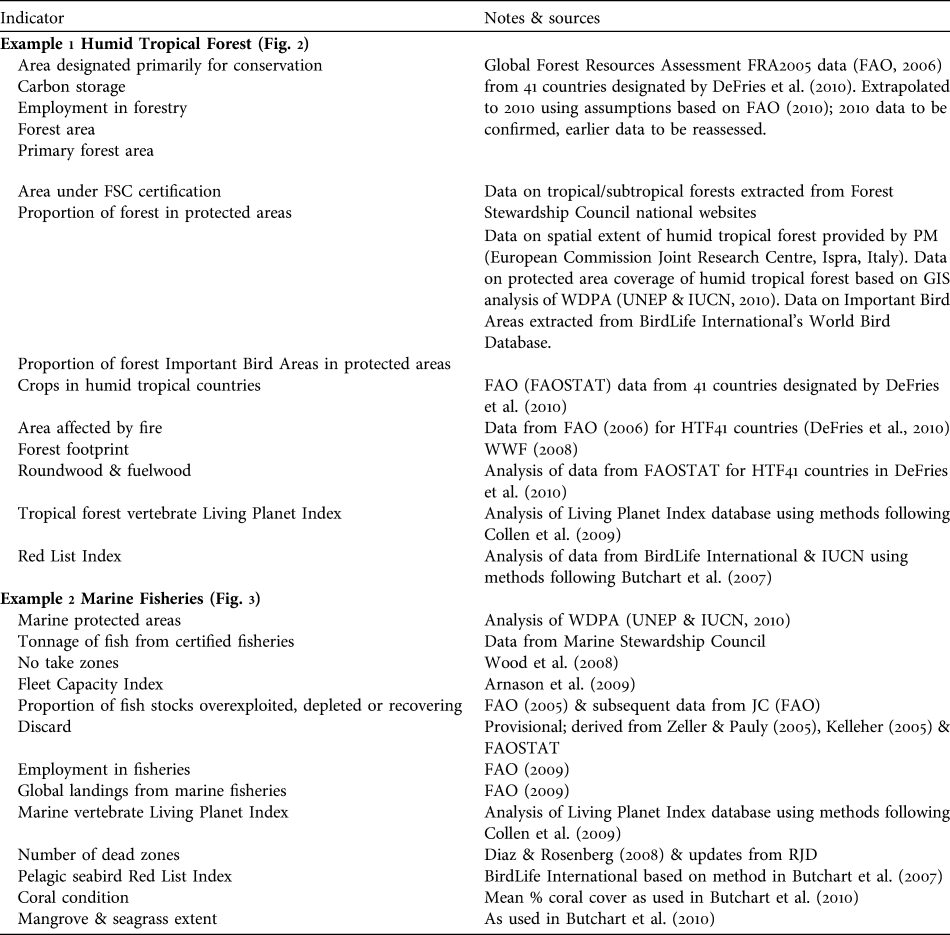
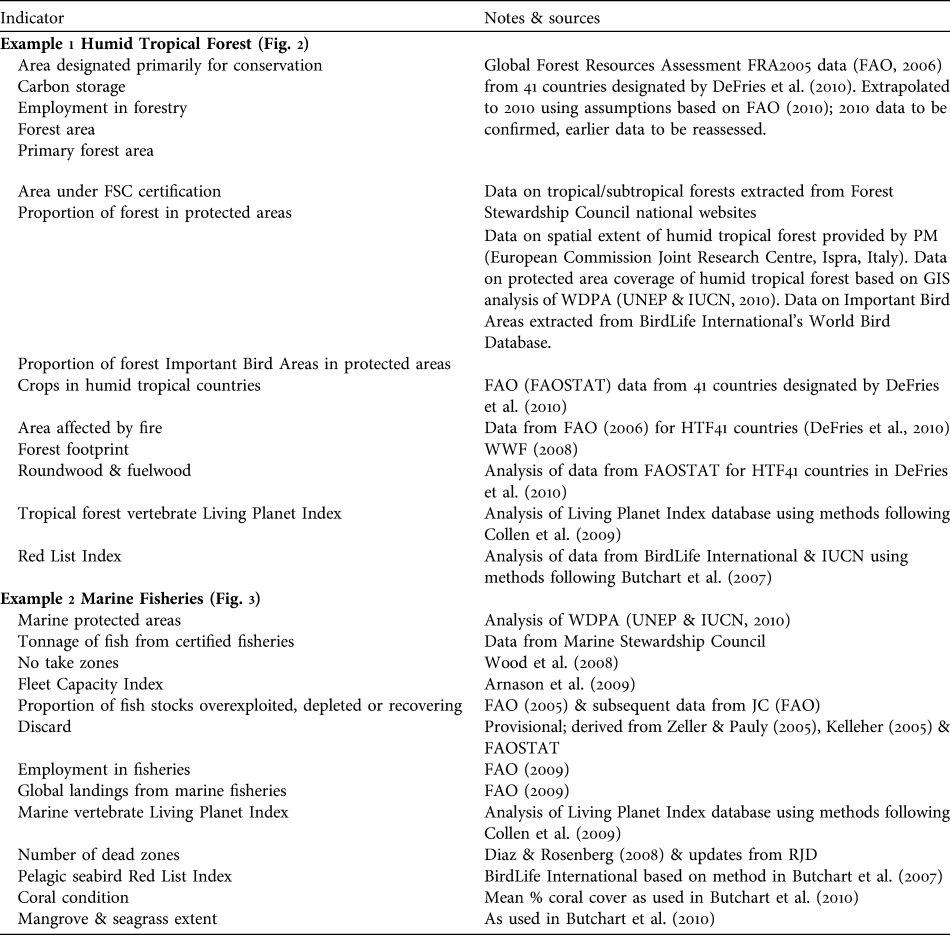
Humid tropical forests support a great diversity of plant and animal life, and the livelihoods of many people, but are being rapidly destroyed and degraded. Responses to reduce loss and degradation of forests and the species they hold include effectively managed protected areas within which pressures such as logging, clearance for agriculture, grazing, setting of fires, extraction of non-timber forest products and hunting are appropriately controlled to ensure sustainability. Promotion of forest products certified as sustainably harvested may also help to alleviate over-harvesting. We identify several potential indicators of responses. These include the proportion of humid tropical forest designated primarily for conservation. As a surrogate in Fig. 2 we use the area of forest designated for conservation based on data from FAO (2006) expressed as a proportion of the combined area of forest in the 41 countries (HTF41) listed by DeFries et al. (Reference DeFries, Rudel, Uriarte and Hansen2010) that collectively hold > 98% of all humid tropical forest, recognizing that these countries also contain other forest types. The area of tropical/subtropical forest certified as sustainably managed by the Forest Stewardship Council was also identified because this scheme is designed to allow tropical forest and many of its species to persist. Other response indicators that reflect the level of protection given to forests include the proportion of humid tropical forest area covered by protected areas (all IUCN categories, as listed in the World Database on Protected Areas; UNEP & IUCN, 2010) and the mean proportion of forest Important Bird Areas (critical sites for conservation of the world’s birds) covered by protected areas. These indicators measure, in different ways, the area within which statutory interventions apply that are designed to promote the persistence of tropical forest and its biodiversity.
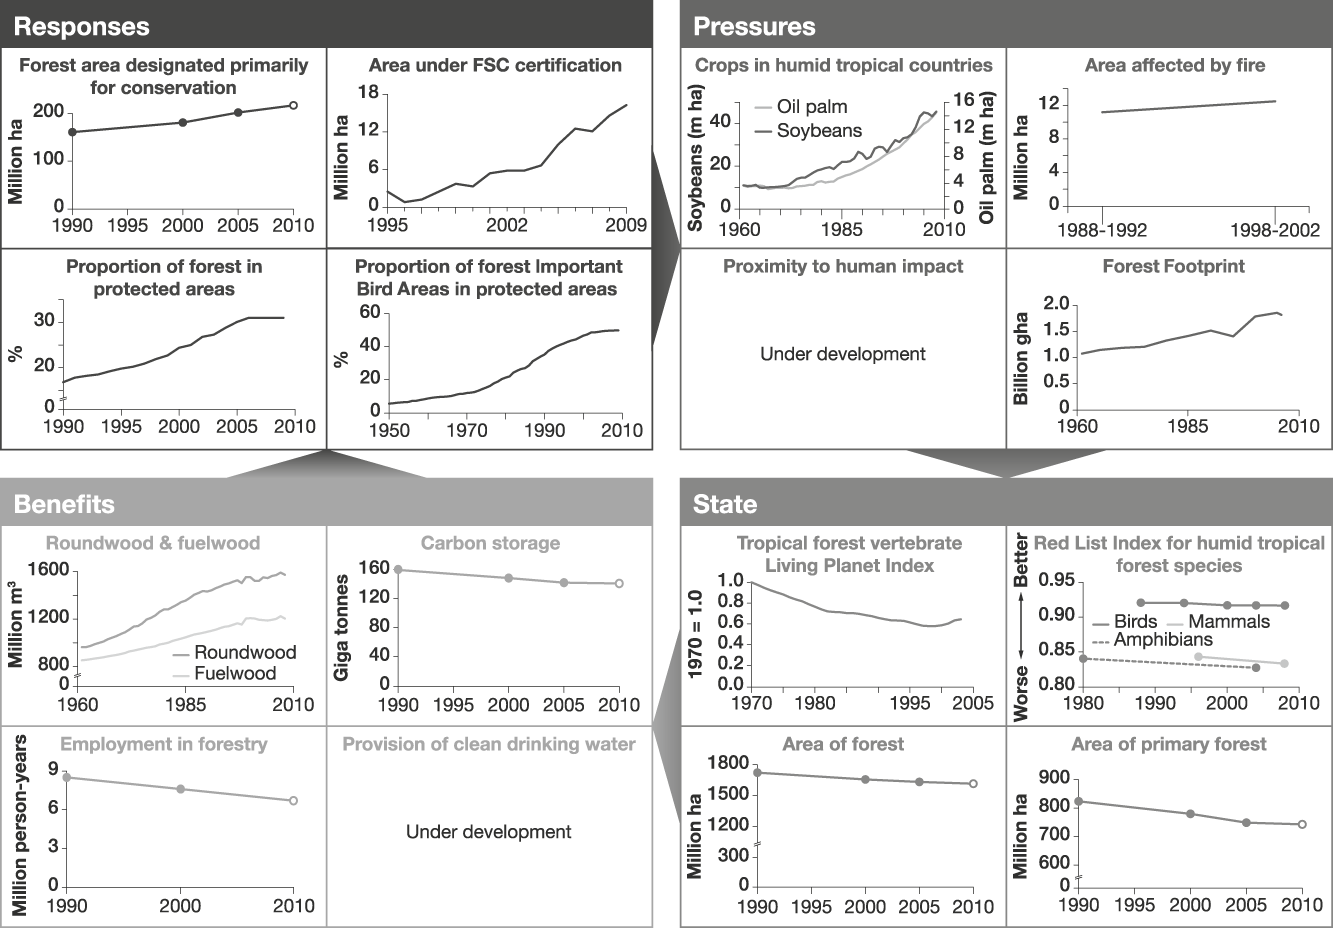
Fig. 2 An example of a linked indicator set for humid tropical forest, with illustrative examples (for further information on individual indicators, see Appendix). Note that to enable trends to be discerned the scales of the x-axes vary.
Indicators of the pressures on humid tropical forest include the area of crops such as soybean and oil palm, which are key land uses to which humid tropical forests are being converted. A better indicator would be the area of forest actually converted annually to each key crop; such data are not readily available at present but could be developed using remote sensing. Other pressure indicators include the area of humid tropical forest affected by fire, the area clear-felled, and levels of unsustainable harvest of bushmeat and of other forest products. Global data for the latter three are currently unavailable but the area of forest close to roads and other human infrastructure could be a useful proxy for these as exploitation is usually most severe close to areas easily accessed by people (Oliveira et al., Reference Oliveira, Asner, Knapp, Almeyda, Galván-Gildemeister and Keene2007). The Forest Footprint, a combination of several impacts of human activity on tropical forests (WWF, 2008), is used as another pressure indicator. These indicators and the response indicators are likely to be linked because statutory protection should lead to a reduction in clear-felling (Andam et al., Reference Andam, Ferraro, Pfaff, Sanchez-Azofeifa and Robalino2008; Pfaff et al., Reference Pfaff, Robalino, Sanchez-Azofeifa, Andam and Ferraro2009), conversion of forest to agricultural land, anthropogenic fires (Nelson & Chomitz, Reference Nelson and Chomitz2009) and unsustainable harvesting of bushmeat and other forest products. Certification of timber extraction should lead to reductions in clear-felling and unsustainable harvesting of forest products. These assumed linkages need testing; if they are found to be weak the response indicators would need to be modified. For example, if some categories of statutory protection are found to be ineffective in reducing the operation of pressures then the indicator should be refined to include only types of protection that do alleviate pressures.
The state of humid tropical forest biodiversity can be monitored by indicators such as tropical forest vertebrate population trends (using the Living Planet Index: Collen et al., Reference Collen, Loh, Whitmee, McRae, Amin and Baillie2009; or potentially, with further development, the Wildlife Picture Index: O’Brien et al., Reference O’Brien, Baillie, Krueger and Cuke2010), trends in extinction risk of tropical forest species (using the Red List Index: Butchart et al., Reference Butchart, Akçakaya, Chanson, Baillie, Collen and Quader2007) and the extent of total and primary forest. These indicators are selected to reflect aspects of tropical humid forests that determine their value in maintaining biodiversity and the benefits derived from it. The extent of forest has an important influence on the biodiversity it supports but because unsustainable harvesting of certain species can reduce biodiversity whilst the land cover remains as forest, indicators of species' abundance and extinction risk are also needed.
Indicators of the benefits people derive from humid tropical forests include the volume of roundwood and fuelwood extracted from tropical humid forests, the mass of carbon stored above and below ground, and the number of people employed in forestry (for which we used data from FAO, 2006, for HTF41 countries as a proxy). Employment and wood extraction require a distinction to be made between sustainably and unsustainably harvested fractions but this is not possible at present. Other desirable indicators of benefits derived from tropical forests that are not currently available include measures of the contribution of humid tropical forest to the provision of water for human use, and the volume of sustainably harvested non-timber forest products. The link between the indicators of the state of forests and the quantity of benefits derived from them is assumed to be that larger extents of forest under sustainable management will lead to greater long-term benefits. This relationship is clearly complicated for timber, fuelwood and other non-timber forest products because unsustainable harvesting could temporarily lead to larger flows of benefits: hence the importance of developing indicators tracking the fraction of these benefits that is sustainable.
Fig. 2 illustrates that, while responses are increasing, pressures have not reduced, and the state of humid tropical forest is continuing to deteriorate, as are the benefits, apart from the volume of wood extraction (for which increasing trends probably reflect the unsustainability of the harvest).
Example 2 Marine fish populations and associated biota (Fig. 3)
Oceans and coastal seas cover 70% of the planet’s surface and support highly diverse communities, including marine fish populations that provide c. 10% of the global human population’s intake of animal protein (rising to 50% in some developing island states; FAO, 2009). There is growing awareness of the vulnerability of these systems and the consequences for people of adverse changes, with the harvest from marine wild-capture fisheries having levelled off over the last decade, despite increasing fishing effort (FAO, 2009).
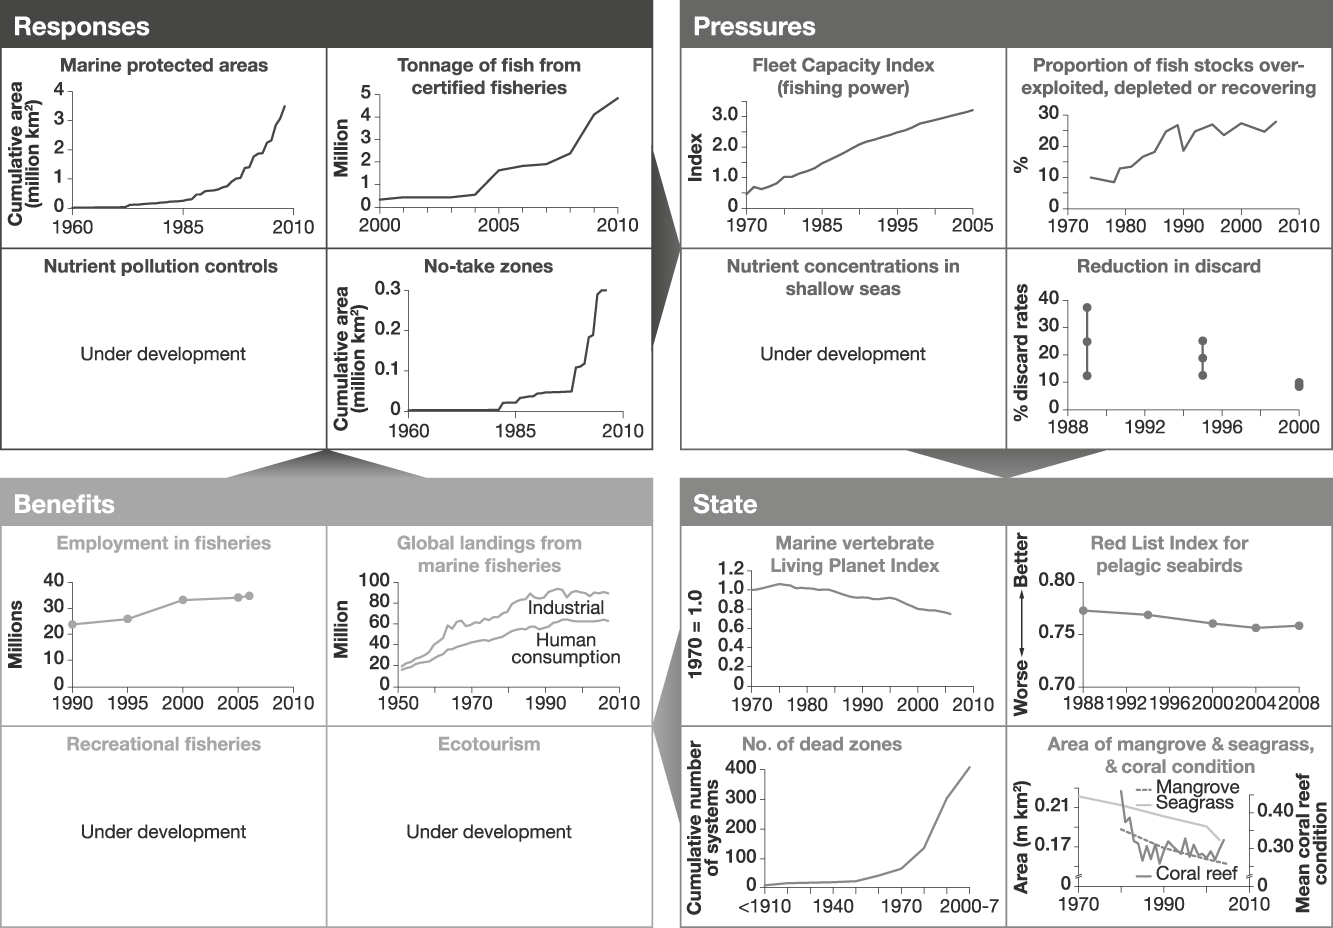
Fig. 3 An example of a linked indicator set for marine fisheries, with illustrative examples (for further information on individual indicators, see Appendix). Note that to enable trends to be discerned the scales of the x-axes vary.
The indicators of responses to reduce losses of marine fish populations that were identified reflect the importance of overfishing as a negative pressure on the state of fish populations. Measures are available for the extent of marine protected areas, and the proportion of marine fish harvest that is certified as sustainable (for which we used absolute levels certified or awaiting approval from the Marine Stewardship Council as a proxy). Additional potential indicators of responses to overfishing or misdirected fishing that are currently unavailable globally include the extent of restrictions on catches and methods used for fishing, and the degree of implementation of measures to reduce bycatch (of non-target fish, and of birds, mammals and turtles; Croxall, Reference Croxall2008; Worm et al., Reference Worm, Hilborn, Baum, Branch, Collie and Costello2009). Indicators of responses to pressures on marine fish populations other than overfishing could include measures to control pollution of the seas by nutrients, and protection of coastal habitats important to wild fish from conversion to use for agriculture, aquaculture and industry. A further response could address controls on carbon dioxide emissions that are influencing both sea surface temperature and ocean pH. Information on no-take zones is already available.
Indicators of pressures on marine fisheries associated with overfishing and misdirected fishing include the global capacity of fishing vessels and the proportion of fish stocks that are overexploited, depleted or recovering. We assume that these link directly with the indicators of responses designed to control them. As for forest protection responses, these links need testing and, if found to be weak, would need to be changed appropriately. Indicators of pressures other than overexploitation could include measures of levels of pollution (including nutrients, oil, PCBs and plastic) and the extent of reclamation and conversion to aquaculture, agriculture and industry of coastal habitats important as nursery and feeding areas for marine fish (such as mangroves, coastal marshes, estuaries and reefs). Indicators of discard rates may reflect the accuracy of targeting species and utilization of the catch. Further indicators could include measures of global mean sea surface temperature and ocean acidity, both of which are likely to affect the distribution and abundance of many marine species, and link to responses that reduce emissions of greenhouse gases (Cheung et al., Reference Cheung, Lam, Sarmiento, Kearney, Watson and Pauly2009).
The state of marine fish populations and associated biota can be monitored using marine vertebrate population trends (using the Living Planet Index: Collen et al., Reference Collen, Loh, Whitmee, McRae, Amin and Baillie2009) and trends in marine species extinction risk (using the Red List Index: Butchart et al., Reference Butchart, Akçakaya, Chanson, Baillie, Collen and Quader2007, for which data were available for pelagic seabirds, whose declines in status have been largely, but not entirely, driven by fisheries-related threats). Fish sizes have been getting smaller as stocks are overexploited and future indicators could also reflect these changes (Dulvy et al., Reference Dulvy, Jennings, Rogers and Maxwell2006). We assume that reduction in levels of exploitation of wild fish populations, pollution and loss of coastal habitats would have positive effects on these state indicators. As an indicator of the extent of marine fish habitats that have been degraded by marine pollution, the increasing number of dead zones can be documented (Diaz & Rosenberg, Reference Diaz and Rosenberg2008). Additional state indicators include the extent of important habitats for fish such as mangroves and seagrass beds and the condition of coral reefs (Selig & Bruno, Reference Selig and Bruno2010).
Indicators of the benefits derived from marine fisheries include the number of people employed in fisheries and the tonnage of fish landed. As for forest products, it is not yet possible to determine the sustainable component of these indicators from published statistics. Without this refinement these benefit indicators have the same disadvantage as those for employment in forestry and forest product extraction: flows of benefits from unsustainable harvesting can temporarily be high. Additional potential indicators include measures of benefits derived from sustainable recreational fisheries and sustainable marine ecotourism (e.g. economic value and numbers of people whose livelihoods depend on these sources), both of which are likely to depend on the diversity of sea life (Wielgus et al., Reference Wielgus, Balmford, Lewis, Mora and Gerber2010). Global data are not yet available for these but some evidence suggests they are increasing: Worm et al. (Reference Worm, Hilborn, Baum, Branch, Collie and Costello2009) reported substantial increases in dive trips in 138 Caribbean marine protected areas and Hoyt & Hvenegaard (Reference Hoyt and Hvenegaard2002) reported a 12.1% per annum increase in whale watching in the last decade of the 20th century.
These marine fisheries indicators suggest that responses have increased (Fig. 3, although marine protected areas cover just 5.9% of territorial waters and 0.5% of the high seas: far below the CBD’s 2012 target of 10% of each marine ecoregion in protection; Coad et al., Reference Coad, Burgess, Bomhard and Besançon2009). The overall tonnage of certified fisheries has also increased dramatically over the past decade. However, these responses have not reduced the pressures on marine fisheries. Consequently, measures of the state of marine fisheries show continued declines. The exception shown here is the observed reduction in discard but this may reflect increased utilization of bycatch rather than decreased take (Zeller & Pauly, Reference Zeller and Pauly2005; Lobo et al., Reference Lobo, Balmford, Arthur and Manica2010). Increases in benefits probably reflect the inadequacy of the indicators available: in particular, their current failure to exclude benefits derived unsustainably.
Discussion
Butchart et al. (Reference Butchart, Walpole, Collen, van Strien, Scharlemann and Almond2010) illustrated that by combining apparently unrelated global indicators into simple pressure-state-benefit-response categories a more coherent story of global biodiversity change could be constructed. Here we have explored how this approach could be used at finer, sectoral scales to generate clearer messages about change and also to elucidate causal linkages to explain change and to evaluate the appropriateness and sufficiency of policy responses. For our illustrative examples, humid tropical forests and marine fish populations, we found that some existing indicators were available to populate the framework in linked sets but that there are important gaps both in the data and in the evidence for causal links.
The framework stresses the importance of the supposedly causal connections between the four component types of entities in the framework. If efforts to prevent or slow biodiversity loss are to be effective, then the links between responses, pressures, state of biodiversity, and benefits need to exist and be sufficiently strong that policy interventions will lead to changes in pressures, states and benefits in the desired direction. Ideally, robust evidence for the links in the framework would exist in advance but we suggest that the present lack of such evidence in some cases should not be seen as a valid argument for delaying the implementation of linked indicator sets. We argue that the very process of attempting to assemble a linked indicator set should lead to learning about the strength of causal links. Links found to be based on unsound reasoning can then be discarded and replaced. The identification of links found not to be functioning as expected because of inadequate implementation can lead to improvements in action on the ground.
Testing causality is difficult. The absence of an expected change in the indicators of the state of biodiversity or the benefits derived from it following a change in the level of a response indicator could occur for many reasons besides a lack of causality. Firstly, and most obviously, the scale of implementation of responses may be insufficient to address the pressures. Protected areas or other responses may increase but if they only cover a small proportion of the system of concern, while habitat conversion or other pressures continue unabated elsewhere, then continued decline of the state of the system as a whole would be expected. Secondly, responses may not be measured adequately. For example, the area, on paper, of no-take zones or habitat protection could increase, while the overall enforcement of regulations, unmeasured and not represented in the indicator, declines. Thirdly, there may be considerable time lags between implementation of responses and consequent improvements in state. Fourthly, other causal linkages besides those being targeted may be operating. For example, extensive, representative and effectively managed protected area networks may succeed in preventing habitat conversion or overexploitation, which should improve the state of biodiversity if these were the most significant pressures. However, they may by themselves fail to prevent biodiversity losses driven by climatic change, for example.
There are some good examples, for both humid tropical forest and marine biodiversity, that illustrate tests of links between the different elements in the RPSB framework. They show how, for example, implementing a response leads to a reduced pressure or how a reduction in state leads to declining benefits (Nelson & Chomitz, Reference Nelson and Chomitz2009; Selig & Bruno, Reference Selig and Bruno2010). As may be expected, many of these illustrations involve measuring effects at the same relatively small scales at which responses are implemented. Wider collection of linked indicator data would provide many more opportunities to test the generality of linkages outlined in these examples.
Clearly it will not always be possible to assemble robust evidence for all indicators and linkages in advance of creating a linked indicator set but the best information available should be used and provisional working hypotheses about how the system operates should be made explicit in a conceptual model of the system (Margoluis et al., Reference Margoluis, Stem, Salafsky and Brown2008). Then the indicators themselves and the principles of adaptive management should be used to test assumed causal links, improve measurements and the indicators derived from them and fill gaps in understanding (Nichols et al., Reference Nichols, Runge, Johnson and Williams2007). In this way, even apparent failures can be turned into opportunities to learn how to improve the effectiveness of policy interventions and communicate with stakeholders.
The number of indicator sets required, and the scale of the indicators needed, will be determined by the policy context. The finer the spatial and sectoral scale, the easier it may be to obtain robust data and test linkages between indicators. However, countries, regions and sectors differ in the resolution of the relevant policies tackling biodiversity loss, and hence the indicator sets needed to track progress will vary in a similar way.
Conclusions
Based on our findings we believe that an RPSB framework has many practical advantages, not least that it makes the relationships between different kinds of indicators, and the assumed processes that link one to another, explicit and testable. However, like any such framework it has limitations. One is that indicators may not always fall neatly into one or another category. For example, we consider proportion of fish stocks that are overexploited as an indicator of pressure but it could also be considered to indicate state. Great care is also needed in developing indicators of benefit: in the short-term human well-being may often increase through the destructive and unsustainable use of biodiversity. The framework deals only with the benefits derived from biodiversity conservation and sustainable use: a different approach would be needed to examine trade-offs between these and the benefits from other economic activities.
We conclude that linking biodiversity indicators into sets structured within a response-pressure-state-benefit framework allows them to be more easily understood, used and communicated at a range of spatial scales and for a diversity of sectors or systems. As the CBD process to develop indicators for the post-2010 biodiversity targets commences, with the establishment of an Ad Hoc Technical Expert Group to be convened in mid 2011, adoption of the framework presented here would help to increase the usefulness and the actual use of indicators at both global and national scales and provide opportunities for adaptive learning of how to improve them further and increase the effectiveness of responses and interventions. Recognizing the linkages between different types of indicators and connecting them into integrated sets will make a substantial contribution to providing decision-makers with the tools they need for tackling biodiversity loss effectively.
Acknowledgements
We are grateful to the Marine Stewardship Council for making available catch data for certified fisheries, and to Georgina Mace, John Croxall, Ali Stattersfield and two anonymous reviewers for advice and comments. This project was funded by the Cambridge Conservation Initiative Collaborative Fund thanks to the generosity of Arcadia, with further support from the 2010 Biodiversity Indicators Partnership Global Environment Facility project.
Biographical sketches
This article was initiated by the subset of authors who are based in Cambridge and who are active members of a collaboration between university departments and conservation bodies in the area, the Cambridge Conservation Initiative (http://www.conservation.cam.ac.uk). They and the additional authors work on a broad range of topics, including conservation science and biodiversity indicators. Several of the authors were involved with the 2010 Biodiversity Indicators Partnership, which is co-ordinated by the United Nations Environment Programme World Conservation Monitoring Centre.


