There are various ways to measure a scholar’s professional visibility: (1) asking faculty to rank the scholars in their field(s) of expertise; (2) counting a faculty member’s cumulative (or recent) publications, or perhaps only those in especially high-prestige journals, or weighting publications by the impact factor of the journal; and (3) counting cumulative (or recent) citations. We used the third approach. In this article, we duplicate the Kim–Grofman (KG) database with more recent data to replicate and extend the findings and rankings in “The Political Science 400: A 20-Year Update” by Masuoka, Grofman, and Feld (Reference Masuoka, Grofman and Feld2007a), henceforth MGF. As in MGF and previous works (Klingemann Reference Klingemann1986; Klingemann, Grofman, and Campagna Reference Klingemann, Grofman and Campagna1989), we generated cumulative citation counts of all tenure-track political science faculty at the 133 PhD-granting political science departments in the United States as of summer 2017. In the process of collecting information on currently employed faculty, we also gathered information on emeritus faculty. This resulted in a dataset of 4,089 faculty, of whom 3,412 are currently employed in tenured or tenure-track positions. For some analyses, the N is 3,769 because we are missing the PhD date for 320 scholars.
Although MGF and most other previous studies base citation counts on the Web of Science Social Science Citation Index (SSCI),Footnote 1 we opted to base ours on Google Scholar, which identifies citations to books as well as journal articles and other types of material. Our citation data from Google Scholar spans more than 50 years. In addition to Google Scholar citation count and university of present (or past) employment for each faculty member, we collected information on the PhD date, the institution from which the PhD was awarded, and the primary field of interest. We added information to the data fields collected by MGF on present rank and we also coded for gender. We provide information primarily in terms of lifetime citation counts because this best reflects overall visibility. This number obviously is biased in favor of those who have had more time to accumulate citations; therefore, similar to MGF, we also provide citation counts categorized separately by age cohort defined by PhD date, as well as by subfield and gender. However, in general, we report counts and other information separately for emeriti, focusing on those who are still professionally active, which we define as those who have published within the past five years.
Additional details about our methodology and general features of the KG dataset are in an online appendix.
THE POLITICAL SCIENCE 400
This update of The Political Science 400 again identifies the 400 most highly cited scholars in the profession who are currently teaching at PhD-granting departments in the United States, with their primary appointment in that department, by tallying the citations to lifetime bodies of work in all journals and books. It includes citation data from when scholars began receiving citations to their most recent work. The full list of The Political Science 400 is available in an online appendix, and the full dataset is available from the authors on request. Similar to MGF, for space reasons, the tables in this article limit the number of faculty displayed (e.g., table 1 lists only the 100 most-cited faculty). To further control for age effects similar to MGF, table 2 identifies the top 25 scholars from each five-year cohort. We also provide a list of the 40 most-cited women scholars with information on their PhD date, as well as the top 25 scholars in each subfield.
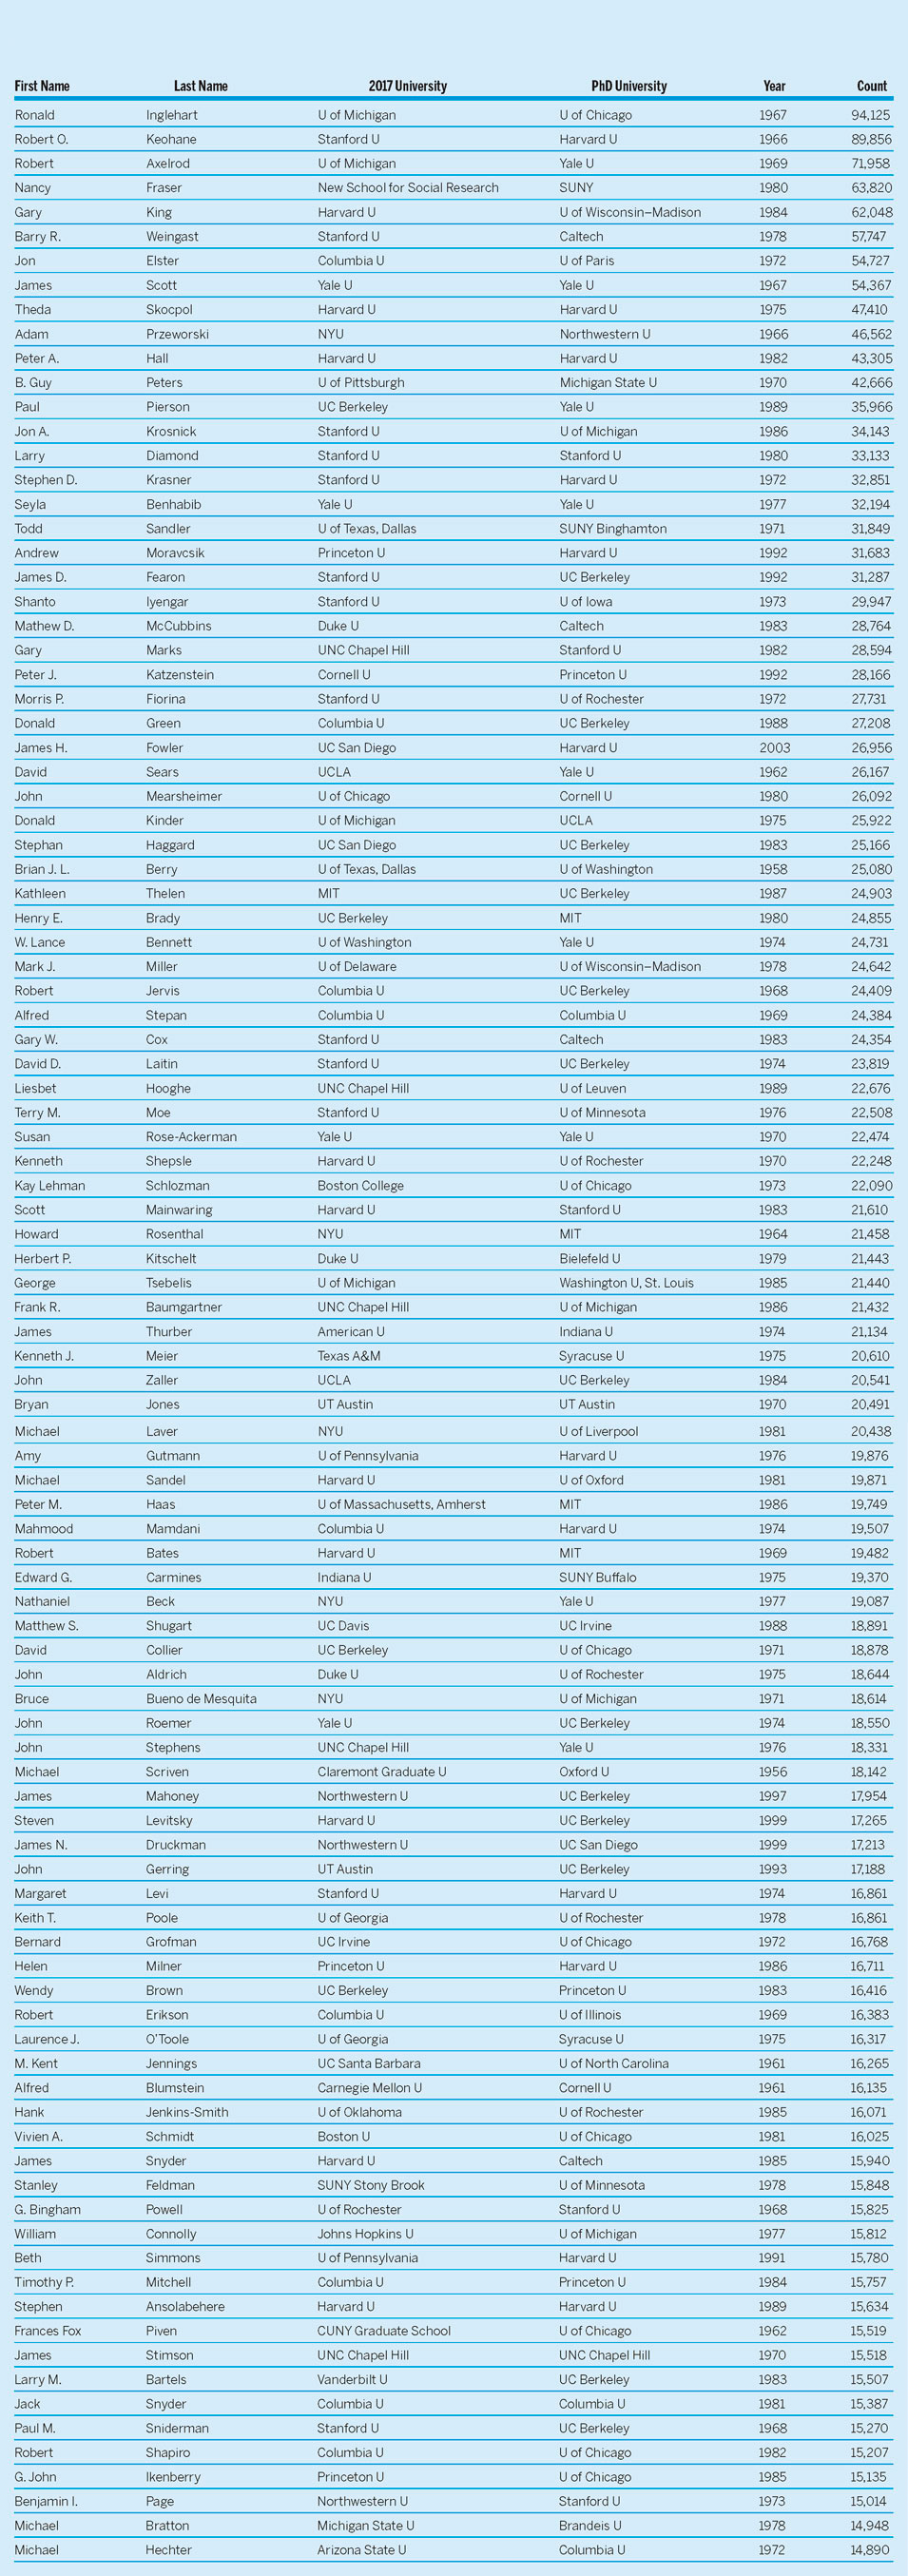
Table 1 Top 100 Most-Cited Scholars

Table 2 Most-Cited Top 25 Scholars in Each Cohort

For the 100 most-cited scholars, table 1 identifies their PhD date, present affiliation, and where they received their PhD, as well as their Google Scholar lifetime counts. We restrict table 1 to non-emeriti faculty so as to reflect the current state of the discipline. However, table 5 is a separate tabulation of the 25 most highly cited emeriti who are still professionally active.
Table 2 lists the 25 most-cited scholars from each five-year cohort. For younger cohorts, this may include some scholars who are not in the overall list of 400; for older cohorts, it may exclude some scholars who are in the overall list. As in table 1, table 2 also identifies their PhD date, present affiliation, and where they received their PhD. For the three oldest cohorts, table 2 lists only those with more than 5,000 citations. We omit the data on post-2015 PhDs because it is too soon for it to be representative.
Reviewing the full Political Science 400 dataset, we found that the plurality cohort is now 1975–1979, as compared to the plurality cohort of 1970–1974 in the MGF study. By examining the data in table 2, we also compared across cohorts the citation counts of the most-cited faculty within each cohort.
Table 3 lists the 25 most-cited scholars from each field.Footnote 2 As in table 2, table 3 also identifies their PhD date, present affiliation, and where they received their PhD.
Our main goal was to update the MGF (2007a) dataset with data from more than a decade later and to switch from SSCI data to Google Scholar data, which includes more complete information about book citations.
Table 3 Most-Cited Top 25 Scholars from Each Field

Not all subfields are represented equally in The Political Science 400. Some subfields contain more faculty than others; however, subfields also differ in their citation practices regarding the mean number of citations per publication and in the extent to which a citation from (and to) other subfields is common. Nonetheless, we can create an index of overrepresentation by dividing each subfield’s share of The Political Science 400 by its share of faculty in the full dataset. Although that table is omitted for space reasons, we note that overrepresentation is highest in methodology (i.e., a ratio value of 1.90) and underrepresentation is greatest in political theory (i.e., a ratio value of 0.54).
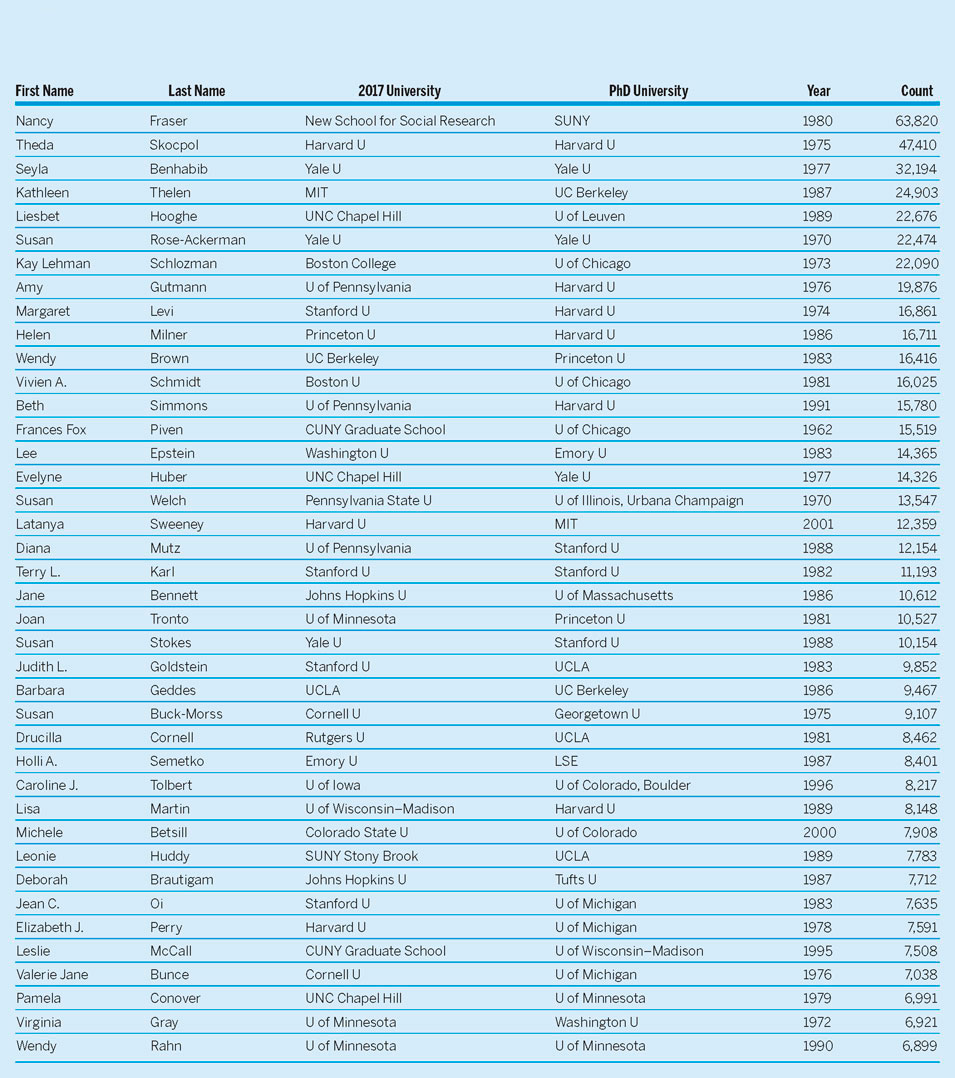
Table 4 lists the 40 most-cited women scholars. As in table 3, table 4 also identifies their PhD date, present affiliation, and where they received their PhD. All 40 women are in The Political Science 400.
Table 4 Top 40 Most-Cited Women Scholars (Excluding Emerita=1,135)

We also found that females comprise a very low proportion of older cohorts but a more substantial proportion of the youngest four cohorts among The Political Science 400. We also note that there are more women in The Political Science 400 in the subfields of comparative politics, American politics, and international relations relative to the overall proportion of women in those subfields. They are significantly underrepresented in the subfields of methodology and political theory relative to the overall proportion of women in those subfields. (These tables were omitted due to space limitations.)
EMERITI ONLY
If they were included, emeriti would comprise 17.3% of The Political Science 400, displacing some non-emeritus faculty. Therefore, we chose not to include them in table 1. However, we also thought it a mistake to disregard them because these faculty are some of the most highly visible in the discipline. Moreover, as expected, the most highly cited faculty in this group remain professionally active (i.e., publishing during the past five years, 2013–2018). All but five of the 100 most-cited emeriti are still professionally active.
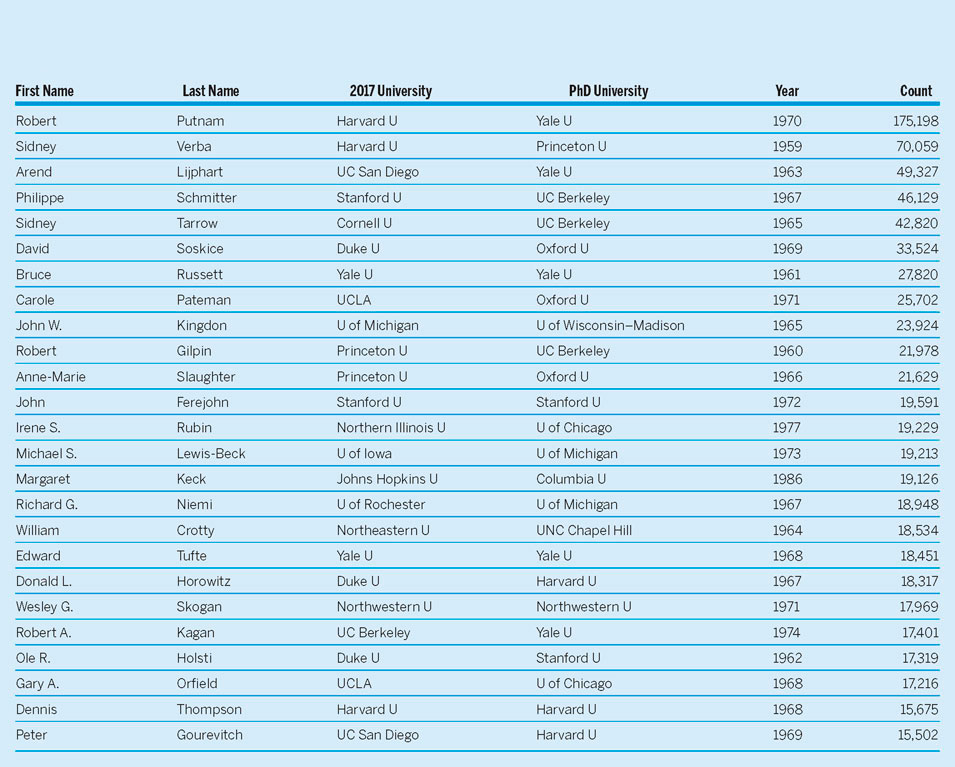
Table 5 lists the 25 most-cited professionally active emeritus scholars. If not for their emeritus status, 69 active emeriti would have been listed in The Political Science 400. A full list is available from the authors on request.
Table 5 Top 25 Most-Cited Still Active Emeritus Scholars (N=677)

DISCUSSION
Our main goal was to update the MGF (2007a) dataset with data from more than a decade later and to switch from SSCI data to Google Scholar data, which includes more complete information about book citations. Our data reflect important changes in the profession, including the retirement or death of faculty with PhDs from the 1960s and earlier. The ranks of those with PhDs from the 1970s are already greatly diminished, and further reductions are expected as most in that cohort pass age 75. Cohorts from the 1990s and later currently comprise a significant proportion of the discipline, and will become an increasing proportion of The Political Science 400 along with cohorts from the 1980s. Another important change is the growing importance of scholars who identify as methodologists. Although they are relatively few in numbers, their visibility (and influence) is greatly disproportionate to their numbers.
Finally, regarding the status of women in the profession, we observe a growing number of female faculty members in younger cohorts—although many are still in the assistant-professor stage.
Masuoka, Grofman, and colleagues used the dataset they collected to conduct additional analyses of the profession (Fowler, Grofman, and Masuoka Reference Fowler, Grofman and Masuoka2007; Masuoka, Grofman, and Feld Reference Masuoka, Grofman and Feld2007b; Reference Masuoka, Grofman and Feld2007c). Their analyses included reviewing PhD production rates; examining the ranking of departments by the citations and visibility of both their current faculty and those who received PhDs from the department; comparing those rankings to those provided by other sources (e.g., US News and World Reports); and reviewing the network structure of PhD placements. In future research, we hope to update some of this work.
SUPPLEMENTARY MATERIAL
To view supplementary material for this article, please visit https://doi.org/10.1017/S1049096518001786
ACKNOWLEDGMENT
The authors thank Russell Dalton for providing valuable feedback on previous versions of the dataset.


