In spite of the often dramatic nature of mania, the depressive phases of bipolar disorder can contribute most to poor outcome (Reference Macqueen, Young and JoffeMacQueen et al, 2001). Treatment is both understudied and clinically complicated (Reference Compton and NemeroffCompton & Nemeroff, 2000). Interest has grown in the potential role of omega-3 fatty acids such as eicosapentaenoic acid (EPA), which are found in certain plants and marine animals such as ‘oily’ fish. A possible role in the treatment of bipolar depression is suggested by studies of fish consumption (Reference HibbelnHibbeln, 1998; Reference Noaghiul and HibbelnNoaghiul & Hibbeln, 2003), blood fatty acid biochemistry (Reference Adams, Lawson and SanigorskiAdams et al, 1996) and clinical trials (Reference Horrobin and PeetHorrobin & Peet, 2001; Reference Nemets, Stahl and BelmakerNemets et al, 2002; Reference Puri, Counsell and RichardsonPuri et al, 2002). There is some evidence that they might prolong interepisode remission in people with bipolar disorder (Reference Stoll, Severus and FreemanStoll et al, 1999). Our aim therefore was to examine the efficacy and tolerability of ethyl-EPA as an adjunctive treatment for bipolar depression.
METHOD
Study design
The study was a single-centre, 12-week, double-blind randomised comparison of ethyl-EPA at 1 g or 2 g/day v. placebo (paraffin oil) as adjunctive treatment in out-patients with bipolar depression. The decision to examine the efficacy of two doses of ethyl-EPA was based on previous studies that had found 2 g/day of ethyl-EPA to be the optimal dose for schizophrenia (Reference Peet and HorrobinPeet et al, 2002) and 1 g/day for unipolar depression (Reference Horrobin and PeetHorrobin & Peet, 2001).
Because of lack of data on the efficacy of ethyl-EPA in bipolar depression at the time of initiation of the study, formal sample size calculations were not possible. This study was therefore not powered to detect changes between the three treatment groups but to allow preliminary data to be collected regarding treatment effect size (if any) for planning future studies. The study was conducted at the Institute of Psychiatry, London, according to the principles of the Declaration of Helsinki and was approved by the local ethics committee. Participants were recruited following referral from their treating physicians or through advertisements in patient groups' newsletters. After a complete description of the study, written informed consent was obtained from all participants and signed agreement was obtained from their treating physicians.
Participants were then screened to confirm their eligibility. Eligible participants were males or females between the ages 18 and 70 years who met criteria for bipolar disorder I or II as set out in the DSM-IV (American Psychiatric Association, 1994) and as determined by personal interview using the research version of the Structured Clinical Interview for DSM-IV (Reference First, Spitzer and GibbonFirst et al, 1994).
Participants were also required to score at least 10 on the 17-item Hamilton Rating Scale for Depression (HRSD-17 Reference HamiltonHamilton, 1960). Individuals were not included if: there was evidence of alcohol or illicit substance dependence, as defined by DSM-IV criteria, over the preceding 6 months; the severity of their bipolar disorder was such that participation in a clinical trial was not appropriate because of risk of imminent suicide or admission to hospital; there was a history of poor adherence to treatment and poor attendance at appointments; there was a concurrent medical condition or medication that could have accounted for the depressive episode; they had clinically significant abnormalities on routine biochemistry and haematology tests; they were on anticoagulants; they had known allergies to the ingredients of the study medication; they had taken fatty acid supplements or had been exposed to study medication in the preceding 12 weeks; or, in the case of women, they were pregnant or lactating, or of child-bearing potential and not taking adequate contraceptive precautions.
Eligible participants underwent a baseline assessment using the HRSD, the Young Mania Rating Scale (YMRS; Reference Young, Biggs and ZieglerYoung et al, 1978) and the Clinical Global Impression Scale (CGI; Reference Guy, Rush, Pincus and FirstGuy, 2000). Information about their concomitant medication was also recorded at baseline. There were no restrictions to the type and dose of psychotropic medication that they were receiving upon study entry. Participants were randomised only if existing psychotropic medication had remained unchanged (i.e. the same type and dose) for 8 weeks prior to baseline assessment. If they were medication free, then this also had to have been the case for the preceding 8 weeks.
Following baseline assessment, individuals were randomly assigned to one of the three treatment arms on a 1:1:1 basis using block-balanced randomisation codes (five patients per block). The randomisation codes were unmasked after the last patient had completed the last visit. Randomisation was implemented by giving participants numbered containers containing soft gelatin capsules. Each person was given three containers, one for each month of the study, and was asked to return them at the appropriate assessments for a capsule count to assess adherence. All participants were prescribed four identical-looking capsules daily, taken in two divided doses with food. Each capsule contained either 500 mg ethyl-EPA (purity >95%; supplied as LAX-101) or 500 mg liquid paraffin. Liquid paraffin is an inert compound commonly used as a lubricant laxative. Its usual laxative dose ranges between 15 and 30 g/day. At the doses used in this study (1-2 g/day) it would not be expected to have any laxative effect other than that of the same dose of any food oil.
Further assessments were conducted at weeks 4 and 12 using the same rating scales as at the baseline visit; changes in concomitant medication, adherence to study medication and adverse events were also recorded. Treating clinicians were allowed to change participants' medication only if there was significant deterioration in their mental state or emergent side-effects.
Outcome measures
The primary outcome measure was change in the HRSD score from baseline to the 12-week end-point. Secondary outcome measures were changes from baseline to end-point in the YMRS and CGI scores. The percentage of participants requiring adjustment of their medication and the time to change of medication was also a secondary outcome measure. Adverse events were also recorded and evaluated in terms of their onset, intensity and outcome. In order to assess whether any treatment effects could be attributed to participants guessing their treatment allocation, they were asked to state whether they thought they had received active treatment or not and to justify their choice. Adherence to study medication was monitored by pill-counting.
Statistical analysis
Pearson's χ2, two-tailed Student's t-tests and one-way analysis of variance were used to compare the distribution of categorical data and continuous data respectively between the groups. To compare the clinical outcomes of the ethyl-EPA and placebo groups we used linear regression analysis on an intent-to-treat basis. With the regression models we were able to control for baseline scores in a similar way to using analysis of variance but with the added benefit of being able to use bootstrapping techniques to generate robust confidence intervals in the presence of data that followed a non-normal distribution. Bootstrapping involves resampling from the original data a sufficient number of times (5000 in this study) in order to approximate the population from which the sample is drawn; this does not involve prior assumptions as to the form of this distribution. In the results that follow the mean difference and standard errors (s.e.) are reported along with the bootstrapped 95% confidence intervals of the difference.
The Cohen's d effect sizes were also calculated to determine the magnitude of the differences between the treatment and placebo groups in depression and mania ratings (Reference CohenCohen, 1988).
The study was funded by Laxdale Ltd, who collaborated with the authors on study design but were not involved in data collection, analysis or interpretation, writing the report or in the decision to submit for publication. Study materials were packaged and masked by the Clinical Trial Supplies Company and adverse events were monitored by Clintrials Research Ltd; neither was involved in any other aspect of the study.
RESULTS
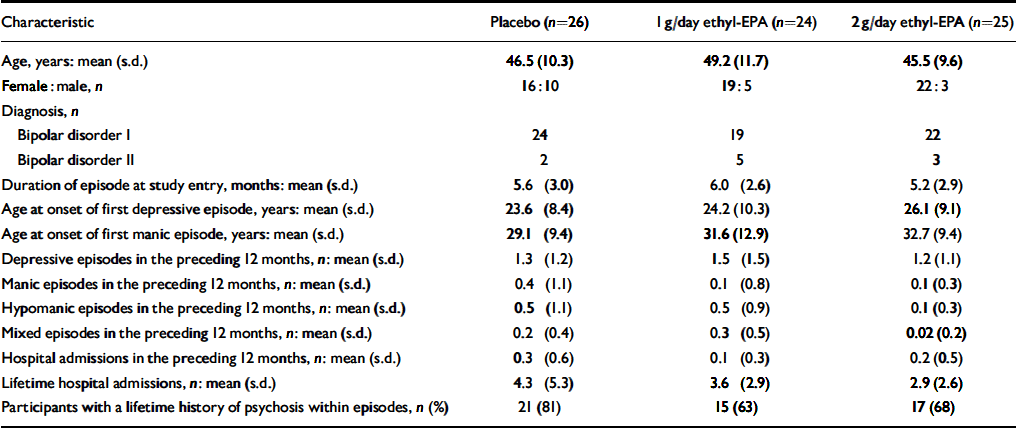
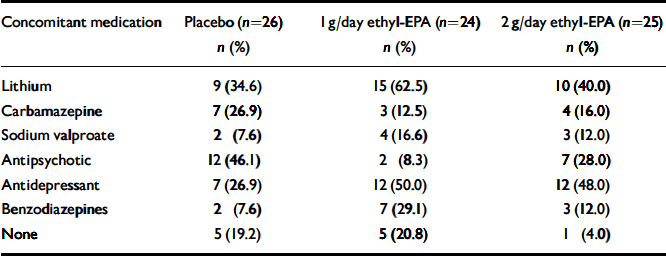
A total of 93 people were screened for eligibility. The flow of potential participants is shown in Fig. 1. Of these, 18 were ineligible because of an incorrect diagnosis (n=3), an HRSD score below 10 (n=4), concurrent substance misuse (n=1), medical conditions (n=2), frequent medication changes (n=5) and withdrawal of consent prior to randomisation (n=3). The remaining 75 people were enrolled in the study between January and December 2001 and follow-up was completed at the end of March 2002. The clinical and demographic characteristics of the study participants are shown in Table 1. Participants were well matched in terms of their clinical and demographic characteristics. Table 2 summarises participants' medication at study entry.

Fig. 1 CONSORT diagram showing the flow of participants through each stage of the trial.
Table 1 Demographic and clinical characteristics of the 75 study participants

| Characteristic | Placebo (n=26) | 1 g/day ethyl-EPA (n=24) | 2 g/day ethyl-EPA (n=25) |
|---|---|---|---|
| Age, years: mean (s.d.) | 46.5 (10.3) | 49.2 (11.7) | 45.5 (9.6) |
| Female:male, n | 16:10 | 19:5 | 22:3 |
| Diagnosis, n | |||
| Bipolar disorder I | 24 | 19 | 22 |
| Bipolar disorder II | 2 | 5 | 3 |
| Duration of episode at study entry, months: mean (s.d.) | 5.6 (3.0) | 6.0 (2.6) | 5.2 (2.9) |
| Age at onset of first depressive episode, years: mean (s.d.) | 23.6 (8.4) | 24.2 (10.3) | 26.1 (9.1) |
| Age at onset of first manic episode, years: mean (s.d.) | 29.1 (9.4) | 31.6 (12.9) | 32.7 (9.4) |
| Depressive episodes in the preceding 12 months, n: mean (s.d.) | 1.3 (1.2) | 1.5 (1.5) | 1.2 (1.1) |
| Manic episodes in the preceding 12 months, n: mean (s.d.) | 0.4 (1.1) | 0.1 (0.8) | 0.1 (0.3) |
| Hypomanic episodes in the preceding 12 months, n: mean (s.d.) | 0.5 (1.1) | 0.5 (0.9) | 0.1 (0.3) |
| Mixed episodes in the preceding 12 months, n: mean (s.d.) | 0.2 (0.4) | 0.3 (0.5) | 0.02 (0.2) |
| Hospital admissions in the preceding 12 months, n: mean (s.d.) | 0.3 (0.6) | 0.1 (0.3) | 0.2 (0.5) |
| Lifetime hospital admissions, n: mean (s.d.) | 4.3 (5.3) | 3.6 (2.9) | 2.9 (2.6) |
| Participants with a lifetime history of psychosis within episodes, n (%) | 21 (81) | 15 (63) | 17 (68) |
EPA, eicosapentaenoic acid.
Table 2 Participants' concomitant medication at the time of study entry

| Concomitant medication | Placebo (n=26) | 1 g/day ethyl-EPA (n=24) | 2 g/day ethyl-EPA (n=25) |
|---|---|---|---|
| n (%) | n (%) | n (%) | |
| Lithium | 9 (34.6) | 15 (62.5) | 10 (40.0) |
| Carbamazepine | 7 (26.9) | 3 (12.5) | 4 (16.0) |
| Sodium valproate | 2 (7.6) | 4 (16.6) | 3 (12.0) |
| Antipsychotic | 12 (46.1) | 2 (8.3) | 7 (28.0) |
| Antidepressant | 7 (26.9) | 12 (50.0) | 12 (48.0) |
| Benzodiazepines | 2 (7.6) | 7 (29.1) | 3 (12.0) |
| None | 5 (19.2) | 5 (20.8) | 1 (4.0) |
EPA, eicosapentaenoic acid.
In total, nine individuals stopped taking the study medication, six from the placebo group and three of those randomised to receive 2 g/day ethyl-EPA. For all but two of these lack of efficacy was the reason for discontinuing study medication. Of the other two, one misunderstood the study protocol and stopped study medication when their concomitant medication was changed and the other did not like the appearance of the study medication. However, only four individuals (two in the placebo and two in the 2 g/day ethyl-EPA groups) failed to complete their assessments at study end-point; for these four the HRSD, YMRS and CGI scores were extrapolated using the last-observation-carried-forward method. Results were analysed on an intent-to-treat basis, including participants who stopped the study medication.
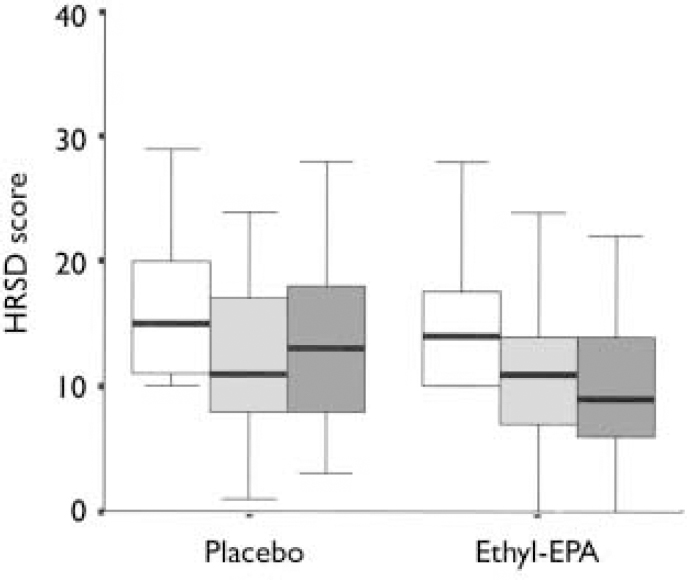
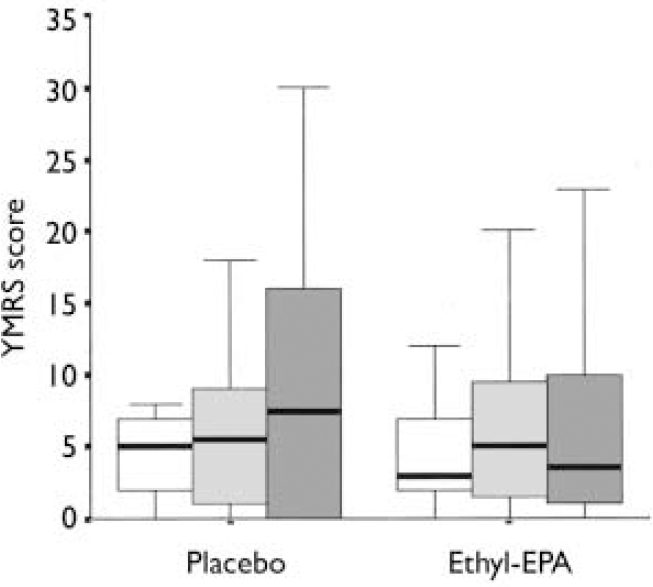
Table 3 summarises the mean and standard deviations of the participants' scores at study entry and end-point. Figures 2 and 3 show the changes in HRSD and YMRS scores across groups between baseline and study end-point. There were no group differences in episode duration at the time of study entry (F=3.9. d.f.=2, P=0.6) or in the baseline scores on the HRSD (F=0.8, d.f.=2, P=0.4), YMRS (F=0.6, d.f.=2, P=0.5) or CGI (F=0.5, d.f.=2, P=0.5).

Fig. 2 Hamilton Rating Scale for Depression (HRSD) scores in the placebo (n=26) and combined ethyl-eicosapentaenoic acid (EPA) groups (n=49) at baseline (□), week 4 (░) and week 12 (▪). The thick black line represents the mean, the whiskers are the standard deviations and the box is the range.

Fig. 3 Young Mania Rating Scale (YMRS) scores in the placebo (n=26) and combined ethyl-eicosapentaenoic acid (EPA) groups (n=49) at baseline (□), week 4 (░) and week 12 (▪). The thick black line represents the mean, the whiskers are the standard deviations and the box is the range.
Table 3 Scores on the HRSD, YMRS and CGI at study entry and at end-point

| Scale | Placebo (n=26) | 1 g/day ethyl-EPA (n=24) | 2 g/day ethyl-EPA (n=25) | ||||||
|---|---|---|---|---|---|---|---|---|---|
| Entry | End-point | Entry | End-point | Entry | End-point | ||||
| HRSD score: mean (s.d.) | 15.4 (5.0) | 13.5 (6.7) | 14.7 (4.3) | 9.2 (5.4) | 14.8 (5.6) | 9.9 (6.6) | |||
| YMRS score: mean (s.d.) | 6.3 (6.7) | 9.8 (11.1) | 6.7 (7.6) | 6.6 (6.7) | 4.7 (4.8) | 7.2 (8.9) | |||
| CGI score: mean (s.d.) | 3.0 (0.9) | 3.1 (1.3) | 3.0 (1.1) | 2.4 (1.0) | 2.9 (1.1) | 2.3 (1.1) | |||
EPA, eicosapentaenoic acid; HRSD, Hamilton Rating Scale for Depression; YMRS, Young Mania Rating Scale; CGI, Clinical Global Impression Scale.
Exploration of initial data revealed no difference between the two ethyl-EPA groups in terms of end-point HRSD, YMRS and CGI scores. Data analysis was performed with the two active treatment groups combined.
(a) In terms of the main outcome measure, the mean HRSD score at the week 12 visit was 3.3 (s.e.=1.40) points lower for the ethyl-EPA groups (bootstrapped 95% CI -6.1 to -0.2, P=0.03). The overall HRSD effect size calculated from the difference between baseline and end-point measurements was 0.34 by Cohen's d.
(b) The mean YMRS score at the week 12 visit was 3.3 (s.e.=2.2) points lower for the ethyl-EPA group compared with the placebo group (bootstrapped 95% CI -8.6 to 1.6, P=0.17). The overall YMRS effect size calculated from the difference between baseline and end-point measurements was 0.41 by Cohen's d.
(c) The mean CGI score at the week 12 visit was 0.79 (s.e.=0.26) points lower for the ethyl-EPA groups compared with the placebo group (bootstrapped 95% CI -1.27 to -0.25, P=0.04).
(d) During the trial, 26 of the 75 randomised participants had their medication changed or adjusted: 12 in the placebo group (9 were prescribed new medication or had the dose of their ongoing medication adjusted because of worsening of symptoms and 3 because of weight gain, oversedation, or high lithium serum levels), 7 in the group receiving 1 g/day of ethyl-EPA (2 changed lithium dose because of high serum levels and 5 had started new medication or increased the dose of their existing drugs because of worsening of symptoms) and 7 in the group receiving 2 g/day of ethyl-EPA (6 started new medication or had their dose adjusted because of worsening depression, 1 stopped medication because of oversedation).
Of the 75 individuals randomised, 23 reported emerging side-effects during the clinical trial (7 in the placebo arm, 9 in the 1 g/day ethyl-EPA and 7 in the 2 g/day ethyl-EPA groups). The most frequently reported side-effect was loose stools (reported by three people in the placebo group, three in the 1 g/day ethyl-EPA group and six in the 2 g/day ethyl-EPA group), followed by gastrointestinal discomfort (reported by three people in the placebo group, one in the 1 g/day ethyl-EPA group and two in the 2 g/day ethyl-EPA group). There was no difference between the groups in these two types of side-effects (χ2=1.0, d.f.=2, P=0.59). There were also reports of isolated side-effects: two people in the placebo group reported constipation, there was one report of nausea and one of flatulence in the 1 g/day ethyl-EPA group and one report of an unpleasant taste in the 2 g/day ethyl-EPA group.
At study end-point the 71 participants (95% of the randomised sample) who completed their assessments were asked whether they thought they had received active treatment or not. There were no group differences regarding participants' ability to guess their group allocation (χ2=1.2, d.f.=2, P=0.5); only 23% of the placebo group, 21% of the 1 g/day ethyl-EPA and 24% of the 2 g/day ethyl-EPA groups guessed their allocation correctly.
DISCUSSION
Efficacy of ethyl-EPA in bipolar depression
Treatment of bipolar depression with adjunctive ethyl-EPA resulted in improved clinical outcomes compared with placebo in terms of reduction in HRSD and CGI scores. Improvement was not significantly different in participants treated with 2 g/day as opposed to 1 g/day of ethyl-EPA.
Baseline and end-point ratings on the YMRS were not significantly different among the three groups. Although there have been reports of hypomania during treatment with a different preparation of omega-3 fatty acids (Reference KinrysKinrys, 2000), we found no evidence that treatment with ethyl-EPA precipitates polarity changes in people with bipolar disorder.
Methodological considerations
There are several methodological issues that are worth considering. The placebo response rate in clinical trials of bipolar depression is high, with a pooled average of 29% (Reference Keck, Welge and McElroyKeck et al, 2000). To control for the influence of psychosocial factors, we kept the number of assessments and contacts with the research team at a minimum to minimise the possibility that benefits from treatment could result from increased contact with health professionals. We also asked participants whether they thought they had received active treatment to examine whether the significant benefits seen with ethyl-EPA could be attributed to their guessing correctly their group allocation. We tried to approximate ordinary clinical practice by allowing treating physicians to make changes to participants' medication when clinically required. Finally, we analysed the data on an intent-to-treat basis and showed a superior response to ethyl-EPA compared with placebo in spite of the difficulties in finding clear drug-placebo separation in add-on trials (Reference Keck, Welge and McElroyKeck et al, 2000). This is particularly relevant here since about half of those randomised to the placebo group had their medication adjusted when their symptoms persisted or worsened.
Possible mechanism of action of ethyl-EPA
The precise mechanism of action of ethyl-EPA in improving bipolar depression is not clear. Antidepressants exert their action at the level of neurotransmitters (catecholamines and serotonin) and neurotransmitter receptors. Binding of neurotransmitters to receptors leads to the release of second messenger molecules that initiate a whole cascade of biochemical changes, which ultimately lead to an altered state of the neuron. Mood stabilising drugs (lithium, sodium valproate, carbamazepine) appear primarily to affect second messenger systems (Reference Stoll and SeverusStoll & Severus, 1996). Omega-3 fatty acids such as ethyl-EPA may be similar to mood stabilisers in this respect. It is possible that the incorporation of EPA into cell membranes inhibits the action of phospholipase A2, an enzyme that is important for the production of second messenger molecules such as arachidonic acid (Reference Finnen and LovellFinnen & Lovell, 1991; Reference Chang and JonesChang & Jones, 1998), or it may directly inhibit ‘downstream’ signalling molecules such as protein kinase C (Reference Seung Kim, Weeber and SweattSeung Kim et al, 2001).
The role of ethyl-EPA in bipolar disorder
This is the first randomised double-blind placebo-controlled clinical trial of ethyl-EPA in depression in people with bipolar disorder. Our results confirm initial observations (Reference Horrobin and PeetHorrobin & Peet, 2001; Reference Nemets, Stahl and BelmakerNemets et al, 2002) of the antidepressant effect of omega-3 fatty acids, particularly of ethyl-EPA. They also strongly suggest that treatment with ethyl-EPA is not associated with increased risk of inducing manic symptoms. At the doses prescribed here the side-effects were minimal and indistinguishable from those in the placebo group. Although the role of ethyl-EPA in the treatment of bipolar disorder requires further evaluation, our results offer optimism that ethyl-EPA represents a new generation of naturally occurring and safe psychotropic compounds.
Clinical Implications and Limitations
CLINICAL IMPLICATIONS
-
▪ Adjunctive ethyl-eicosapentaenoic acid (EPA) treatment of bipolar depression is safe and well tolerated.
-
▪ Adjunctive ethyl-EPA treatment appears to have antidepressant effects and minimal propensity to induce mania.
-
▪ As ethyl-EPA is a naturally occurring compound it may prove more acceptable to patients than other pharmacological interventions.
LIMITATIONS
-
▪ This small study only assessed short-term efficacy and tolerability of ethyl-EPA treatment in bipolar disorders; its value in long-term treatment is unknown.
-
▪ This study only assessed the efficacy and tolerability of ethyl-EPA as adjunctive treatment in bipolar disorder; its value as monotherapy is unknown.
-
▪ This study did not assess the efficacy of ethyl-EPA in severe bipolar depression.


eLetters
No eLetters have been published for this article.