Premature mortality is a well-established adverse outcome of severe mental illness (SMI), most notably for schizophrenia, bipolar disorder and depressive disorder. Reference Saha, Chant and McGrath1 Nonetheless, investigating mortality patterns remains important for: (a) for monitoring the profile of changing risk factors over time; Reference Tsuang and Simpson2 (b) for evaluating the impact of sociocultural and geographic settings on mortality; (c) for reviewing the contribution of SMI to the global burden of disease; (d) for advocating for the inclusion of SMI in the global health agenda; and (e) to establish the mortality profile in population samples, which has not been demonstrated adequately to date. Moreover, the contribution of SMI to the global burden of disease has increased in the most recent analyses Reference Murray and Lopez3,Reference Murray, Vos, Lozano, Naghavi, Flaxman and Michaud4 but is still likely to be underestimated substantially. For example, although mental disorders, particularly SMI, are the strongest predictors of mortality from self-harm, Reference Cavanagha, Carsib, Sharpe and Lawrie5 self-harm is calculated separately in the global burden of disease estimations. Reference Prince, Patel, Saxena, Maj, Maselko and Phillips6 In addition, the indirect yet substantial contributions of mental disorders to mortality related to physical conditions are underrecognised in calculations of the global burden of disease. Reference Prince, Patel, Saxena, Maj, Maselko and Phillips6,Reference Blazer, Hybels and Pieper7 This underestimation has the potential to perpetuate the low prioritisation of mental disorders and the underinvestment in research and services related to SMI, particularly in low-income country settings, where policy-makers have to prioritise disorders with the highest burden and best outcome returns for their investment. Furthermore, our knowledge about mortality associated with SMI derives from clinical samples recruited in the context of service receipt or hospital admission, mostly from high-income countries, although over 80% of the world’s population lives in low- and middle-income countries with limited access to treatment. The little knowledge we have about the mortality of people with SMI from low- and middle-income countries comes from anecdotal accounts Reference Thornicroft8 and the pioneering studies of the World Health Organization, which are now over three decades old. Reference Jablensky, Sartorius, Ernberg, Anker, Korten and Cooper9–Reference Sartorius, Shapiro and Jablensky11 For example the International Pilot Study of Schizophrenia was initiated over 45 years ago, in 1966. Reference Sartorius, Shapiro and Jablensky11 Many changes have occurred in our understanding of mental disorders since: more refined methods of illness classification, case identification and monitoring have evolved; new methods for ascertainment of causes of mortality applicable in low-income settings have enabled researchers to define causes of death in more precise ways. Additionally, virtually no data exist on the mortality outcomes in bipolar disorder and severe depressive disorders in low-income country settings, which are also important contributors to premature mortality alongside schizophrenia. There is, therefore, a pressing need for up-to-date, methodologically rigorous, population-based studies from low-income countries. The aim of this report is to present the mortality outcomes of people with SMI from the Butajira-Ethiopia study on SMI, a recently completed large-scale, population-based cohort study.
Method
The cohort
The study cohort and the methods for follow-up have been described in detail previously. Reference Alem, Kebede, Fekadu, Shibre, Fekadu and Beyero12–Reference Kebede, Alem, Shibre, Negash, Fekadu and Fekadu14 A summary description of the cohort is presented below with the focus on the conduct of the mortality assessment. The Butajira cohort on SMI was established between March 1998 and May 2001 in the Butajira district, located 132 km from Addis Ababa, the capital of Ethiopia. At the start of the study, the area was administratively divided into 46 subdistricts and all except one inaccessible subdistrict were included in the study. Demographically, the district contained predominantly rural sites with only four of the subdistricts, representing 10.9% of the population, being urban. This is similar to the urban–rural balance seen in the southern region of Ethiopia. 15
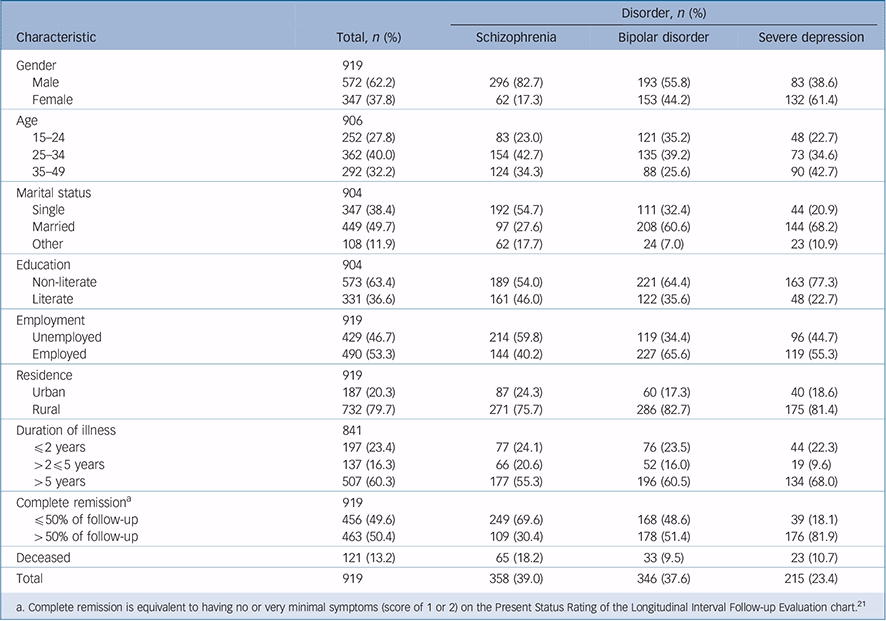
The cohort was identified through a two-stage sampling design. In the first stage, potential participants with SMI (schizophrenia, bipolar disorder and severe depression) were identified through a supervised door-to-door survey and the key informant method. Reference Shibre, Kebede, Alem, Negash, Kibreab and Fekadu16 The door-to-door survey consisted of lay interview with the Composite International Diagnostic Interview (CIDI), version 2.1 17 targeting adults aged 15–49 years, estimated at the beginning of the study to be 83 282. 18 The CIDI was administered to 68 378 individuals (82.1% of the target population) and the CIDI case identification was augmented by trained key informants, community leaders and elders selected from each village. Reference Shibre, Kebede, Alem, Negash, Kibreab and Fekadu16 In the second stage, people with potential disorder were assessed using the Schedules for Clinical Assessment in Neuropsychiatry (SCAN), 19 a structured instrument to confirm diagnosis. The SCAN was administered by trained clinicians and the ratings were validated against clinical diagnosis by psychiatrists, Reference Alem, Kebede, Shibre and Negash20 with excellent agreement between the SCAN diagnosis and clinical diagnosis. The first cohort identification lasted 3 years (1998–2001) and 844 participants were recruited. Using similar methodology, a leakage study identified 75 additional participants in the next 3 years from the same catchment area (Fig. 1). Thus, the total cohort consisted of 919 participants with SMI, composed mostly of men (n = 572, 62.2%). This gender difference was primarily because the majority of individuals identified with schizophrenia were men (n = 296, 82.7%). There was no gender difference in bipolar disorder and the difference in severe depression was in the expected direction; women were overrepresented (n = 132; 61.4%). Details of the baseline demographic characteristics are presented in Table 1.
Monitoring of cohort and confirmation of survival status
The cohort was monitored serially over a median of 11.3 years (interquartile range 10.7–11.9), ending in February 2012. Three
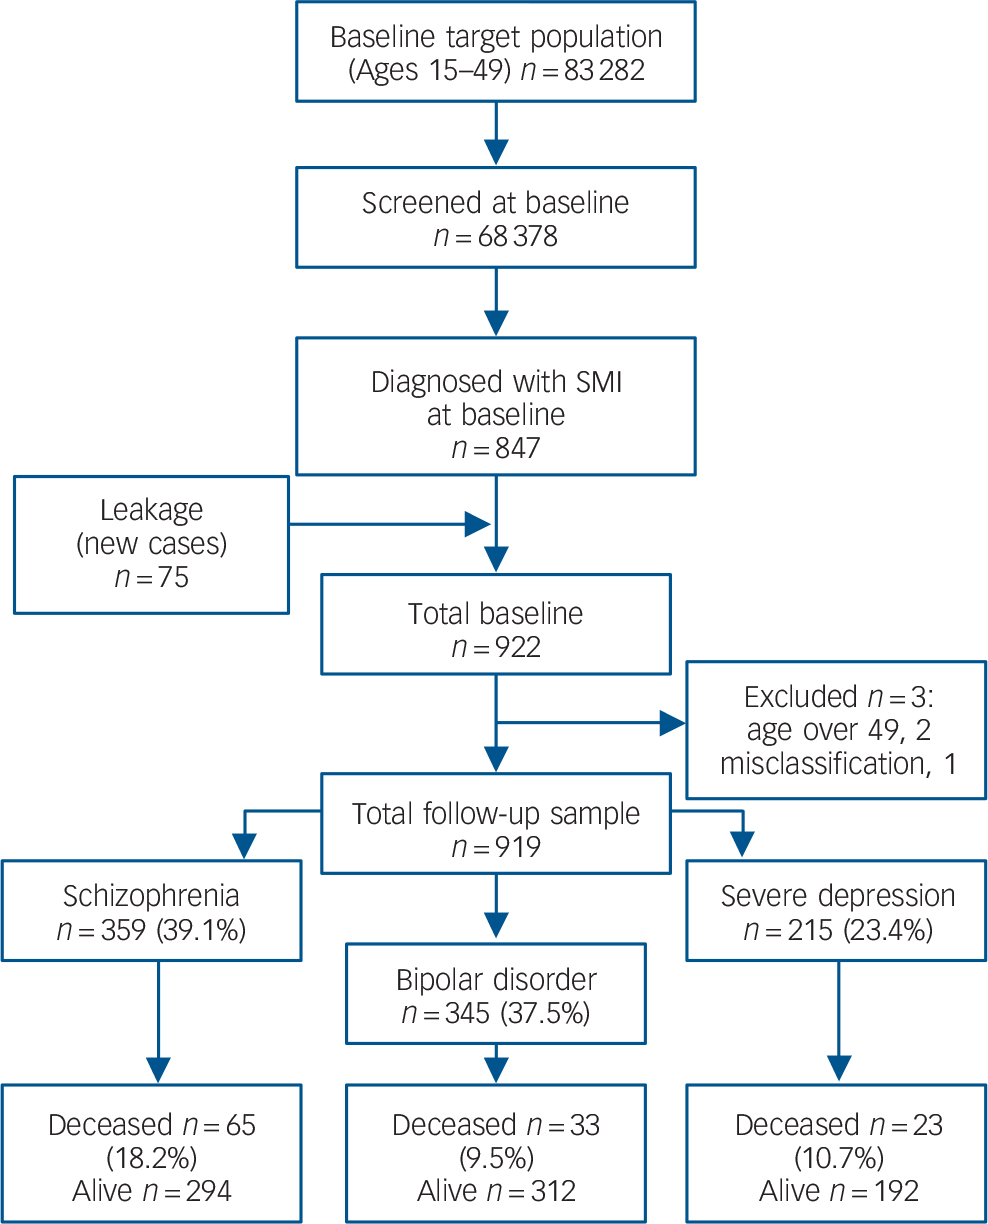
Fig. 1 Flow diagram of follow-up status and mortality over 10 years in the Butajira study, Ethiopia.
Table 1 Sociodemographic and clinical characteristics of study participants at baseline and selected clinical outcomes
| Disorder, n (%) | ||||
|---|---|---|---|---|
| Characteristic | Total, n (%) | Schizophrenia | Bipolar disorder | Severe depression |
| Gender | 919 | |||
| Male | 572 (62.2) | 296 (82.7) | 193 (55.8) | 83 (38.6) |
| Female | 347 (37.8) | 62 (17.3) | 153 (44.2) | 132 (61.4) |
| Age | 906 | |||
| 15–24 | 252 (27.8) | 83 (23.0) | 121 (35.2) | 48 (22.7) |
| 25–34 | 362 (40.0) | 154 (42.7) | 135 (39.2) | 73 (34.6) |
| 35–49 | 292 (32.2) | 124 (34.3) | 88 (25.6) | 90 (42.7) |
| Marital status | 904 | |||
| Single | 347 (38.4) | 192 (54.7) | 111 (32.4) | 44 (20.9) |
| Married | 449 (49.7) | 97 (27.6) | 208 (60.6) | 144 (68.2) |
| Other | 108 (11.9) | 62 (17.7) | 24 (7.0) | 23 (10.9) |
| Education | 904 | |||
| Non-literate | 573 (63.4) | 189 (54.0) | 221 (64.4) | 163 (77.3) |
| Literate | 331 (36.6) | 161 (46.0) | 122 (35.6) | 48 (22.7) |
| Employment | 919 | |||
| Unemployed | 429 (46.7) | 214 (59.8) | 119 (34.4) | 96 (44.7) |
| Employed | 490 (53.3) | 144 (40.2) | 227 (65.6) | 119 (55.3) |
| Residence | 919 | |||
| Urban | 187 (20.3) | 87 (24.3) | 60 (17.3) | 40 (18.6) |
| Rural | 732 (79.7) | 271 (75.7) | 286 (82.7) | 175 (81.4) |
| Duration of illness | 841 | |||
| ≤2 years | 197 (23.4) | 77 (24.1) | 76 (23.5) | 44 (22.3) |
| >2≤5 years | 137 (16.3) | 66 (20.6) | 52 (16.0) | 19 (9.6) |
| >5 years | 507 (60.3) | 177 (55.3) | 196 (60.5) | 134 (68.0) |
| Complete remissionFootnote a | 919 | |||
| ≤50% of follow-up | 456 (49.6) | 249 (69.6) | 168 (48.6) | 39 (18.1) |
| >50% of follow-up | 463 (50.4) | 109 (30.4) | 178 (51.4) | 176 (81.9) |
| Deceased | 121 (13.2) | 65 (18.2) | 33 (9.5) | 23 (10.7) |
| Total | 919 | 358 (39.0) | 346 (37.6) | 215 (23.4) |
a. Complete remission is equivalent to having no or very minimal symptoms (score of 1 or 2) on the Present Status Rating of the Longitudinal Interval Follow-up Evaluation chart. Reference Keller, Lavori, Friedman, Nielsen and Endicott21
monitoring mechanisms were established. First, each subdistrict was allocated to trained field workers who were involved in the initial data collection. These field workers developed intimate knowledge of the patients and the family and provided a report on the status of patients about once per month. Second, patients had a monthly clinical follow-up at which time their clinical status, medication changes and any other relevant indicators were recorded. Third, all participants were assessed annually for diagnostic stability and symptom and functional status. Through this continuous monitoring the survival status of participants was ascertained prospectively for all entrants into the cohort.
Death was confirmed within 1 month of death by field workers who completed the verbal autopsy using the WHO verbal autopsy questionnaire that was previously adapted for use in the Butajira area. Reference Fantahun, Berhane, Hogberg and Wall22,Reference Lulu and Berhane23 Verbal autopsy is described as the ‘most promising’ method of ascertaining causes of death in settings where most deaths occur at home and are not attended by a doctor as is the case in our study setting. Reference Anker24 The verbal autopsy method has also informed the latest global burden of disease data on causes of death from low-income settings. Reference Murray, Vos, Lozano, Naghavi, Flaxman and Michaud4,Reference Wang, Dwyer-Lindgren, Lofgren, Rajaratnam, Marcus and Levin-Rector25 The verbal autopsy questionnaire is prepared for completion by lay interviewers based on information from close family members who have knowledge of the terminal illness. Reference Reeves and Quigley26–Reference Quigley, Chandramohan, Setel, Binka and Rodrigues29 The verbal autopsy questionnaire starts by asking about basic socio-demographic and personal habits (smoking and alcohol use). This is followed by details about the circumstances leading to death (signs and symptoms of illness, duration of the identified signs and symptoms, and explores potential external causes).
The lay field workers of the Butajira study on SMI who administered the verbal autopsy questionnaire to close relatives of the deceased were trained in the administration of the questionnaire. Once the questionnaire was completed, decision on diagnosis of the cause of death was made by consensus of two physicians. The verbal autopsy data were supplemented by the Broad Rating Schedule (BRS). 30 The BRS was originally developed to summarise the findings during follow-up of patients with a diagnosis of schizophrenia but the principles of the BRS are applicable to all disabling disorders. The symptomatic and functional status of the participants is rated for the last month. The rating is made based on all available information, including information from the participant, other informants and records. The BRS also assesses symptoms and disabilities using a modified version of the Global Assessment of Functioning scale (GAF). 31 The score ranged from 1 (persistent inability to function in almost all areas) to 90 (good function in all areas). Generally a score of 60 and above is considered a reasonable level of functioning. The BRS contains sections on participants lost to follow-up and deceased. The causes of death were then grouped into broad ICD-10 disease classes 32 as presented in Table 3.
Analytic methods
Data analysis was conducted with SPSS version 21 and Stata version 11 for Windows. Mortality was standardised using the latest (2007) census of the Southern Nations Nationalities Peoples Region of Ethiopia, 15 which includes Butajira. In the absence of appropriate dates of birth, we followed the method proposed by Breslow & Day Reference Breslow and Day33 to calculate person-years of follow-up, and relied on age at entry, date of entry and date of exit. We estimated the amount of time contributed by each individual to each 5-year age category and summed up all those contributions for all cohort members and obtained the total number of person-years of observation in that category. Each participant was assumed to contribute 0.5 years to the age category of the participant at commencement in the study, but the precise follow-up duration was calculated for the exit year. A full 1 year was given to each intervening year. For participants exiting the study within a year of entry into the cohort the exact length of contributed time was calculated. We estimated the potential years of life lost (YLL) using the 2009 national data on life expectancy. 34 As was the case in the global burden of disease estimation, Reference Murray, Vos, Lozano, Naghavi, Flaxman and Michaud4,Reference Lozano, Naghavi, Foreman, Lim, Shibuya and Aboyans35 YLL were computed by multiplying the number of deaths at each age (x years) by the standard life expectancy of the reference population (the Ethiopia population) at age x. Put slightly differently, YLL was computed by estimating the difference between the actual age at death of an individual in the cohort who died from any cause, and the expected age at death. This may be represented with the following formula: Reference Pham, Fujino, Ide, Tokui, Kubo and Mizoue36 YLL = Σdi(E – i), where i = actual age at death; d = number of deaths at age i; and E = Expected age at death estimated according to the 2009 life tables for Ethiopia, based on age and gender. The sum of the YLL was then divided by the number of deceased individuals to derive the mean YLL. Standardised mortality ratios were calculated as the ratio of the number of observed deaths in the sample with SMI to the number expected if the sample with SMI had the same mortality rate as the population within Southern region. Factors associated with premature mortality were computed using the Cox proportional hazards model. We also estimated the life expectancy at birth of the cohort based on the life expectancy of the population of the Southern region using Chiang’s method of abridged life tables in 5-year groups. Reference Chang, Hayes, Broadbent, Fernandes, Lee and Hotopf37–Reference Lawrence, Hancock and Kiseley39 This method has been recommended for its application to relatively small populations. Reference Chiang and Robert38 Since those under 15 years of age would be unlikely to receive a diagnosis of SMI, the mortality rates of the Southern Region for the under-15-years age groups was applied in substitution. 40 Additionally, we substituted the mortality rates of the Southern region for mortality above 60 because only a small number of participants had been above 60 (n = 6) and using the SMI cohort would lead to unstable estimation. Life expectancy was estimated for the whole cohort and by gender as well as by the three disorders. The differences in life expectancy at birth between those with SMI and that of the Southern region were calculated.
Ethical considerations
The study was initially approved by the ethics committee of the Department of Community Health and then by the Institutional Review Board of the Faculty of Medicine and the College of Health Sciences of Addis Ababa University. Treatment was made available free of charge for all patients needing treatment.
Results
In total 121 participants (13.2% of the initial cohort) died during the follow-up period. Details of the demographic characteristics are presented in Table 1. Nearly twice as many patients with schizophrenia died (n = 65, 18.2%) compared with those with bipolar disorder (n = 33, 9.5%, χ2(1) = 10.9, P = 0.001) or severe depression (n = 23, 10.7%; χ2(1) = 5.7, P = 0.016). When all diagnostic categories were considered together, more deaths occurred among men (n = 88, 15.4%) than women (n = 33, 9.5%, χ2(1) = 6.5, P = 0.011). However, the difference was not statistically significant when comparison was stratified by diagnostic groups even though comparatively more men died in all categories: 19.3% v. 12.9% for schizophrenia, 10.9% v. 7.8% for bipolar disorder and 12.0% v. 9.8% for severe depression.
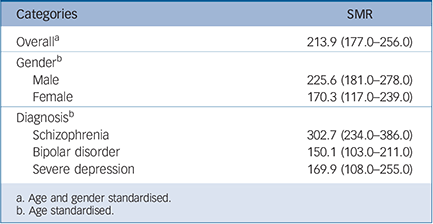
Overall, mortality was twice that of the standard population (SMR = 213.9, 95% CI 177–256) (Table 2). The SMR was highest for schizophrenia (302.7, 95% CI 234–386), which was significantly higher than that of bipolar disorder (SMR = 150.1,
Table 2 Standardised mortality ratio (SMR) for severe mental illness computed using the population of the Southern region as the reference
| Categories | SMR |
|---|---|
| OverallFootnote a | 213.9 (177.0–256.0) |
| GenderFootnote b | |
| Male | 225.6 (181.0–278.0) |
| Female | 170.3 (117.0–239.0) |
| DiagnosisFootnote b | |
| Schizophrenia | 302.7 (234.0–386.0) |
| Bipolar disorder | 150.1 (103.0–211.0) |
| Severe depression | 169.9 (108.0–255.0) |
a. Age and gender standardised.
b. Age standardised.
95% CI 103– 211) although not that of severe depression (SMR = 169.9, 95% CI 108– 255).
The commonest cause of death, based on categories of the ICD-10, 32 was related to infectious conditions (49.6%, n = 60) prevalent in the study area (Table 3). Unnatural causes accounted for a quarter of all causes of death (24.8%, n = 30), most arising from suicide (n = 19, 15.7%); the rest from other unnatural causes such as road traffic accidents and homicide (n = 11). Proportionately, those with bipolar disorder had the highest mortality from suicide (24.2%, n = 8/33) although the difference
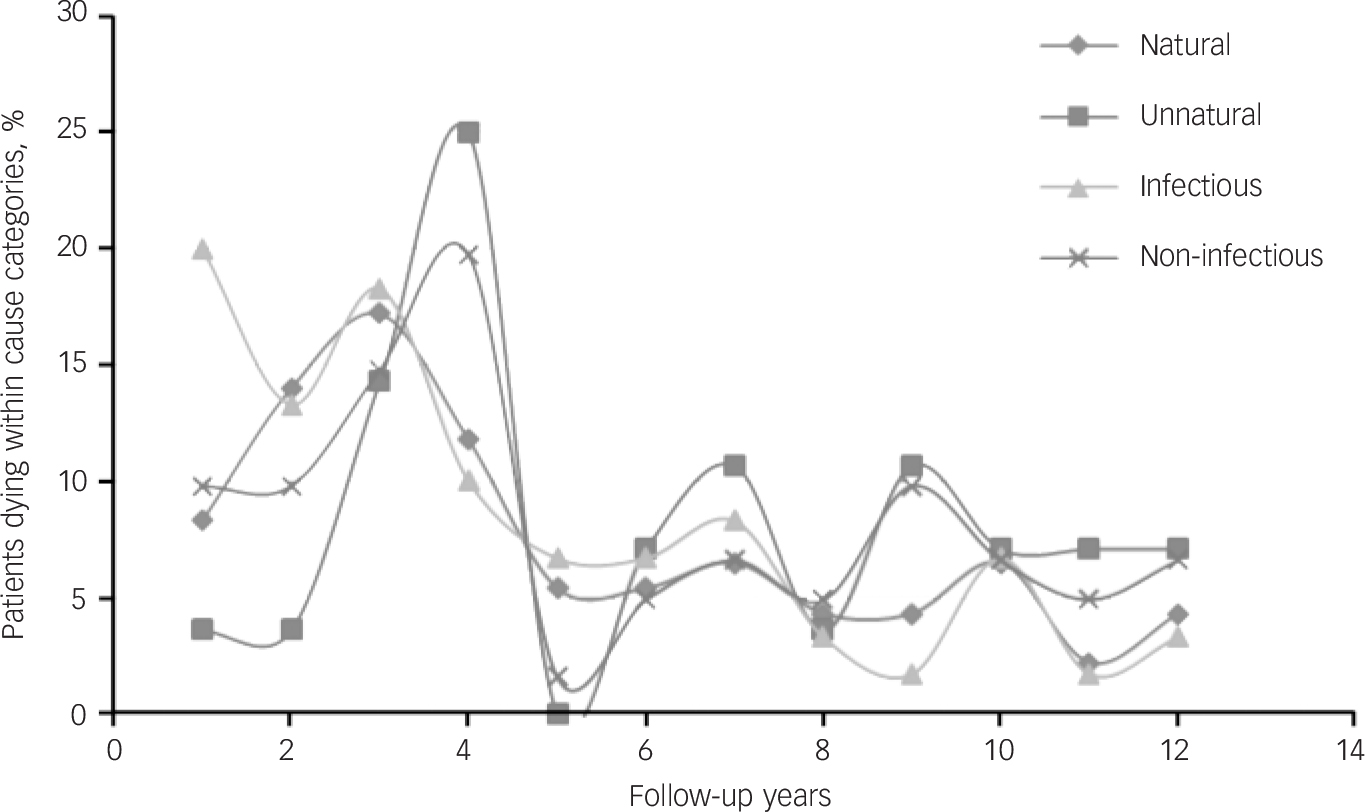
Fig. 2 Percentage of patients dying by follow-up years in broad cause categories (natural v. unnatural and infectious v. non-infectious) indicating pattern of death over time.
Table 3 Causes of mortality in the Butajira cohort according to ICD-10 version: 2010 disease classification

| Mortality cause category | ICD-10 class | n (%) |
|---|---|---|
| Certain infectious and parasitic diseases | I | 60 (49.6) |
| Neoplasms | II | 3 (2.5) |
| Endocrine, nutritional and metabolic diseases | IV | 4 (3.3) |
| Diseases of the nervous system | VI | 1 (0.8) |
| Diseases of the respiratory system | X | 6 (5.0) |
| Diseases of the digestive system | XI | 7 (5.8) |
| Diseases of the genitourinary system | XIV | 2 (1.6) |
| Symptoms, signs and abnormal clinical and laboratory findings, not elsewhere classified | XVII | 8 (6.6) |
| Injury, poisoning and certain other consequences of external causes (suicide) | XIX | 19 (15.7) |
| External causes of morbidity and mortality (accidents) | XX | 11 (9.1) |
| Total | – | 121 (100) |
was not statistically significant compared with both those with schizophrenia (13.8%, n = 9/65) and severe depression (8.6%, n = 2/23). Deaths from the various causes peaked in the first 5 years of follow-up and were more or less constant afterwards (Fig. 2).
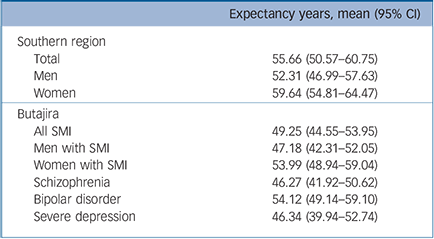
On average the YLL per person for all patients with SMI was 28.4 years. The YLL was slightly higher among women (30.0 years) compared with men (26.9 years). The YLL was also slightly higher for those with severe depression (29.4 years) compared with that for those with schizophrenia (27.7 years) and bipolar disorder (29.0 years). However, because of the larger number of patients who died, schizophrenia made the largest contribution to the overall YLL (52.4%), followed by bipolar disorder (27.9%) and severe depression (19.7%). Whereas deaths related to injuries accounted for 22.4% of YLL, suicide alone contributed to 8.7% of all YLL. Overall, those with SMI had a life expectancy gap of about 6 years and it was nearly 10 years for those with schizophrenia and depression (Table 4). The life expectancy gap for men and women was 5 and 6 years, respectively.
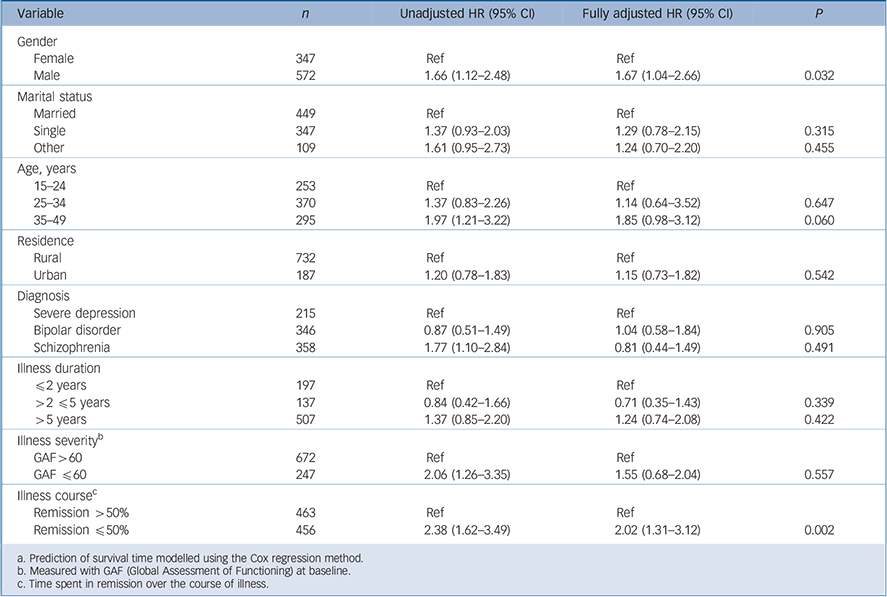
The two factors associated independently with mortality were male gender, and shorter time in remission (Table 5). Thus, those who were in remission for less than 50% of the follow-up period had double the risk of dying (Hazard Ratio (HR) = 2.02, 95% CI 1.31–3.12, P = 0.002). Men also had increased mortality (HR = 1.67, 95% CI 1.04–2.66, P = 0.032). Older age at enrolment into the study did not significantly increase the risk although there may be a trend (HR = 1.85, 95% CI 0.98–3.12, P = 0.060). For all
Table 4 Life expectancy at birth (with 95% CI) of people with severe mental illness (SMI) computed based on the general population of the region
| Expectancy years, mean (95% CI) | |
|---|---|
| Southern region | |
| Total | 55.66 (50.57–60.75) |
| Men | 52.31 (46.99–57.63) |
| Women | 59.64 (54.81–64.47) |
| Butajira | |
| All SMI | 49.25 (44.55–53.95) |
| Men with SMI | 47.18 (42.31–52.05) |
| Women with SMI | 53.99 (48.94–59.04) |
| Schizophrenia | 46.27 (41.92–50.62) |
| Bipolar disorder | 54.12 (49.14–59.10) |
| Severe depression | 46.34 (39.94–52.74) |
Table 5 Factors associated with survival in the Butajira study populationFootnote a
| Variable | n | Unadjusted HR (95% CI) | Fully adjusted HR (95% CI) | P |
|---|---|---|---|---|
| Gender | ||||
| Female | 347 | Ref | Ref | |
| Male | 572 | 1.66 (1.12–2.48) | 1.67 (1.04–2.66) | 0.032 |
| Marital status | ||||
| Married | 449 | Ref | Ref | |
| Single | 347 | 1.37 (0.93–2.03) | 1.29 (0.78–2.15) | 0.315 |
| Other | 109 | 1.61 (0.95–2.73) | 1.24 (0.70–2.20) | 0.455 |
| Age, years | ||||
| 15–24 | 253 | Ref | Ref | |
| 25–34 | 370 | 1.37 (0.83–2.26) | 1.14 (0.64–3.52) | 0.647 |
| 35–49 | 295 | 1.97 (1.21–3.22) | 1.85 (0.98–3.12) | 0.060 |
| Residence | ||||
| Rural | 732 | Ref | Ref | |
| Urban | 187 | 1.20 (0.78–1.83) | 1.15 (0.73–1.82) | 0.542 |
| Diagnosis | ||||
| Severe depression | 215 | Ref | Ref | |
| Bipolar disorder | 346 | 0.87 (0.51–1.49) | 1.04 (0.58–1.84) | 0.905 |
| Schizophrenia | 358 | 1.77 (1.10–2.84) | 0.81 (0.44–1.49) | 0.491 |
| Illness duration | ||||
| ≤2 years | 197 | Ref | Ref | |
| >2 ≤5 years | 137 | 0.84 (0.42–1.66) | 0.71 (0.35–1.43) | 0.339 |
| >5 years | 507 | 1.37 (0.85–2.20) | 1.24 (0.74–2.08) | 0.422 |
| Illness severityFootnote b | ||||
| GAF >60 | 672 | Ref | Ref | |
| GAF ≤60 | 247 | 2.06 (1.26–3.35) | 1.55 (0.68–2.04) | 0.557 |
| Illness courseFootnote c | ||||
| Remission >50% | 463 | Ref | Ref | |
| Remission ≤50% | 456 | 2.38 (1.62–3.49) | 2.02 (1.31–3.12) | 0.002 |
a. Prediction of survival time modelled using the Cox regression method.
b. Measured with GAF (Global Assessment of Functioning) at baseline.
c. Time spent in remission over the course of illness.
Table 6 The association of percentage of time people with severe mental illness (SMI) spent symptomatic with survivalFootnote a

| Diagnostic class | ||||||
|---|---|---|---|---|---|---|
| Schizophrenia | Severe depression | Bipolar disorder | ||||
| Nature of symptoms | HR (95% CI) | P | HR (95% CI) | P | HR (95% CI) | P |
| Percentage in episode | 1.02 (1.01–1.03) | <0.001 | – | – | ||
| Percentage in episode and subthreshold | 1.02 (1.01–1.03) | <0.001 | – | – | ||
| Percentage in depressive episode | 1.06 (1.03–1.09) | <0.001 | 1.03 (1.00–1.07) | 0.098 | ||
| Percentage in subthreshold depression | 1.02 (1.00–1.04) | 0.032 | 1.02 (1.00–1.04) | 0.149 | ||
| Percentage in episode and subthreshold depression | 1.03 (1.02–1.05) | < 0.001 | 1.02 (1.00–1.03) | 0.075 | ||
| Percentage in manic episode | – | 1.05 (1.02–1.07) | <0.001 | |||
| Percentage in episode and subthreshold mania | – | 1.02 (1.01–1.04) | 0.011 | |||
a. Survival analysis using the Cox Regression model – fully adjusted for age, gender, marital status, residence, diagnosis, functioning and symptomatic status at baseline, and duration of illness at recruitment.
disorder subtypes, longer periods in a symptomatic state were associated with shorter survival time (Table 6). For each of the diagnostic groups, spending a higher percentage of follow-up time in episode was associated with an increased risk of premature mortality. For those with depressive disorder (but not the other disorders), subthreshold symptoms were also associated with risk of premature mortality.
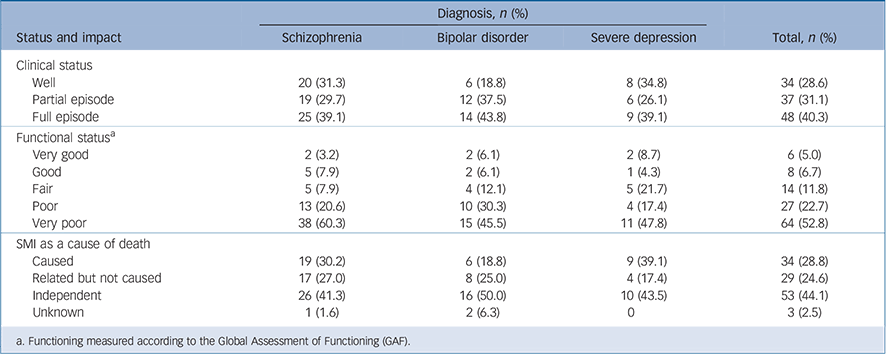
In the month prior to death, most of the deceased were symptomatic (70.2%, n = 85/121) and functionally impaired (75.2%, n = 91/121) because of their mental illness (Table 7). Impairment was consistently high across diagnostic groups: schizophrenia (78.5%), bipolar disorder (75.8%) and severe depression (65.3%). Similarly, high percentages of the deceased were symptomatic across the diagnostic groups: schizophrenia (n = 44, 68.8%); bipolar disorder (n = 26, 78.8%) and severe depression
Table 7 Clinical and functional status of participants who died in the month preceding their death and role of the severe mental illness (SMI) in the death as determined by a physician
| Diagnosis, n (%) | ||||
|---|---|---|---|---|
| Status and impact | Schizophrenia | Bipolar disorder | Severe depression | Total, n (%) |
| Clinical status | ||||
| Well | 20 (31.3) | 6 (18.8) | 8 (34.8) | 34 (28.6) |
| Partial episode | 19 (29.7) | 12 (37.5) | 6 (26.1) | 37 (31.1) |
| Full episode | 25 (39.1) | 14 (43.8) | 9 (39.1) | 48 (40.3) |
| Functional statusFootnote a | ||||
| Very good | 2 (3.2) | 2 (6.1) | 2 (8.7) | 6 (5.0) |
| Good | 5 (7.9) | 2 (6.1) | 1 (4.3) | 8 (6.7) |
| Fair | 5 (7.9) | 4 (12.1) | 5 (21.7) | 14 (11.8) |
| Poor | 13 (20.6) | 10 (30.3) | 4 (17.4) | 27 (22.7) |
| Very poor | 38 (60.3) | 15 (45.5) | 11 (47.8) | 64 (52.8) |
| SMI as a cause of death | ||||
| Caused | 19 (30.2) | 6 (18.8) | 9 (39.1) | 34 (28.8) |
| Related but not caused | 17 (27.0) | 8 (25.0) | 4 (17.4) | 29 (24.6) |
| Independent | 26 (41.3) | 16 (50.0) | 10 (43.5) | 53 (44.1) |
| Unknown | 1 (1.6) | 2 (6.3) | 0 | 3 (2.5) |
a. Functioning measured according to the Global Assessment of Functioning (GAF).
(n = 15, 64.2%). Moreover, mental disorders were considered to be relevant to the death in over half of the deaths either because they were presumed to have led directly to death (n = 34, 28.8%) or were linked to the death (n = 29, 24.6%).
Discussion
To our knowledge this is the largest single-site study describing mortality in SMI from a low-income country setting. It is also one of the very few studies in the world describing mortality experience of community-ascertained cases with minimum treatment exposure. The study has several novel features that contribute to addressing the gap in our knowledge about mortality associated with SMI. First, the study employed rigorous community-based case identification and diagnostic methods, screening a population of over 68 000 people, and has monitored the individuals identified continuously over an average of 10 years of follow-up. Second, the cohort had very low treatment exposure at recruitment. Third, the report provides data on mortality associated with bipolar disorder and severe depression, where we have virtually no data from low-income countries. Finally, the causes of mortality were established close to the time of death and used validated methodologies. Moreover, by using prospective clinical and functional measures, our study also contributes to the evidence on the potential role of psychopathology in causing premature mortality.
Main findings
The study confirms that people with SMI, irrespective of setting, are at increased risk of mortality. Specifically, in this particular setting, the risk of mortality among those with SMI was double that of the general population, which is consistent with previous reports of mortality and SMI in high-income countries, Reference Nordentoft, Wahlbeck, Hallgren, Westman, Osby and Alinaghizadeh41–Reference Tsuang and Woolson49 However, the mortality figures were lower than what we had anticipated. This may be partly because of the increased mortality in the general population related to the high burden of preventable causes other than injuries. Reference Fantahun, Berhane, Hogberg and Wall22,Reference Lulu and Berhane23 The SMR is also lower than the figure we previously reported based on a 5-year follow-up study of schizophrenia. Reference Teferra, Shibre, Fekadu, Medhin, Wakwoya and Alem50 This is likely to be because of higher mortality in the early parts of the follow-up as demonstrated in Fig. 2. Moreover, increased risk of early mortality has been demonstrated in service contact samples of both schizophrenia Reference Brown51,Reference Caidwell and A52 and mood disorders, Reference Angst, Stassen, Clayton and Angst45 particularly for unnatural causes. Reference Brown, Kim, Mitchell and Inskip53 Thus, the previous report may have suffered from the short-term nature of the study given the higher burden of mortality in the early phases of the follow-up period. This is of interest from both a research and service perspective. In terms of research, longer term studies of mortality are more likely to provide more stable and more accurate estimation and should be encouraged. From a service perspective, given the mixed nature of our cohort, which was composed of both individuals with chronic and recent-onset disorders, the finding underscores the need for vigilance in the early periods of service provision irrespective of the duration of illness at the time of first-service contact. However, we cannot rule out the possibility that the reduction in mortality might have been as a result of better care provision related to recent restructurings in the healthcare system, for example, expansion of primary healthcare, although this would be expected to have a greater impact on the population without SMI. A distinct methodology would be required to detect the impact of health system changes on mortality. Based on the current findings, however, we recommend that provision of enhanced care in the early phases of the illness may be essential to improving the mortality outcomes of people with SMI.
Deaths from infectious diseases
Most patients in the study died from infectious causes prevalent within Butajira. Reference Lulu and Berhane23 This is partly a reflection of the limited care available for the population. Therefore, improving the general health of the public is likely to have an impact on the survival of people with SMI. Patients with SMI may also be at a particular disadvantage because they may not complain when they have symptoms, and family support may have been already overstretched when patients develop infections. Further exploration of the mechanisms underlying death from infectious conditions is warranted.
Deaths from unnatural causes
A large proportion of individuals have also died from unnatural causes, primarily suicide. Studies of suicide in Ethiopia have reported the rate to be between 6 and 8 per 100 000 per year. Reference Bekri54,Reference Belete55 The rate among patients with SMI in the Butajira cohort was about 200 per 100 000 per year, a substantially higher rate. The overall mortality rate from all unnatural causes was also high, accounting for 24.8% of all causes (n = 30/121) compared with the rate in the Butajira area which has been estimated at 1.7%. Reference Lulu and Berhane23 In a study from Addis Ababa, the capital of Ethiopia, unnatural causes of death other than suicide accounted for a higher rate (11.2%) Reference Belete55 although still around 50% lower than that of the Butajira sample with SMI.
Contribution of psychopathology to mortality
Given the high rate of deaths from unnatural causes and the high level of psychopathology in the deceased group, it is likely that psychopathology contributed to the death of many patients. This is supported by the finding that SMI was likely to have contributed directly to the deaths of at least a third of all deaths and contribute substantially to the other deaths. Additional evidence for the potential contribution of psychopathology to mortality comes from the survival analyses in which better survival was predicted by longer periods in remission, while longer duration in a symptomatic state was associated with increased mortality in all disorder categories. Two recommendations follow from these findings. First, it is reasonable to suggest that improving mental healthcare provision may improve mortality outcomes. Second, the contribution of psychopathology to mortality has to be accounted for in the estimation of the global disease burden although this may call for a new technology.
Life expectancy
People with SMI lost about three decades of their life to premature death in this rural Ethiopian setting. Extrapolating this nationally, people with SMI lose a substantial amount of potential life years annually. Despite overlap in confidence intervals with the Southern region, the findings regarding the life expectancy gaps are important. A life expectancy at birth for people with schizophrenia and depression (46 years) is very low. Given the low life expectancy of the population in general, the life expectancy figures are worth paying attention to and have to be taken as evidence of the substantial neglect of people with SMI in such settings. Moreover, this study will serve as a baseline for future studies of the life expectancy gap in people with SMI in Ethiopia, which is likely to grow with improvement in the life expectancy of the general population.
Limitations
There are a few limitations worth mentioning. First, because of the lack of data on national cause-specific mortality, we were unable to present cause-specific mortality ratios for people with SMI. Second, cause of mortality confirmed by a physician would have been the best approach to determine causes of mortality; however, short of a physician determination, we have used the next best approach, the verbal autopsy method. The historical nature of the verbal autopsy assessment may have led to random misclassification of cause of mortality. Finally, information related to self-harm is not always volunteered. Therefore, the figure for suicide may be an underestimate.
Implications
This relatively large-scale cohort study from rural Ethiopia confirms the increased risk of mortality associated with SMI irrespective of setting. The study re-establishes mortality as a very important outcome for people with SMI in low-income settings despite the high burden of premature mortality from diverse preventable causes. The study adds new data not only on mortality in people with SMI in low-income countries, but also to the worldwide database on mortality among those with SMI identified and living in the community. The study highlights the need to improve the mental healthcare as well as the physical healthcare of people with SMI. The study also makes a case for the inclusion of mortality directly attributable to mental disorders in the estimation of the global disease burden. This is important to increase the visibility of mental health in the public health agenda, reflecting its rightful place.


eLetters
No eLetters have been published for this article.