Telephone interviews with good psychometric properties have been developed for attention-deficit hyperactivity disorder (ADHD) and general psychopathology in childhood (Reference Nadder, Silberg and EavesNadder et al., 1998; Reference Rohde, Lewinsohn and SeelyRohde et al., 1998; Reference Holmes, Lawson and LangleyHolmes et al., 2004), but one assessing traits related to autistic spectrum disorders and comorbid psychiatric problems has been lacking. A number of paper screening instruments for autistic spectrum disorder exist, including the Checklist for Autism in Toddlers (CHAT; Reference Baron-Cohen, Allen and GillbergBaron-Cohen et al., 1992), the Asperger Syndrome Screening Questionnaire (ASSQ; Reference Ehlers and GillbergEhlers & Gillberg, 1993), the Autism Screening Questionnaire (ASQ; Reference Berument, Rutter and LordBerument et al, 1999) and the Autism Quotient (AQ; Reference Baron-Cohen, Wheelwright and SkinnerBaron-Cohen et al, 2001), but these assess only narrow autism/Asperger syndrome and do not take into account the most common coexisting problems. The Autism–Tics, ADHD and Other Comorbidities Inventory (A–TAC) is a comprehensive screening interview, evaluated for reliability and validity as a parent telephone interview for autistic spectrum disorders, ADHD, tic disorders, developmental coordination disorder and specific learning disorders. Results from parent interviews blinded to clinical diagnoses are compared with parent interviews regarding healthy control children.
METHOD
Development and design of the interview
The telephone interview is based on a screening questionnaire developed at the Department of Child and Adolescent Psychiatry, Göteborg University, Sweden, for the purpose of screening general populations in research and mental health surveys. The 178-item A–TAC questionnaire contains all symptoms listed in the DSM–IV (American Psychiatric Association, 1994) symptom criteria of childhood-onset neuropsychiatric disorders, a selection of DSM–IV symptoms listed for other psychiatric disorders, and additional items including symptoms listed in the Gillberg & Gillberg (Reference Gillberg and Gillberg1989) algorithm for Asperger syndrome, and questions or aspects included in published questionnaires for screening or diagnosis of autistic spectrum disorders and general psychiatric disorders such as the ASSQ (Reference Ehlers and GillbergEhlers & Gillberg, 1993), the Asperger Syndrome Diagnostic Interview (ASDI; Reference Gillberg, Gillberg and RåstamGillberg et al, 2001) and the Five to Fifteen Questionnaire (Reference Kadesjo, Janols and KorkmanKadesjo et al, 2004).
The telephone interview is highly structured, with four possible ratings for each item: ‘yes’; ‘yes, previously’ (both scored as 1 in this study); ‘yes, to some extent’ (scored as 0.5 in this study); and ‘no’. It is intended for use with parents as informants and lay persons as interviewers. The interview is preceded by a short introduction to inform the parent that the interview concerns problems or difficulties that the child is either experiencing now or has experienced earlier in life. These problems or difficulties must be pronounced compared with other children of the same age. The parent is also asked to write down the four response alternatives, to have them visually available throughout the interview. In this validation study, the parents were also specifically asked to provide no more facts about the child than those that the interviewer enquired about. This was in order to assure masking of the interviewer to the child's diagnostic status. The time for completing the interview varied from 15 min to 35 min.
Participants
The parents of 118 children and adolescents (aged 7–18 years) were asked to participate in the study, and parents of 112 accepted. One of these had to be excluded because of language difficulties. Of the 111 children, 84 (32 girls and 52 boys, mean age 11.5 years) were patients at the Child Neuropsychiatric Clinic in Göteborg. They were either under investigation at the time of the study or had recently been investigated. Children with any diagnosed or suspected chromosomal or genetic medical disorder – other than high-functioning individuals with fragile X or CATCH 22 (cardiac defects, abnormal facies, thymic hypoplasia, cleft palate, hypocalcaemia and a deletion on chromosome 22) – were excluded.
Twenty-seven children (10 girls, 17 boys, mean age 12.2 years, range 9–17) constituted a comparison group of healthy children without any known assessment or treatment for child and adolescent mental health problems. The comparison cases were children of staff at the Child Neuropsychiatric Clinic, the Department of Child and Adolescent Psychiatry and the Department of Forensic Psychiatry in Göteborg, and of their acquaintances. After all the interviews had been completed, parents were again contacted and asked for information about earlier psychiatric problems or contacts with child psychiatry or psychology departments.
Interview procedure
Two medical students (one 4th year, one 5th year) completed the 111 telephone interviews. They were masked to diagnosis of the target cases and to possible psychiatric history of the comparison cases. The two interviewers conducted ten of the interviews together, during which they took turns, interviewing five parents each (all target cases) while the other listened and filled in the questionnaire independently. The results obtained were then compared in order to analyse interrater reliability. Ten of the interviewees (eight target cases, two comparison cases) were contacted again 6–8 weeks after the first interview and asked to participate in a second interview; they were informed that the purpose of the second interview was to determine if responses would vary over time. These parents had not been informed at the first interview that they would be contacted again. The interviewers were still masked to diagnoses (target group) as well as to prior psychiatric problems (comparison group). All clinical information was collected after all the interviews had been completed.
Diagnostic process
Diagnoses assigned during investigations at the clinic were based on medical history, physical examination (including a neuromotor assessment) by a physician with expertise in neuropsychiatry, and psychological examination by a trained neuropsychologist. In all children, an assessment of cognitive level was made with a test battery appropriate for the child's mental age (Reference DollDoll, 1965; Reference GriffithsGriffiths, 1970; Reference LeiterLeiter, 1980; Reference WechslerWechsler, 1992). Children with significant school achievement problems were also examined by an educational specialist using tests of reading and writing skills, observation of the child at school, and interviews with the child's teachers about school performance and behaviour. Structured instruments, such as the Autism Diagnostic Interview–Revised (ADI–R; Reference Lord, Rutter and Le CouteurLord et al, 1994), the Diagnostic Interview for Social and Communication Disorders (DISCO; Reference Leekam, Libby and WingLeekam et al, 2002; Reference Wing, Leekam and LibbyWing et al, 2002), the Childhood Autism Rating Scale (Reference Schopler, Reichler and RennerSchopler et al, 1988), the ASDI (Reference Gillberg, Gillberg and RåstamGillberg et al, 2001) and the ADHD Rating Scale (Reference DuPaul, Power and AnastopoulusDuPaul et al, 1998) were used as appropriate, although not the sole basis for a diagnosis. For each case that fulfilled DSM–IV criteria for a specific condition, the physician in charge was asked to complete a diagnostic protocol specifying other possible comorbid diagnoses.
Attrition analysis
Six of the initially contacted 118 parents declined to participate in the study: two lacked motivation for further exploration following the clinical investigation and diagnosis of their children; one declined owing to a difficult life situation; and three parents did not supply a reason. One interview could not be completed owing to language difficulties. All seven cases of non-completion were from the target group.
Statistical analyses
The interview ratings were coded on a three-point scale: 0 indicating normality (‘no’), 0.5 indicating some abnormality (‘yes, to some extent’) and 1.0 indicating abnormality or earlier abnormality (‘yes’ or ‘yes, previously’). Sum scores were calculated for each diagnostic category. Interrater and test – retest reliability was assessed through intraclass correlations between dimensional ratings within each category. The intraclass correlation coefficient (ICC), defined as (variance between subject)/(variance between subject+variance of error), includes both random errors and systematic differences, but is also dependent on the range of the variable measured. The ICC ranges from 0 (no agreement) to 1 (perfect agreement); values above 0.75 indicate excellent reliability, 0.4–0.75 indicate fair to poor reliability, and values below 0.4 indicate poor reliability (Reference FleissFleiss, 1986). Diagnostic validity for the neuropsychiatric disorders, where the prevalence of disorders was sufficiently high for these calculations, were assessed first through a receiver operating characteristics (ROC) curve, where clinical diagnosis was the dependent variable and the telephone interview sum score the independent predictor. The area under the curve (AUC) is a measure of the overall predictive validity of the instrument where AUC=0.50 signals random prediction, 0.60<AUC≤0.70 poor, 0.70<AUC≤0.80 fair, 0.80<AUC≤0.90 good and AUC>0.90 excellent validity (Reference TapeTape, 2004). The inflection point of the curve is the optimal cut-off value of the dimensional independent variable for a categorical decision in the dependent variable with maximal sensitivity and specificity. These cut-offs were then used for calculating four-field tables comparing the diagnostic results for the telephone interviews and the clinical assessments through Cohen's kappa, values above 0.60 indicating good correspondence (Reference AltmanAltman, 1991). All statistics were calculated with the Statistical Package for the Social Sciences, version 11.0, using a significance level of P<0.05.
RESULTS
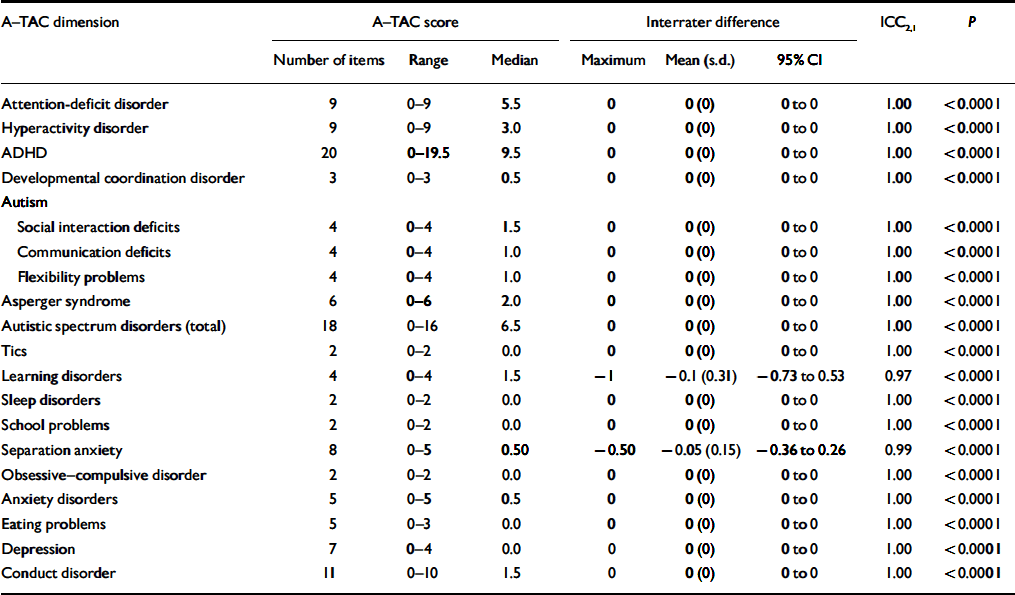
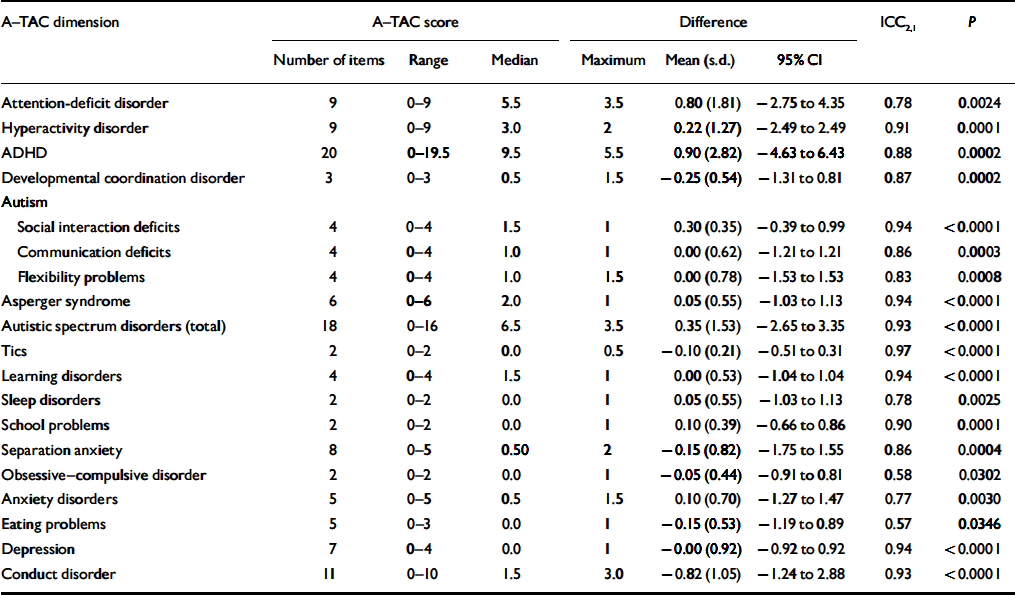
The interrater reliability was excellent overall (Table 1). The test – retest reliability (Table 2) was highly significant for all assessed dimensions, and good for most aspects of the neuropsychiatric disorders, although slightly lower for attention deficits and anxiety problems and considerably lower for some of the less common conditions, such as obsessive – compulsive disorder, sleeping problems and eating disorders.
Table 1 Results of interrater reliability analysis
| A–TAC dimension | A–TAC score | Interrater difference | ICC2,1 | P | ||||
|---|---|---|---|---|---|---|---|---|
| Number of items | Range | Median | Maximum | Mean (s.d.) | 95% CI | |||
| Attention-deficit disorder | 9 | 0–9 | 5.5 | 0 | 0 (0) | 0 to 0 | 1.00 | <0.0001 |
| Hyperactivity disorder | 9 | 0–9 | 3.0 | 0 | 0 (0) | 0 to 0 | 1.00 | <0.0001 |
| ADHD | 20 | 0–19.5 | 9.5 | 0 | 0 (0) | 0 to 0 | 1.00 | <0.0001 |
| Developmental coordination disorder | 3 | 0–3 | 0.5 | 0 | 0 (0) | 0 to 0 | 1.00 | <0.0001 |
| Autism | ||||||||
| Social interaction deficits | 4 | 0–4 | 1.5 | 0 | 0 (0) | 0 to 0 | 1.00 | <0.0001 |
| Communication deficits | 4 | 0–4 | 1.0 | 0 | 0 (0) | 0 to 0 | 1.00 | <0.0001 |
| Flexibility problems | 4 | 0–4 | 1.0 | 0 | 0 (0) | 0 to 0 | 1.00 | <0.0001 |
| Asperger syndrome | 6 | 0–6 | 2.0 | 0 | 0 (0) | 0 to 0 | 1.00 | <0.0001 |
| Autistic spectrum disorders (total) | 18 | 0–16 | 6.5 | 0 | 0 (0) | 0 to 0 | 1.00 | <0.0001 |
| Tics | 2 | 0–2 | 0.0 | 0 | 0 (0) | 0 to 0 | 1.00 | <0.0001 |
| Learning disorders | 4 | 0–4 | 1.5 | –1 | –0.1 (0.31) | –0.73 to 0.53 | 0.97 | <0.0001 |
| Sleep disorders | 2 | 0–2 | 0.0 | 0 | 0 (0) | 0 to 0 | 1.00 | <0.0001 |
| School problems | 2 | 0–2 | 0.0 | 0 | 0 (0) | 0 to 0 | 1.00 | <0.0001 |
| Separation anxiety | 8 | 0–5 | 0.50 | –0.50 | –0.05 (0.15) | –0.36 to 0.26 | 0.99 | <0.0001 |
| Obsessive – compulsive disorder | 2 | 0–2 | 0.0 | 0 | 0 (0) | 0 to 0 | 1.00 | <0.0001 |
| Anxiety disorders | 5 | 0–5 | 0.5 | 0 | 0 (0) | 0 to 0 | 1.00 | <0.0001 |
| Eating problems | 5 | 0–3 | 0.0 | 0 | 0 (0) | 0 to 0 | 1.00 | <0.0001 |
| Depression | 7 | 0–4 | 0.0 | 0 | 0 (0) | 0 to 0 | 1.00 | <0.0001 |
| Conduct disorder | 11 | 0–10 | 1.5 | 0 | 0 (0) | 0 to 0 | 1.00 | <0.0001 |
Table 2 Results of test – retest analyses
| A–TAC dimension | A–TAC score | Difference | ICC2,1 | P | ||||
|---|---|---|---|---|---|---|---|---|
| Number of items | Range | Median | Maximum | Mean (s.d.) | 95% CI | |||
| Attention-deficit disorder | 9 | 0–9 | 5.5 | 3.5 | 0.80 (1.81) | –2.75 to 4.35 | 0.78 | 0.0024 |
| Hyperactivity disorder | 9 | 0–9 | 3.0 | 2 | 0.22 (1.27) | –2.49 to 2.49 | 0.91 | 0.0001 |
| ADHD | 20 | 0–19.5 | 9.5 | 5.5 | 0.90 (2.82) | –4.63 to 6.43 | 0.88 | 0.0002 |
| Developmental coordination disorder | 3 | 0–3 | 0.5 | 1.5 | –0.25 (0.54) | –1.31 to 0.81 | 0.87 | 0.0002 |
| Autism | ||||||||
| Social interaction deficits | 4 | 0–4 | 1.5 | 1 | 0.30 (0.35) | –0.39 to 0.99 | 0.94 | <0.0001 |
| Communication deficits | 4 | 0–4 | 1.0 | 1 | 0.00 (0.62) | –1.21 to 1.21 | 0.86 | 0.0003 |
| Flexibility problems | 4 | 0–4 | 1.0 | 1.5 | 0.00 (0.78) | –1.53 to 1.53 | 0.83 | 0.0008 |
| Asperger syndrome | 6 | 0–6 | 2.0 | 1 | 0.05 (0.55) | –1.03 to 1.13 | 0.94 | <0.0001 |
| Autistic spectrum disorders (total) | 18 | 0–16 | 6.5 | 3.5 | 0.35 (1.53) | –2.65 to 3.35 | 0.93 | <0.0001 |
| Tics | 2 | 0–2 | 0.0 | 0.5 | –0.10 (0.21) | –0.51 to 0.31 | 0.97 | <0.0001 |
| Learning disorders | 4 | 0–4 | 1.5 | 1 | 0.00 (0.53) | –1.04 to 1.04 | 0.94 | <0.0001 |
| Sleep disorders | 2 | 0–2 | 0.0 | 1 | 0.05 (0.55) | –1.03 to 1.13 | 0.78 | 0.0025 |
| School problems | 2 | 0–2 | 0.0 | 1 | 0.10 (0.39) | –0.66 to 0.86 | 0.90 | 0.0001 |
| Separation anxiety | 8 | 0–5 | 0.50 | 2 | –0.15 (0.82) | –1.75 to 1.55 | 0.86 | 0.0004 |
| Obsessive – compulsive disorder | 2 | 0–2 | 0.0 | 1 | –0.05 (0.44) | –0.91 to 0.81 | 0.58 | 0.0302 |
| Anxiety disorders | 5 | 0–5 | 0.5 | 1.5 | 0.10 (0.70) | –1.27 to 1.47 | 0.77 | 0.0030 |
| Eating problems | 5 | 0–3 | 0.0 | 1 | –0.15 (0.53) | –1.19 to 0.89 | 0.57 | 0.0346 |
| Depression | 7 | 0–4 | 0.0 | 1 | –0.00 (0.92) | –0.92 to 0.92 | 0.94 | <0.0001 |
| Conduct disorder | 11 | 0–10 | 1.5 | 3.0 | –0.82 (1.05) | –1.24 to 2.88 | 0.93 | <0.0001 |
Validity in screening and establishing cut-off scores
A ROC curve (Fig. 1) plotting the sum of the DSM–IV criteria (independent variable) and a diagnosis within the autism spectrum (dependent variable) yielded an AUC of 0.88. The addition of the Gillberg & Gillberg (Reference Gillberg and Gillberg1989) criteria for Asperger syndrome did not improve the screening for any diagnosis in the autism spectrum, yielding a ROC curve plot with an AUC of 0.88. The best match was achieved with a cut-off score of 4.5, yielding a four-field table with 34 (31%) true positives, 57 (51%) true negatives, 16 (14%) false positives and 4 (4%) false negatives. Cohen's κ for this model was 0.63 (P<0.001). The sensitivity was 0.89, the specificity 0.78, the positive predictive value 0.68 and the negative predictive value 0.93. A cross-tabulation of all specific diagnostic categories within the autism spectrum with their respective DSM–IV criteria in the interview (without any adjustment of cut-off levels) showed much poorer performance; for autism κ=0.22 (P=0.011), for Asperger syndrome κ=0.27 (P=0.002) and for pervasive developmental disorders not otherwise specified κ=0.07 (P=0.418).
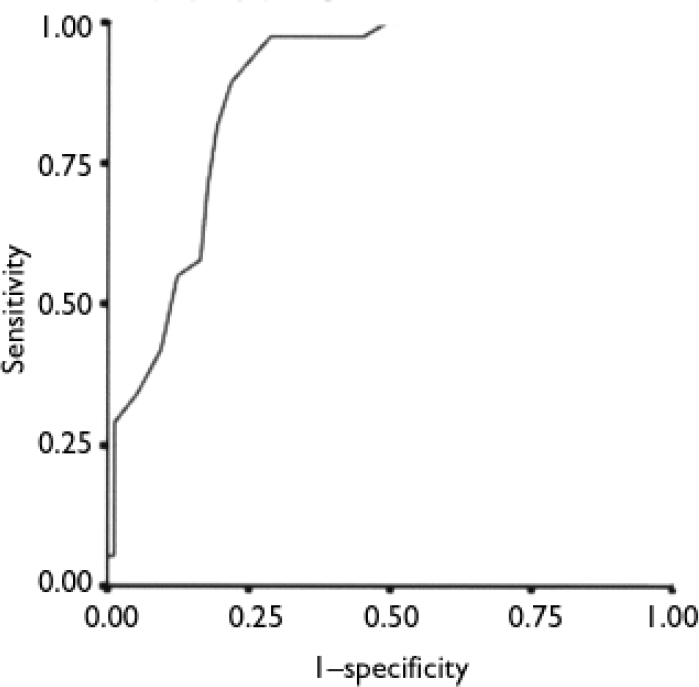
Fig. 1 Receiver operating characteristics curve for the relationship between the sum of DSM–IV autism items and a diagnosis in the autism spectrum (area under curve 0.88). Diagonal segments are produced by ties.
For ADHD the AUC was 0.90 for the DSM–IV symptoms and increased to 0.91 with the addition of the A–TAC questions ‘Does he/she alternate between exaggerated activity and passivity?’ and ‘Does he/she get excited by having a number of persons around?’ (Fig. 2). The optimal cut-off was eight A–TAC symptoms, which yielded a distribution of 58 (52%) true positives, 36 (32%) true negatives, 12 (11%) false positives and 5 (5%) false negatives; Cohen's κ=0.68 (P<0.001). The sensitivity was 0.92, the specificity 0.75, the positive predictive value 0.83 and the negative predictive value 0.88.
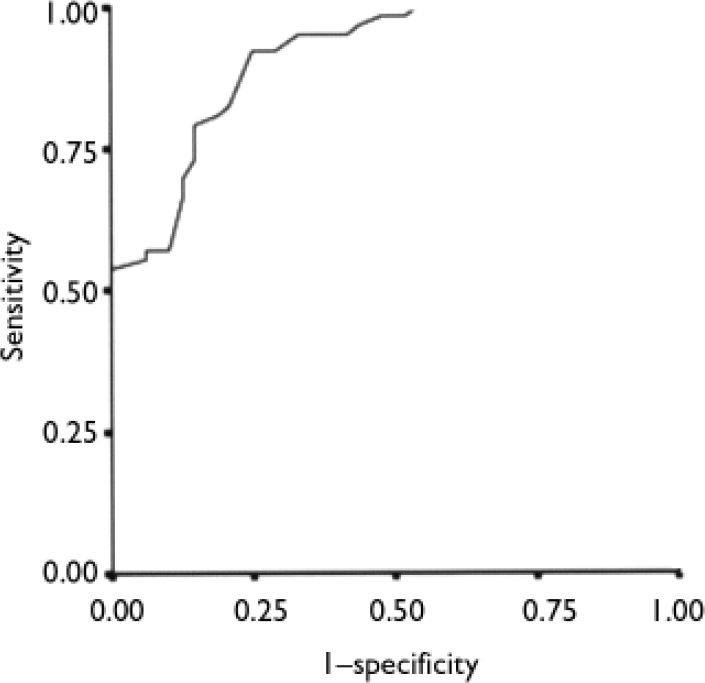
Fig. 2 Receiver operating characteristics curve for the relationship between the sum of DSM–IV attention-deficit hyperactivity disorder (ADHD) items and a diagnosis of ADHD (area under curve 0.91).
For tic disorders (Tourette syndrome or chronic tics) the AUC was 0.84 (Fig. 3) and the optimal cut-off was two symptoms, which yielded a distribution of 7 (6%) true positives, 86 (77%) true negatives, 13 (12%) false positives and 5 (5%) false negatives; κ=0.35 (P<0.001). The sensitivity was 0.58, the specificity 0.87, the positive predictive value 0.35 and the negative predictive value 0.95.
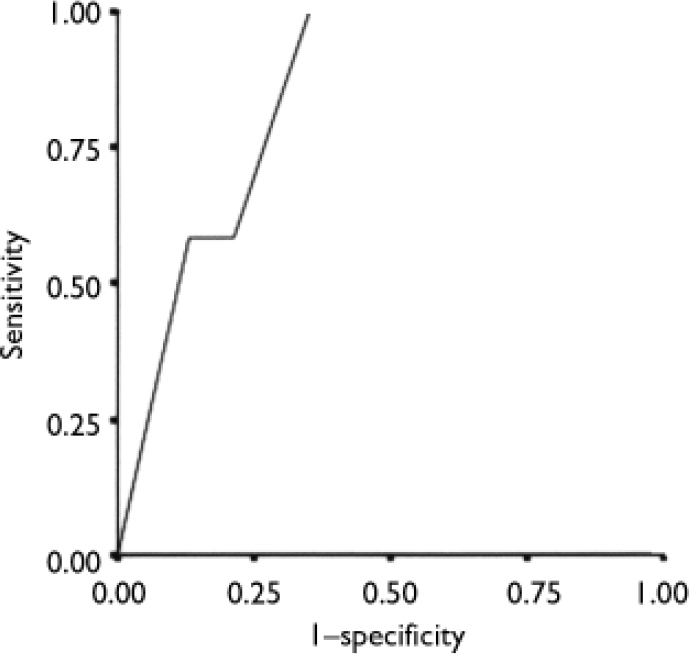
Fig. 3 Receiver operating characteristics curve for the relationship between the sum of tic disorder questions and a diagnosis of chronic tic disorder (area under curve 0.84).
For learning disorders the AUC of the ROC curve was 0.74 (Fig. 4) and the optimal cut-off was 3.5 symptoms, which yielded a distribution of 8 (7%) true positives, 88 (80%) true negatives, 5 (5%) false positives and 10 (9%) false negatives; κ=0.44 (P<0.001). The sensitivity was 0.44, the specificity 0.95, the positive predictive value 0.62 and the negative predictive value 0.90.
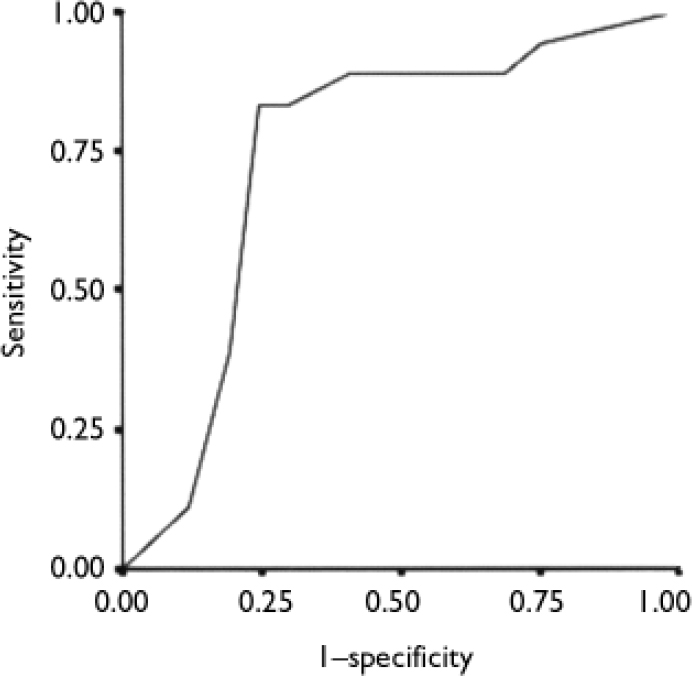
Fig. 4 Receiver operating characteristics curve for the relationship between the sum of learning disorder questions and a diagnosis of learning disorder (area under curve 0.74).
For developmental coordination disorder the AUC of the ROC curve was 0.71 (Fig. 5) and the optimal cut-off was 1.5 symptoms, which yielded a distribution of 14 (13%) true positives, 63 (57%) true negatives, 27 (24%) false positives and 7 (6%) false negatives; κ=0.27 (P=0.002). The sensitivity was 0.67, the specificity 0.70, the positive predictive value 0.34 and the negative predictive value 0.90.
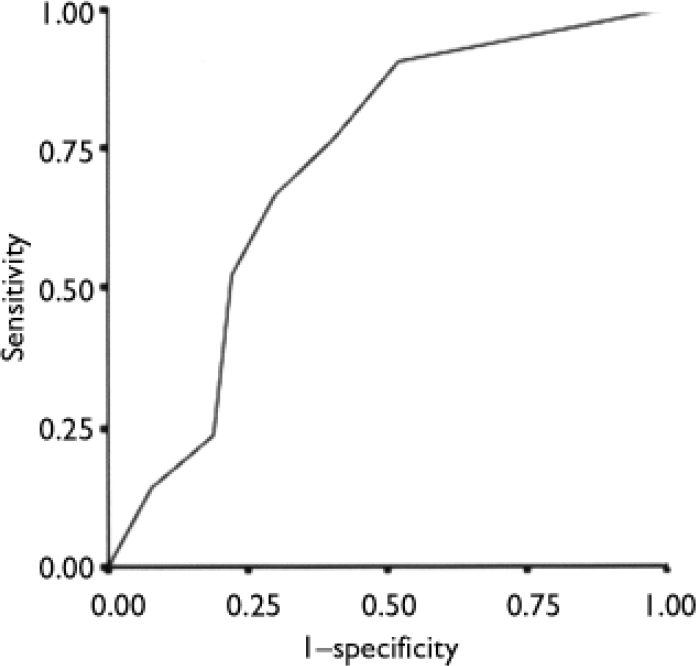
Fig. 5 Receiver operating characteristics curve for the relationship between the sum of developmental questions and a diagnosis of development coordination disorder (area under curve 0.71).
DISCUSSION
This preliminary validation and reliability study showed that the A–TAC telephone interview was reliable in terms of interrater agreement (as expected, since the interview is highly structured and the ratings were simultaneous) and also test – retest agreement. Because of the low prevalence of general child psychiatric diagnoses in the study group, it was not possible to assess the interview's capacity for identifying conditions such as depression, anxiety, eating disorders or obsessive – compulsive disorder. For the neuropsychiatric disorders, however, particularly for autistic spectrum disorders and ADHD, the instrument appeared to work well. Kappa values over 0.60 when comparing two entirely different diagnostic procedures (a lay person administering a structured interview v. comprehensive neuropsychiatric assessment by a team of clinical specialists) can be considered very good. It is also open to argument which gold standard should be chosen for this kind of study. In order to validate a telephone interview, it might seem to be more appropriate to use rating scores from DISCO and ADI–R algorithms rather than clinical diagnosis as an external validation criterion. Kappa values for tics, learning disorders and developmental coordination disorder were lower, with AUCs in the fair range of prediction, probably reflecting too narrow a range of possible responses, resulting in poor resolution. A possibly less stringent clinical diagnostic assessment might also be at the root of this problem.
We are now pursuing the further development of this instrument through the incorporation of more questions under each domain, to provide both screening questions and a wider set of more detailed questions with dimensional symptom ratings for those who screen positive. This instrument will be further validated in other neuropsychiatric patient groups, in general child and adolescent psychiatry groups, and in the normal population.
Clinical Implications and Limitations
CLINICAL IMPLICATIONS
-
▪ The Autism–Tics, Attention-Deficit Hyperactivity Disorder and Other Comorbidities Inventory (A–TAC) telephone interview may be used for screening in research and mental health surveys to assess autistic spectrum disorders and common comorbid conditions.
-
▪ The A–TAC does not require expert interviewers.
-
▪ The number of symptoms affirmed in the A–TAC may be used as a dimensional measure of the probability of a clinical diagnosis.
LIMITATIONS
-
▪ The study group was small, and the controls were not randomly recruited from the general population because of ethical considerations.
-
▪ It is unclear whether clinical diagnoses or results on established instruments should be used as the gold standard in validation studies such as this.
-
▪ Parents waiting for clinical investigations may be more prone to describe problems in their children than other parents.
Acknowledgements
The study was supported by research grants from Alcohol Research Council of the Swedish Alcohol Retailing Monopoly, the Wilhelm and Martina Lundberg Research Foundation, the Frimurare Barnhusdirektionen Research Foundation and the Swedish National Research Council.


eLetters
No eLetters have been published for this article.