Introduction
Sulphate components constitute a major part of the submicron aerosol body and thus contribute significantly to direct and indirect aerosol radiative forcing. While ice-core studies clearly show that anthropogenic sulphur-dioxide emission controls the modern sulphate budget of the Northern Hemisphere (Reference Neftel, Beer, Oeschger, Zürcher and FinkelNeftel and others, 1985; Reference Mayewski, Lyons, Spencer, Twickler, Buck and WhitlowMayewski and others, 1990; Reference Fischer, Wagenbach and KipfstuhlFischer and others, 1998b), much less is known about the natural sulphate source apportionment (mainly with respect to marine dimethyl sulphide, soil dust, sea salt and volcanoes) and about the possible long-term sulphate variability during the pre-industrial era. for sulphate, glaciochemical ice-core studies from Greenland have been evaluated in detail mainly over the last 200 years (with only few records available back to 500 years (e.g. Reference Fischer, Wagenbach and KipfstuhlFischer and others, 1998b)).Time series from the Greenland Summit exist over the entire Holocene (and beyond) in up to biannual (Reference MayewskiMayewski and others, 1997) and in small sections at seasonal resolution (Reference LegrandLegrand and others, 1997). They were examined, however, mainly in view of strong volcanic inputs (Reference ZielinskiZielinski and others, 1994; Reference ZielinskiZielinski, 1995) or Holocene/Pleistocene changes of atmospheric sulphur species (Reference LegrandLegrand and others, 1997). Here we report on detailed continuous high-resolution sulphate analyses on an ice core from northeast Greenland going back to approximately AD 830. This record covers both the Little IceAge and the Medieval Warming. Evaluation of our dataset, which stands out as the first long-term sulphate record in sub-seasonal resolution, is mainly aimed at: (1) assessment of the reliability of the newly applied continuous flow analyses (CFA) for sulphate (even at relatively low levels), (2) the deployment of our high-resolution sulphate record for the examination of distinct peaks such as volcanic horizons made up by H2SO4, and (3) inspection of the last 1200 year period for possible long-term perturbation in the background sulphate level.
Methods
Sample collection and processing
Within the North Greenland Traverse (NGT) project, 13 ice cores covering mainly the last 500 years were drilled, along with numerous shallow firn cores and snow-pit samplings (Reference Fischer, Wagenbach and KipfstuhlFischer and others, 1998a). to use the potential of the high depth resolution of the CFA system, we selected one of the deeper cores (150 m) situated in the less explored low-accumulation area of northeast Greenland, hereafter denoted as B20 (78˚50’N, 36˚30’W; 2150 ma.s.l.). for the geographical position of B20 in relation to other drill sites see Figure 1.
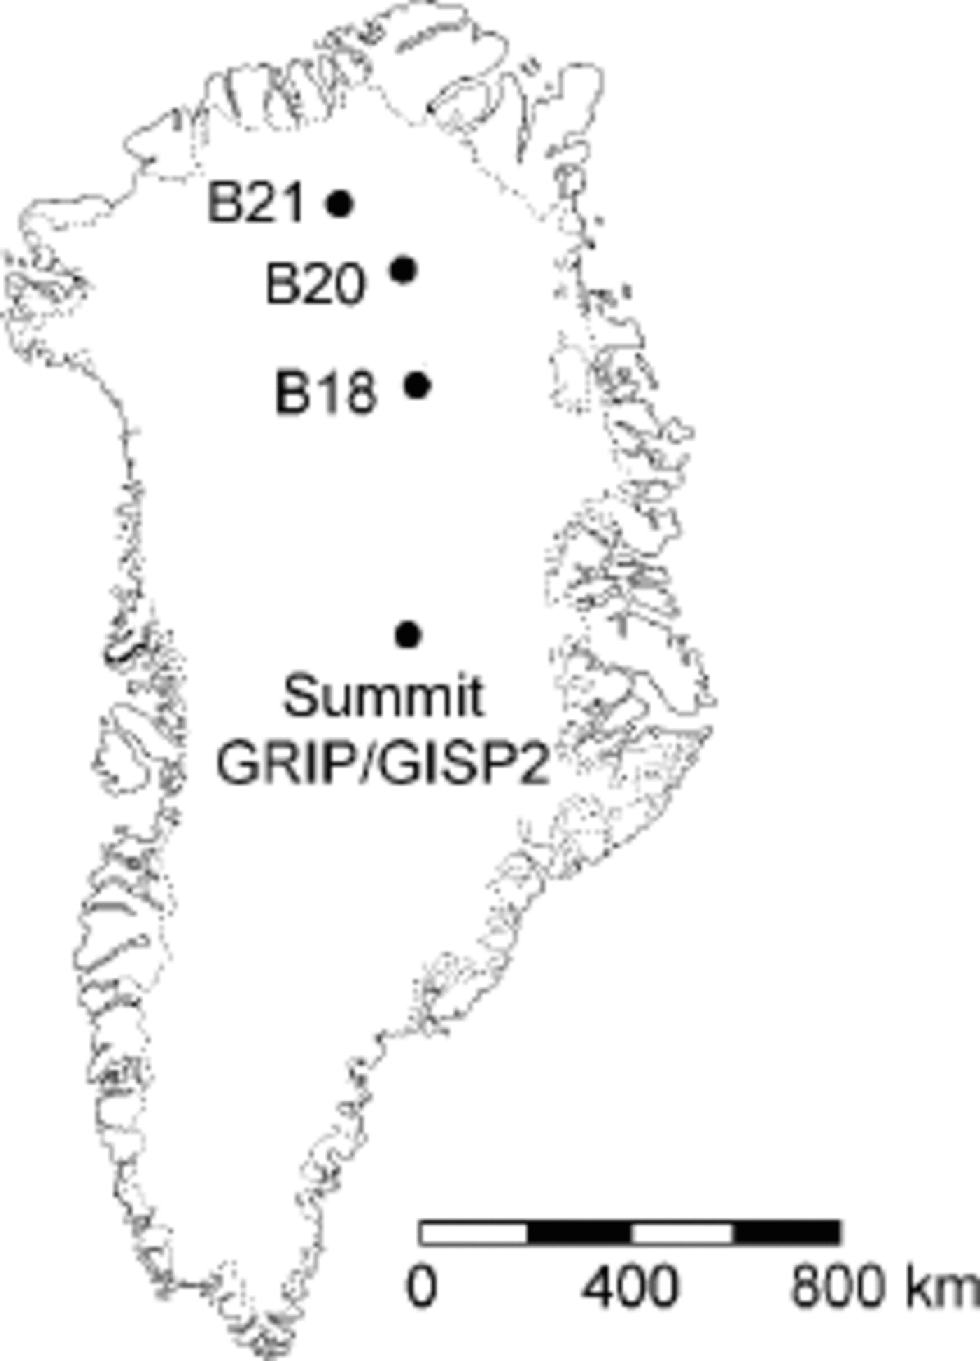
Fig. 1 Geographical position of the B20 ice core in relation to other NGT drill sites and Summit.
Core sections, 363 cm2 and 110 cm long, were transported to the Bern laboratory where they were continuously melted on a special firn melt head (Reference RöthlisbergerRöthlisberger and others, 2000), as an important part of the core consists of porous firn. the uncontaminated meltwater from the central part of the melt head, which has not been exposed to the ambient atmosphere, was permanently drained off, debubbled and split into nine substreams at a flow rate of 0.9 mLmin–1 each for concurrent online chemical analyses by CFA.
Chemical analyses
For the chemical measurements, a CFA system was used as described in detail by Reference RöthlisbergerRöthlisberger and others (2000). It essentially consists of fluorescence or absorption spectrometric detection systems for sulphate, nitrate, calcium, sodium, ammonium and hydrogen peroxide. In addition, the electrolytical meltwater conductivity was measured continuously as an estimate for the total ion concentration.
The newly developed sulphate detection system is described by Reference RöthlisbergerRöthlisberger and others (2000). the detection principle is based on a standard photometric flow-injection method using methylthymol blue (MTB) (Reference Madsen and MurphyMadsen and Murphy, 1981) which was adapted to the existing CFA system. Thereby sulphate is indirectly determined by competitive reaction of MTB with barium ions. the resulting absorbance at 608 nm of MTB–barium complexes decreases as sulphate concentration increases.
The sensitivity of the sulphate determination is strongly affected by the quality of the MTB reagent and by the regularity of the various flow rates. the detection limit (calculated as three times the standard deviation of the baseline noise) is about 40 ng g–1, which is higher by up to a factor of four than the lowest concentration levels expected in Greenland ice. the maximum of the linear range of the calibration curve approaches 6000 ng g–1 and exceeds the maximum values of the measured samples by up to a factor of five. By evaluating multiple measurements on the same core section, we estimate the total uncertainty of a single data point selected out of the continuous record to be about 15%, but at least ±20 ng g–1, for concentrations 5130 ngg–1. This is still above the typical uncertainty of around 10% achieved for all other CFA detection systems described by Reference RöthlisbergerRöthlisberger and others (2000).With a melting rate of approximately 3.5 cmmin–1 and a temporal resolution of typically 20 s associated with the continuous sulphate signal (corresponding to the time needed to drop to 1/e of the signal of a sulphate standard solution measurement after switching back to blank), the characteristic depth resolution is estimated to be about 1cm.
Possible additional errors in the sulphate determination could be: (1) baseline distortion due to small uncontrollable flow-rate changes and due to flow interruption during valve switches, leading to transient systematic errors in both directions; (2) deviations from the required 1:1 molar ratio of MTB and barium in the reagent, causing a slightly smaller slope of the calibration curve for low sulphate concentrations which resulted in an underestimation for concentration levels 5200 ng g–1 and an overestimation for higher values; and (3) disproportionate occurrence of gaps in the dataset at low concentration levels due to unreliable readings close to the detection limit, leading to systematic higher overall means. A formal assessment of the sulphate data reliability, particularly at lower concentration levels, remains difficult at this stage. the same holds true for a realistic quantification of the uncertainties encountered. In more recent deployments of the CFA system, these systematic errors have been lowered by using non-linear calibration curves and by decoupling the automatic valve from the detection unit.
Dating and data reduction
Dating of the core has been based on the identification of well-known historic volcanic layers characterized, among other things, by high sulphate concentrations. Only the very distinct sulphate signals were used: Katmai, Alaska (AD1912); Tambora, Indonesia (AD1815); Laki, Iceland (1783 AD); Huaynaputina, Peru (AD1600); unknown source (AD1259); and Eldgja, Iceland (AD 934) (Fig. 2). on the other hand, annual-layer counting was also possible, due to the high depth resolution of the record, even though the annual snow accumulation is only around 100mm w.e. a–1. A first criterion for setting annual marks is the increase of the calcium signal occurring around spring. In case of ambiguities, the typical winter to early-spring peak of the sodium signal was also used. the dating uncertainty between the reference horizons is estimated to be ±5 years.
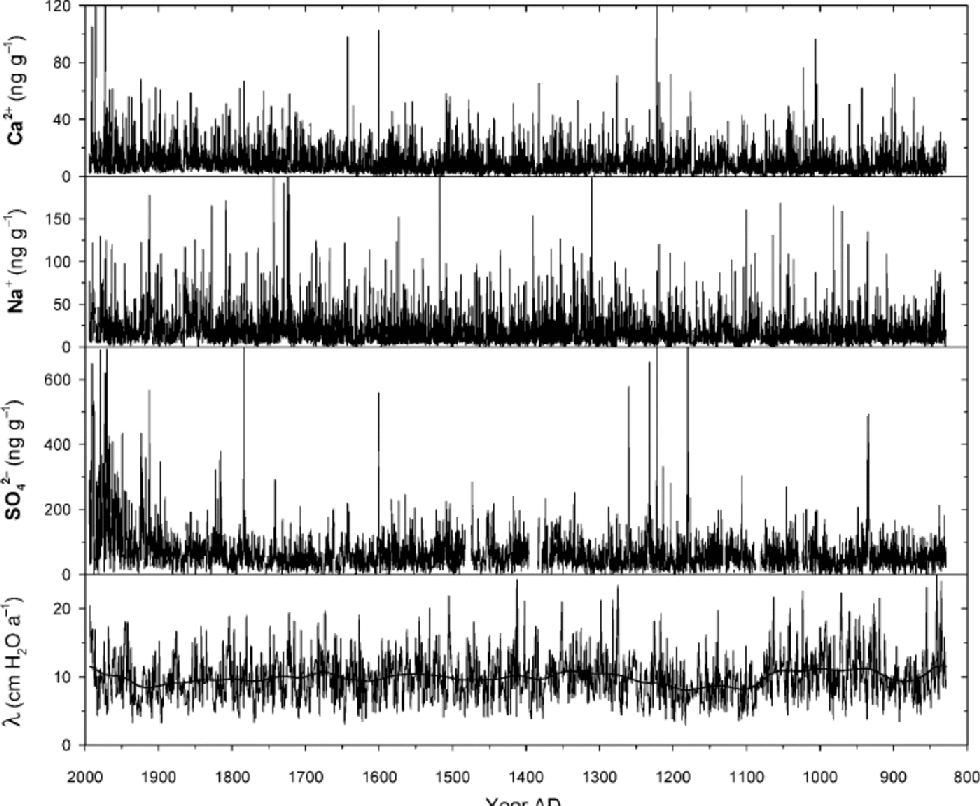
Fig. 2 Rawdata of ion records at (formal) monthly resolution from B20 ice core from northeast Greenland. Annual layer thickness λ has been smoothed by applying a low-pass filter (Gaussian filter with cut-off frequency of 100 years; bold line) to display long-term changes in the snow accumulation rate.
Following Reference Sommer, Wagenbach, Mulvaney and FischerSommer and others (2000), the intervals between two annual marks were divided into 12 equidistant parts for which mean values from the included data points were calculated. In this way, CFA time series at a formal monthly resolution were generated.
Calculation of the sea-salt sulphate fraction by means of the sodium record gave on average a contribution to the total sulphate of only 8% during the pre-industrial epoch (this fraction is even lower in recent times). Here, we report total sulphate concentrations, i.e. without sea-salt correction.
Results and Discussion
Sulphate mean values and seasonal features
Our sulphate CFA record is presented in Figure 2 at monthly resolution over the period from AD 830 to present. Sodium and calcium are also shown, because they are associated with the rather constant sea-salt and crustal sulphate sources. Sulphate shows the well-known anthropogenic increase in the course of the 20th century, and some very strong peaks obviously caused by volcanic deposits. In addition, the snow-accumulation rate as derived from annual-layer counting is shown in Figure 2. the long-term mean annual layer thickness λ is fairly constant at 9.9±3.8 cm w.e. except for an excursion between AD 900 and 1300. A similar deviation can be seen in the accumulation-rate record from the NGT core B18 (Reference SchwagerSchwager, 2000), about 200 km south of B20, but not at other NGT positions.However, the long-term accumulation-rate changes are rather small and, according to the deposition model by Reference Fischer, Wagenbach and KipfstuhlFischer and others (1998a), have only a minor influence on the mean sulphate concentrations (not more than 7%). Other physical characteristics (e.g. elevation and distance from the coast) are negligible for this interior area of Greenland.
For comparisons of our mean sulphate values from the upper part of our core with those observed at Summit and North Greenland, the most prominent volcanic peaks were removed. It turned out that anthropogenic means (1850– 1992) available from adjacent NGT cores (B18: 119 ng g–1; B20: 114 ng g–1; and B21: 114 ng g–1; values for B18 and B21 from Reference Fischer, Wagenbach and KipfstuhlFischer and others, 1998b) are in perfect agreement, confirming that there are no analytical problems at higher concentration levels. A higher value with respect to Summit (67 ng g–1: EUROCORE; personal communication from M. Legrand, 2001) can be fully explained by the difference in accumulation rates (Reference Fischer, Wagenbach and KipfstuhlFischer and others, 1998a). In the pre-industrial era back to AD 1500, however, the B20 mean data appear to be systematically higher by about 20% than those of adjacent NGT cores B18 and B21, even after correction of the small accumulation effect. the remaining systematic overestimation of low background sulphate values is likely to be explained by analytical effects of the CFA sulphate detection method as described above.
To illustrate in more detail the sulphate variability on the multi-annual scale, an expanded view is given in Figure 3, along with calcium (which has served as the main dating component) and the electrolytical conductivity.The sulphate noise level is obviously larger than the calcium one, particularly at lower concentrations. on the other hand, the electrolytical conductivity profile frequently corresponds to the sulphate variability even at lower levels. This indicates a possible overestimation of the detection limit given above as 40 ngg–1. Furthermore the periodically occurring sulphate peaks, found in the range of up to 200 ng g–1 almost every year concurrently with the annual calcium peaks, suggest a persistent reliable seasonal sulphate signal can be detected with CFA. Note that no clear volcanic event was identified in the core section shown in Figure 3.
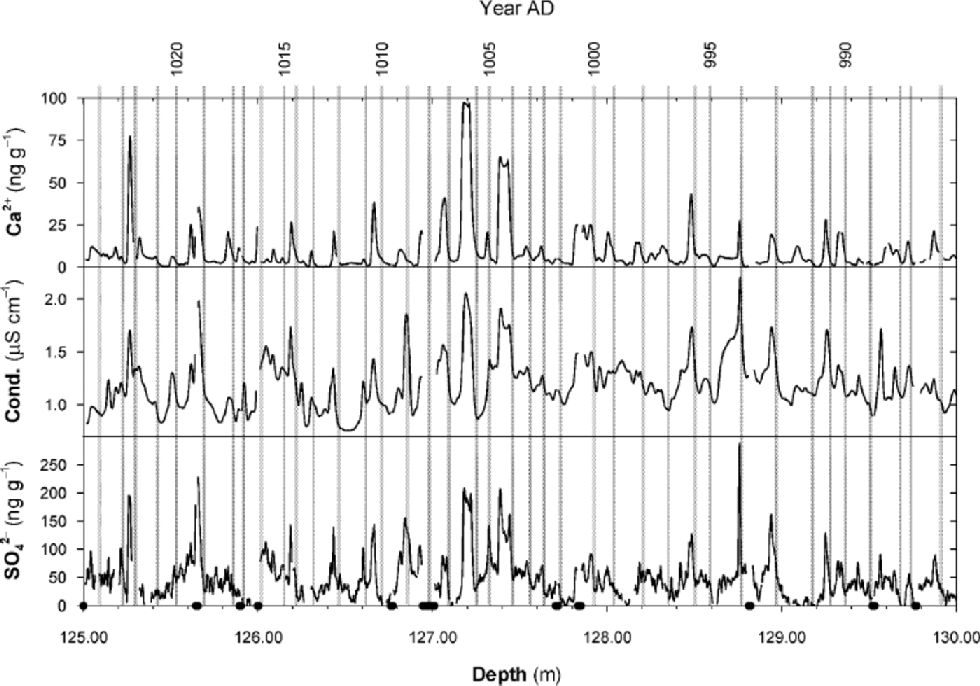
Fig. 3 Expanded view on a B20 core section. Vertical bars indicate annual layering used for dating; dots at the depth scale indicate core breaks.
In order to evaluate the seasonal timing of the sulphate signal, we used our formal monthly values as described above. Because the accumulation distribution in the course of the year is not the same for each year, we stacked the individual months over long pre-industrial and industrial time intervals, respectively, to minimize the uncertainties (for details and accuracy of this method see Reference Sommer, Wagenbach, Mulvaney and FischerSommer and others, 2000). Note, however, that this method cannot account for a systematic seasonal bias in the annual cycle of snow accumulation, so each interval does not truly represent a single month. the adjustment of these formal months to calendar months was accomplished by setting the marks in the increasing calcium flank as February. Figure 4 illustrates mean seasonal cycles of sulphate for the industrial and pre-industrial eras, along with calcium serving as the seasonal reference species. These seasonal cycles are in good agreement with the present state of knowledge. At higher sulphate levels during the industrial era (Fig. 4a), the seasonality is mainly driven by the Arctic haze, leading to a sulphate maximum during spring (Reference Laj, Palais and SigurðssonLaj and others, 1992; Reference Whitlow, Mayewski and DibbWhitlow and others, 1992; Reference Dibb and JaffrezoDibb and Jaffrezo, 1997). At lower sulphate levels in pre-industrial epochs, the extension of this peak towards summer (Fig. 4b) is consistent with the findings of Reference LegrandLegrand and others (1997) reported for a short 11year period around AD 1200, though at much lower time resolution. It appears that the main feature of seasonal cycles can be reliably reproduced, although we may expect the seasonal amplitude to be biased by an analytical systematic overestimation of sulphate minima, particularly during the pre-industrial core section with lower mean values.
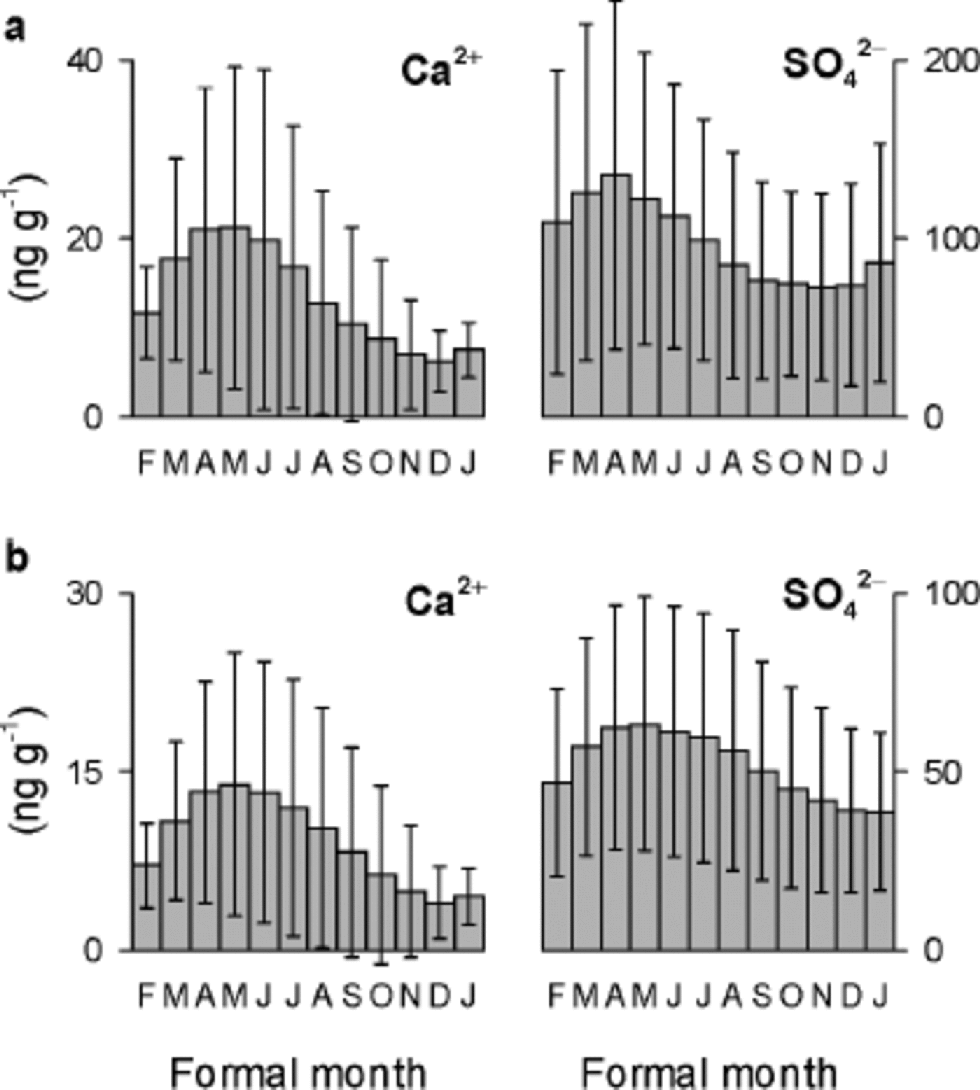
Fig. 4 Mean annual cycles of calcium and sulphate observed in B20 ice core (a) for the industrial era AD 1850–1994, and (b) for the pre-industrial era AD 830–1850. Bars correspond to a 1σ standard error.
We may summarize that systematic effects, particularly at lower sulphate levels, lead to an overestimation of overall mean values. the highly resolved sulphate, however, captures main features such as the typical seasonality quite well. It is not yet known whether weak long-term changes in the pre-industrial era might also be resolved.
Examination of episodic sulphate events
The examination of episodic volcanic events is a straightforward application of a sulphate record at sub-annual resolution. Due to associated high concentration levels, the analytical inaccuracy is of minor importance here. Different types of volcanic events are presented in Figure 5.
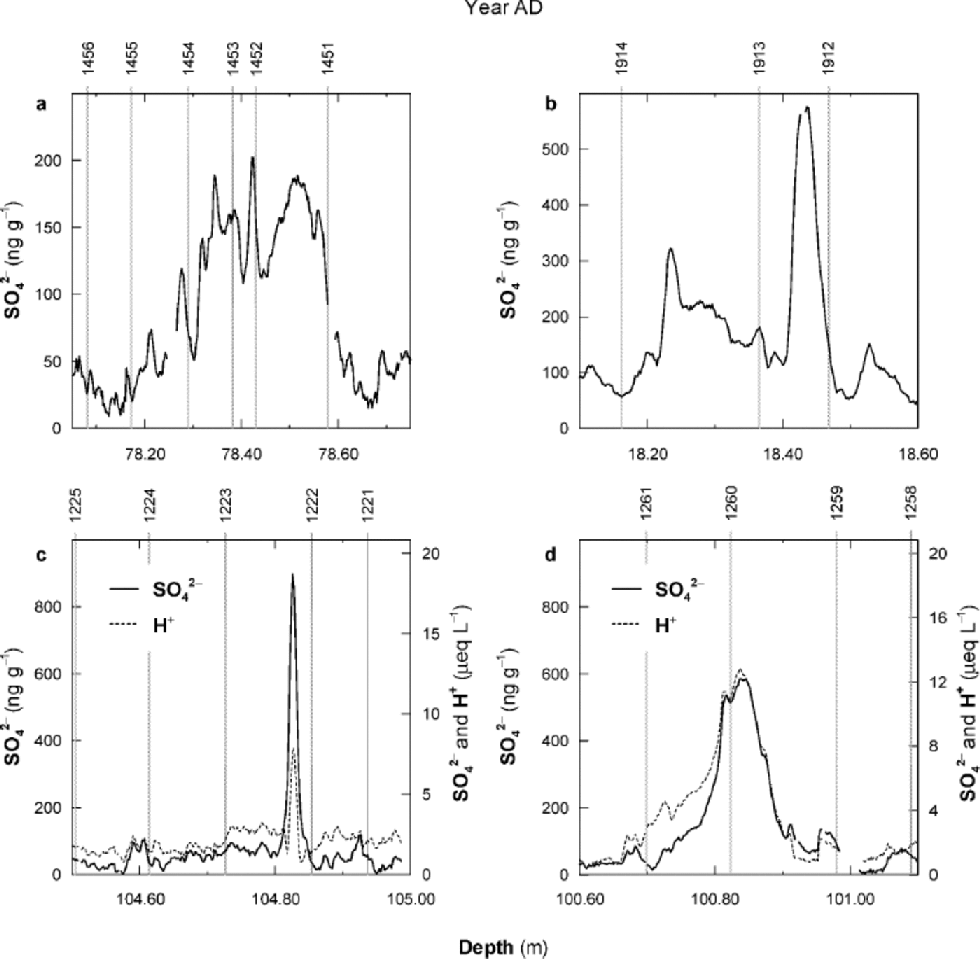
Fig. 5 Examples of distinct sulphate peaks from B20 ice core at sub-seasonal resolution: (a) multi-annual feature possibly from Kuwae (AD1452±10); (b) Katmai (AD1912) possibly followed by Hekla (AD1913); (c) short-pulse feature, possibly from Hekla (AD1222) or Reykjaneshryggur (AD1223); (d) unknown source (AD1259) with bipolar occurrence. the H+ concentration is derived from the ion-balanced CFA components (for explanations see text).
Figure 5a shows abroad peak over several years, probably representing the huge Kuwae eruption (volcanic explosivity index (VEI) 6) which occurred in AD 1452±10 in the south-west Pacific region (Reference Simkin and SiebertSimkin and Siebert, 1994). the typical input from stratospheric material during spring and summer (Reference BeerBeer and others, 1991) shows up for another 3 years after the major event. Following Reference Simkin and SiebertSimkin and Siebert (1994), this event is possibly overlaid by another eruption that occurred in the same time period (Aniakchak, Alaska, VEI 5,1450?).
In Figure 5b the potential of resolved sub-annual structures is demonstrated since two eruptions fit the two peaks appearing in AD 1912 and 1913: Katmai, Alaska (VEI 6, starting on 6 June 1912), and afterwards Hekla, Iceland (VEI 2, starting on 25 April 1913). A Mexican eruption in January 1913 is the only other significant one known in this time period.
A spike of very short sub-annual duration is presented in Figure 5c. Most likely it was produced from the AD 1222 eruption of Hekla or the AD 1223 eruption of the submarine Reykjaneshryggur, Iceland (VEI 2). the short distance to Greenland suggests that the accompanying extraordinary calcium spike reaching 140 ng g–1 might be related to volcanic-ash deposits. Because of the almost identical depth resolution of the other CFA components, concurrent peaks are emphasized. for this purpose the H+ concentration was derived from the ion balance (driven here by the major species sulphate and calcium) of CFA components. Missing Cl–, Mg2+ and K+ contributions were inferred from Na+ assumed to be totally marine and from Ca2+ assumed to be totally crustal-derived. H+ gave a relatively low value for this event (see Fig. 5c) which might not show up in an ECM record (Reference ClausenClausen and others, 1997).
A prominent volcanic event also seen in many other ice cores from Greenland and Antarctica is the eruption of an unknown source in AD 1259±10 (Fig. 5d). Because no outstanding input of calcium occurred at the same time, the estimated H+ profile closely follows the sulphate signal at a micro-equivalent ratio near unity. the high depth resolution not only helps to distinguish more clearly between adjacent events, but also allows accurate calculation of inventories in kg sulphate km–2. We calculated an inventory of a volcanic event as the integral over the sulphate peak minus the prevailing mean background concentration weighted with the particular mean density at this depth. Integral limits are the feet of the volcanic peak where the sulphate concentration values exceed the mean background level. We estimated the inventories of the AD 1259 event and the AD 1912 Katmai eruption to be 41 and 10 kg km–2, respectively, which are noticeably lower values than those from Summit based on ECM records (161 and 15 kg km–2, respectively, for GRIP; Reference ClausenClausen and others, 1997) or on biannual sulphate records (145 and 27 kg km–2, respectively, for GISP2; Reference ZielinskiZielinski, 1995). One reason for this may be better determination of the peak feet, and thus a clearer separation of a volcanic event from the background level, due to a high-resolution sulphate dataset. But the main reason for discrepancies in the inventory values seems to be spatial deposition differences which need to be carefully assessed when, for example, the optical depth of the atmosphere based on ice-core data is calculated.
Refined volcanic chronology
Another application of high-resolution sulphate records leads to a refined volcanic chronology. to explore this possibility, we first compiled a list of possible volcanic ice-core events during the time period AD 1100–1600 according to three different categories (see Fig. 6, lower plot): peaks with non-sea-salt sulphate values of (1) 150–200ng g–1, (2) 200–400ng g–1 and (3)4400 ng g–1. Then we independently picked out from Reference Simkin and SiebertSimkin and Siebert (1994) all listed eruptions with aVEI 55 (including Plinian ones), all Northern Hemispheric eruptions with aVEI of 4, all Icelandic eruptions in view of their geographical proximity, and all unknown sources detected in other ice cores. from this list we eliminated all eruptions showing a dating uncertainty of 4±10 years. Subsequently we assigned our ice- core candidates to the literature-based list. If the assignment was consistent with the maximum dating uncertainty of ±5 years, we marked it in Figure 6 in the upper plot with a vertical line; if the assignment was ambiguous we indicated this with a dashed line. Nearly 60% of our candidates have been assigned, and about 45 % of the events from the literature-based list have been hit. Different assignment qualities showed up for different time periods: a relatively good agreement was found for AD 1150–1400 but a poor one around AD 1500. Noticeable is the 120 year period of more frequent stronger events around AD 1200.
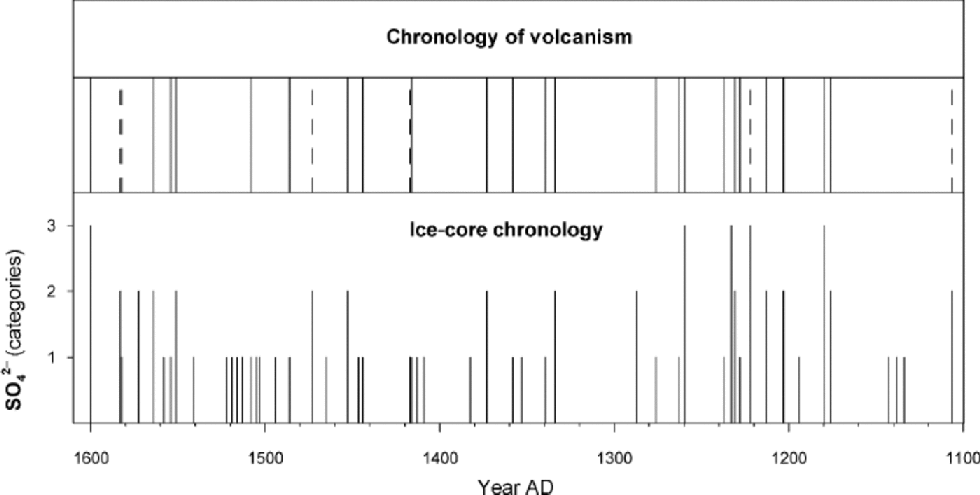
Fig. 6 Comparison of volcanic ice-core events from B20 arranged according to three categories (for details see text) with a chronology of volcanism. Full lines indicate obvious assignments, and dashed lines ambiguous ones.
A high-resolution sulphate record leads to a refined volcanic chronology since even very narrow volcanic spikes can be recognized as the relatively accurately dated Icelandic volcanoes. Compared to ECM profiling, the advantages of direct sulphate analyses are the low risk of interference from concurrent species and the more accurate calibration procedure in terms of volcanic sulphate.
Long-term sulphate changes
To extract long-term sulphate variations from B20 in the pre-industrial era, we looked at strongly smoothed sulphate records over the entire period. We removed strong episodic sulphate peaks in categories 2 and 3 according to the procedure presented above, and calculated annual means which were low-pass filtered afterwards (Gaussian filter with cut-off frequencies of 30 and 100 years, respectively).
For comparison we used the same filter procedures on annually resolved raw data from B21 (Reference Fischer, Wagenbach and KipfstuhlFischer and others, 1998b) in which episodic events have already been removed. Figure 7 shows the long-term variations of both cores: B20 which reaches back to AD 830, and B21 which covers the more recent period starting in AD 1400. the deviation between the two records is comparable to the variability seen within the extended B20 period back to AD 830. We thus conclude that the observed long-term changes over the first half of the last millennium may not be significant with respect to the stated analytical precision of the CFA sulphate method, nor to the typical glacio-meteorological noise demonstrated by Reference Fischer, Wagenbach and KipfstuhlFischer and others (1998b) for ice-core records in the NGTarea. Note that this assessment holds true for the background sulphate record only where we eliminated volcanic events in advance of low-pass filtering. As in the previous section (see Fig. 6), we noticed a 120 year period around AD 1200 with frequent strong sulphate peaks mainly identified as volcanic horizons. This suggests higher atmospheric sulphate loads during this period, though they are a highly episodic feature.
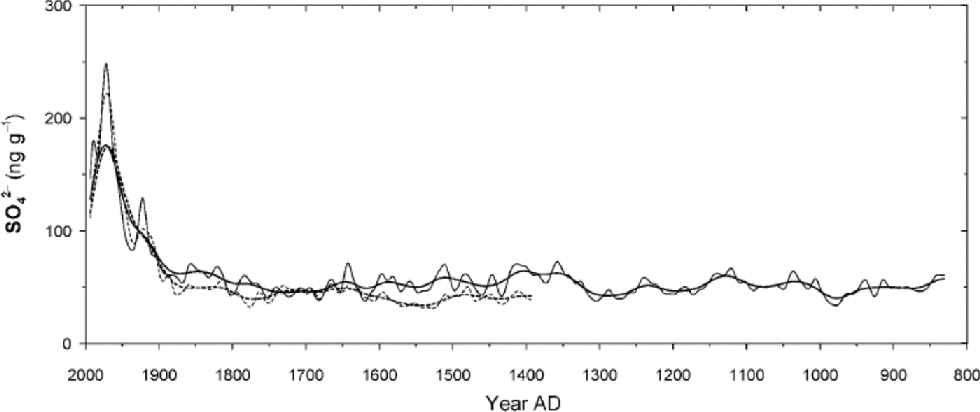
Fig. 7 Low-pass filtered sulphate records from B20 (solid lines) and from B21 (dashed lines). Bold lines correspond to 100 year, thin lines to 30 year cut-off frequencies of the Gaussian filter.
Acknowledgements
The ice core was recovered by the Alfred Wegener Institute (AWI), Bremerhaven, Germany, in the frame of the NGT project. the analyses have been supported by the Swiss National Science Foundation, the Bundesamt für Bildung undWissenschaft and the University of Bern. We thank B. Mieding (AWI, Bremerhaven) and M. Legran. (Laboratoire de Glaciologie et Géophysique de l’Environnement,Grenoble, France) for providing data.


