Introduction
It has been reported that the glaciers in the Asian highlands have contributed to the recent sea-level rise, accounting for as much as 20% of the water volume transferred from world glacier wastage (Reference MeierMeier, 1984; United States Department of Energy, 1985). This estimation, however, was based on few observations and many assumptions, because the information on this region has been quite limited. Almost all glaciers on the Tibetan Plateau are strongly affected by monsoons, and they are simultaneously accumulated and ablated in summer. Glaciers on the plateau have been categorized into two types (Reference Shi and LiShi and Li, 1981; Reference HuangHuang, 1990): the continental type with little precipitation and a low ice temperature, and the maritime type with high monsoon precipitation and a temperate inside. The continental-type glaciers are distributed widely from the central to northwestern semi-arid region, while the maritime-type glaciers are limited to the southeastern humid region. Although glaciological and meteorological data are needed for model studies, which are preferable in order to clarify the characteristics of glacier mass balance on the plateau, observational data for continental-type glaciers are quite limited (e.g. Reference Ageta, Wenjing and NakawoAgeta and others, 1989,Reference Ageta1991; Reference Pu and TandongPu and Yao, 1994). Mass-balance data for 5.5 years, which are the first continuous observational data for a glacier on the Tibetan Plateau, were obtained for a glacier on the central plateau. The variation in mass balance is discussed with meteorological variables in this paper.
Locations and Observations
The present study was made in the Tanggula mountains (33° N, 92° E) on the central Tibetan Plateau (Fig. 1). Xiao Dongkemadi glacier (Fig. 2) was observed as a representative glacier in the mountains under a semi-arid continental climate. The terminus, highest altitude, length and area of the glacier are 5380 m, 5926 m, 2.8 km and 1.8 km2, respectively Automatic snow-depth gauges using photo diode or glass fiber were installed at 5600 ma.s.l. near the equilibrium-line altitude (ELA). Twenty-seven stakes were installed to measure specific mass balances and surface flow velocities at different altitudes (Fig. 2). The stake height and snow layer thickness were surveyed once or twice a year by manual observation to obtain specific mass balance. Since it was reported that the formation of superimposed ice was important for glacier mass balance (Reference Ageta and FujitaAgeta and Fujita, 1996; Reference Fujita, Seko, Ageta, Jianchen and TandongFujita and others, 1996), the level of the interface between snow and ice (ice surface) was also surveyed by pit observation. An automatic weather station (AWS) was installed and operated at 5600 m a.s.l. from September 1991 to May 1994 (Reference Ohata, Ueno, Endoh and YinshengOhata and others, 1994; Reference Seko, Pujianchen, Ageta, Ohata and TandongSeko and others, 1994).
Fig. 1. Map of the Tanggula mountains. TG denotes the study area including the Dongkemadi glaciers.
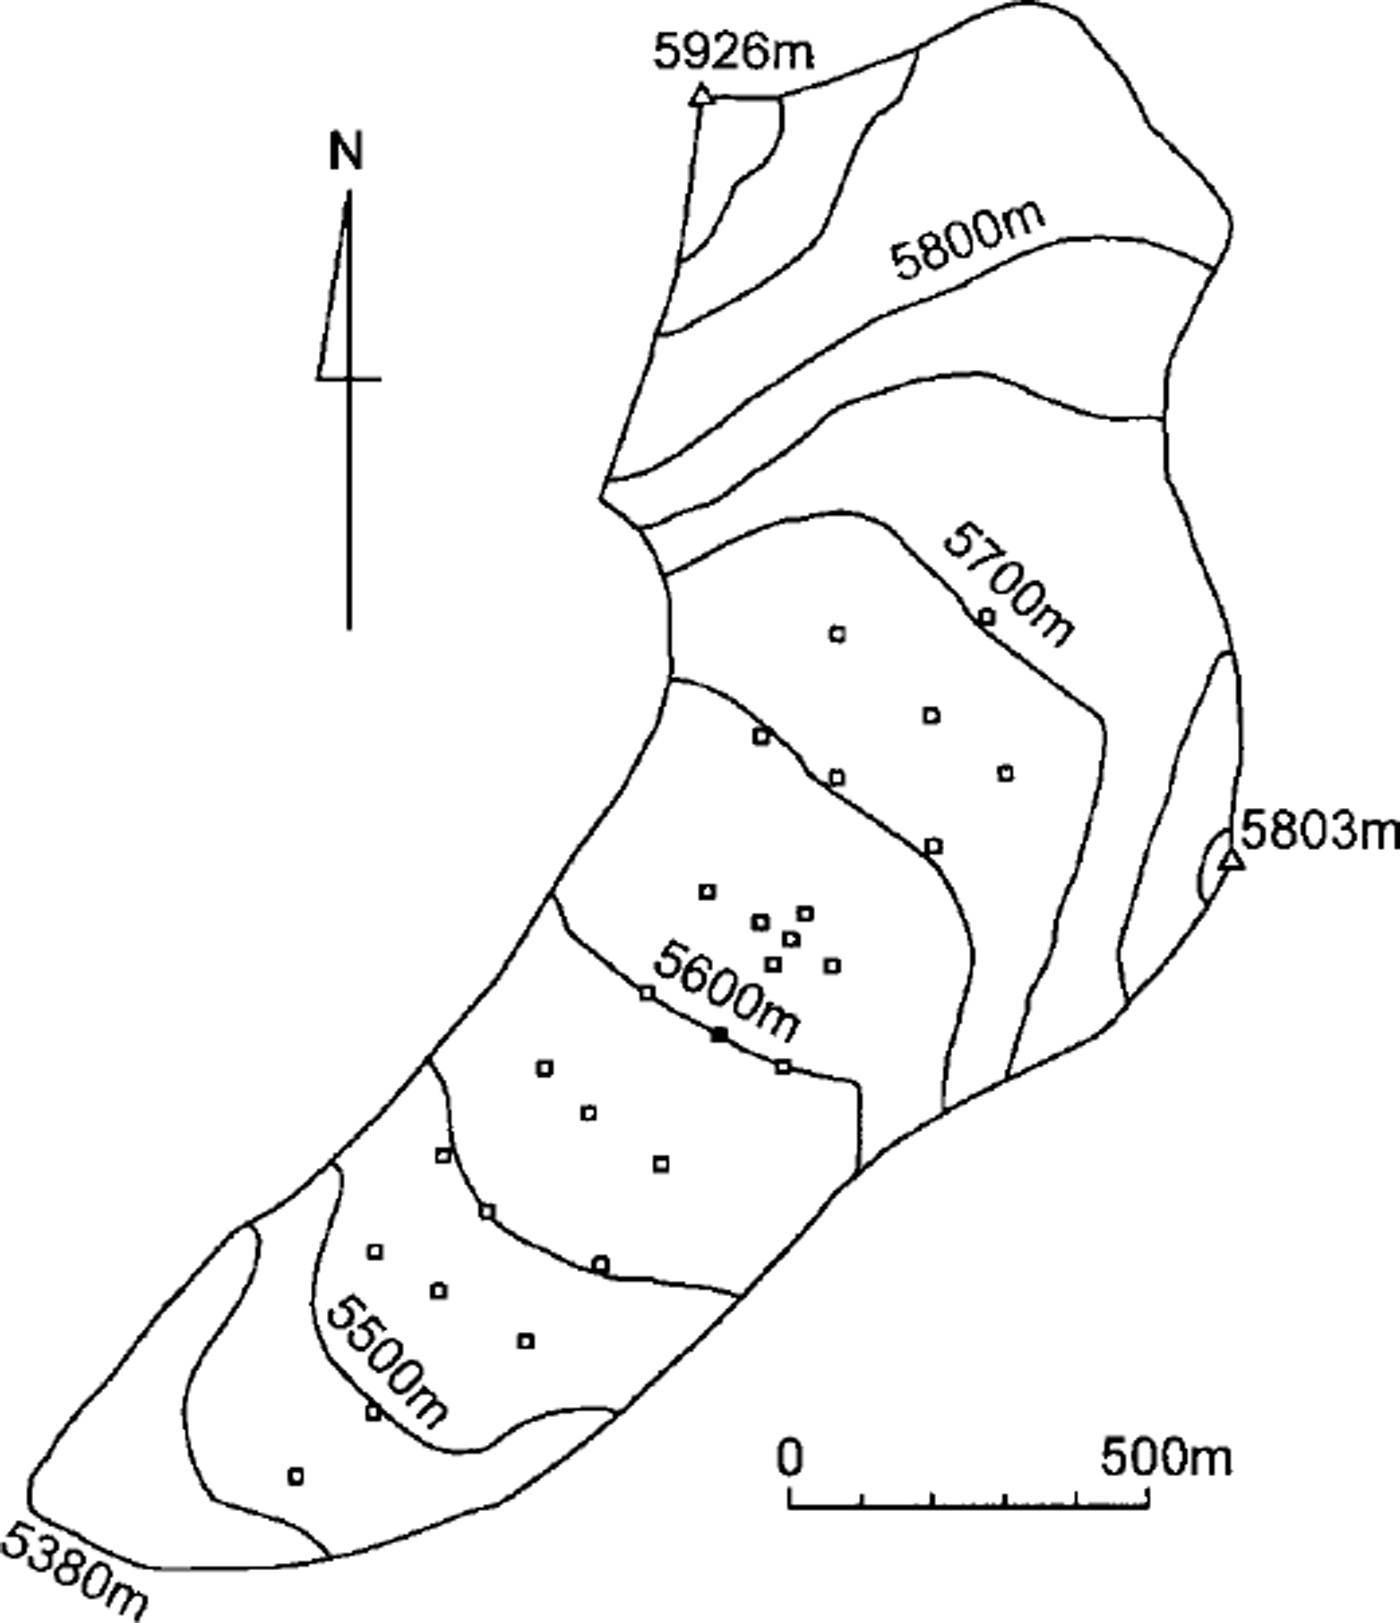
Fig. 2. Location of stakes (squares) on Xiao Dongkemadi glacier. The solid square at 5600 m a.s.l. denotes the site where the AWS and surface-level gauge were installed.
Mass Balance, 1989–95
Changes in the levels of surface and ice surface were recorded at 5600 m a.s.l. from May 1989 onwards as shown in Figure 3. Changes in surface level showed large fluctuations during summer, while occasional small rising and lowering appeared during winter. These imply that the monsoon supplies precipitation, and that accumulation and ablation occur simultaneously on the glacier (Reference Ageta and HiguchiAgeta and Higuchi, 1984). The figure also shows the rise of the ice surface during summer seasons, which was caused by the growth of superimposed ice. The key role of superimposed ice in the mass balance of this glacier was described in detail by Reference Fujita, Seko, Ageta, Jianchen and TandongFujita and others (1996).

Fig. 3. Relative levels of surface (cross and line) and ice surface (solid triangle) at 5600 m a.s.l. on Xiao Dongkemadi glacier.
Levels of surface and ice surface at other sites have been observed once or twice a year by means of manned stake measurements and pits. Specific mass balance (mass balance at a given site), b (mm we.), during a given period is obtained from:
where AS and AI are the changes in snow thickness and ice-surface level in meters during a given period, ρs and Pi are the densities of snow/firn (averaged density of the snow layer 370 kg m–3) and ice (870 kg m–3). Altitudinal distributions of seasonal specific mass balance (mass-balance profile) are shown in Figure 4. The figure clearly shows that the gradients of mass balance vs altitude are considerably smaller in winter (September/October to May/June) than in summer (May/June to September/October). Small fluctuations in mass balance in winter and the positive specific mass balances at higher altitude in the summers of 1992 and 1993 also support the contention that the glacier is accumulated by summer monsoons. A drastic melt was observed from May to June in spring 1995, which is considered to have been caused by low surface albedo due to dust deposition even under low-air-temperature conditions. Annual mass-balance profiles (autumn to autumn, Fig. 5) show that the mass-balance gradients in the ablation zone (ablation gradient; Reference HaefeliHaefeli, 1962) in the years of negative balance for the whole glacier area (1990/91 and 1993/94; 5–6 mm we. m–1) are larger than those in the years of positive balance (1991/ 92 and 1992/93; 3–4 mm we. m–1 . In the negative mass-balance years, higher air temperatures would cause a decrease in accumulation due to rainfall, lowering of surface albedo and then drastic increase of melt at lower altitudes. In the positive mass-balance years, on the other hand, lower air temperature would increase the likelihood of snowfall, high surface albedo and then prevention of melt even at lower altitudes. A steeper gradient in the negative mass-balance years, therefore, would result from such an accelerated melting process due to the summer monsoon.

Fig. 4. Seasonal mass-balance profile of Xiao Dongkemadi glacier, 1991–95. Sumner (S) and winter (W) are the periods from May/June to September/October and from September/October to May/June in the following year, respectively. The dashed line denotes the approximated mass-balance profile.
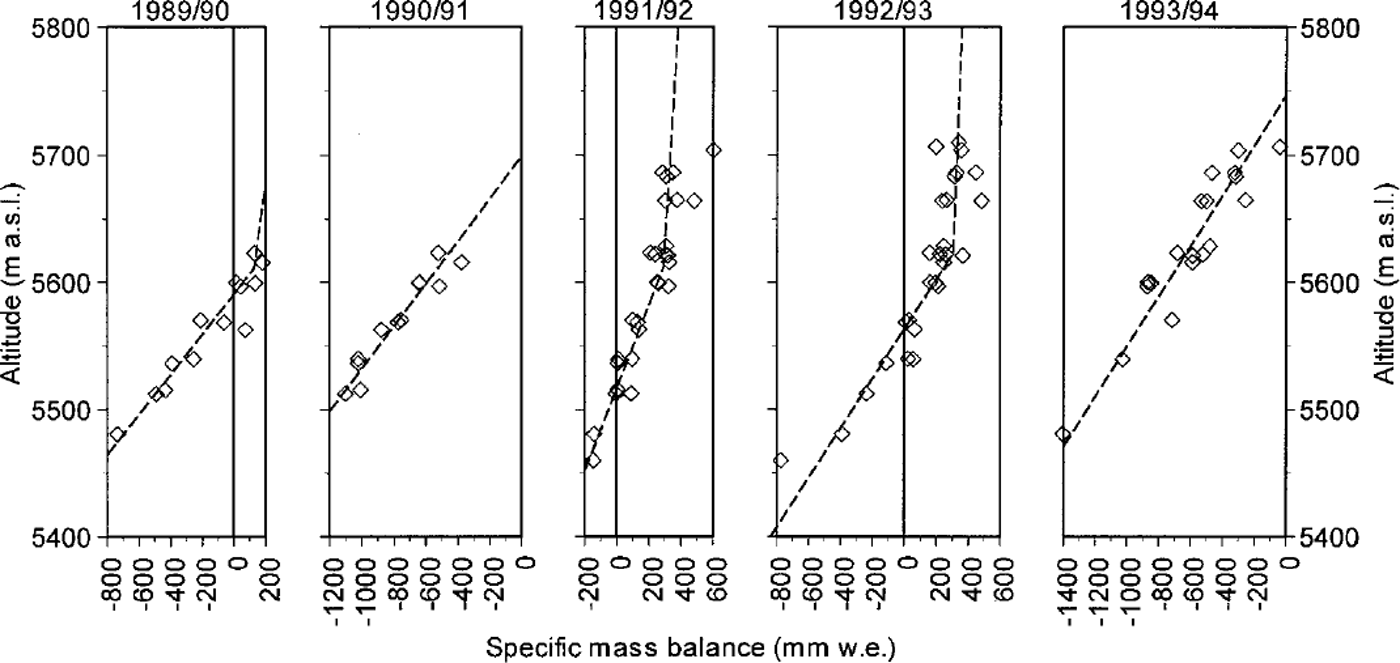
Fig. 5. Annual mass-balance profile (autumn to autumn) of Xiao Dongkemadi glacier, 1989–94. The dashed line denotes the approximated mass-balance profile.
The average mass balance b for each observation period is calculated using an approximated specific mass balance for 50 m altitude spans and the areal distribution of the glacier zone as:
where Az and bz are an area (m2) and a specific mass balance (mm we.) at a given altitude of z at an interval of 50 m, and AT is the whole area of the glacier (1.8 × 10⁶ m2). Relations between mass balance and altitude are approximated for each observation period as shown by the dashed lines in Figures 4 and 5. It is assumed that an approximated specific mass balance does not exceed 500 mm we. based on specific mass balances obtained at 5700 m a.s.l. The averaged seasonal and annual mass balances are shown in Figure 6a.
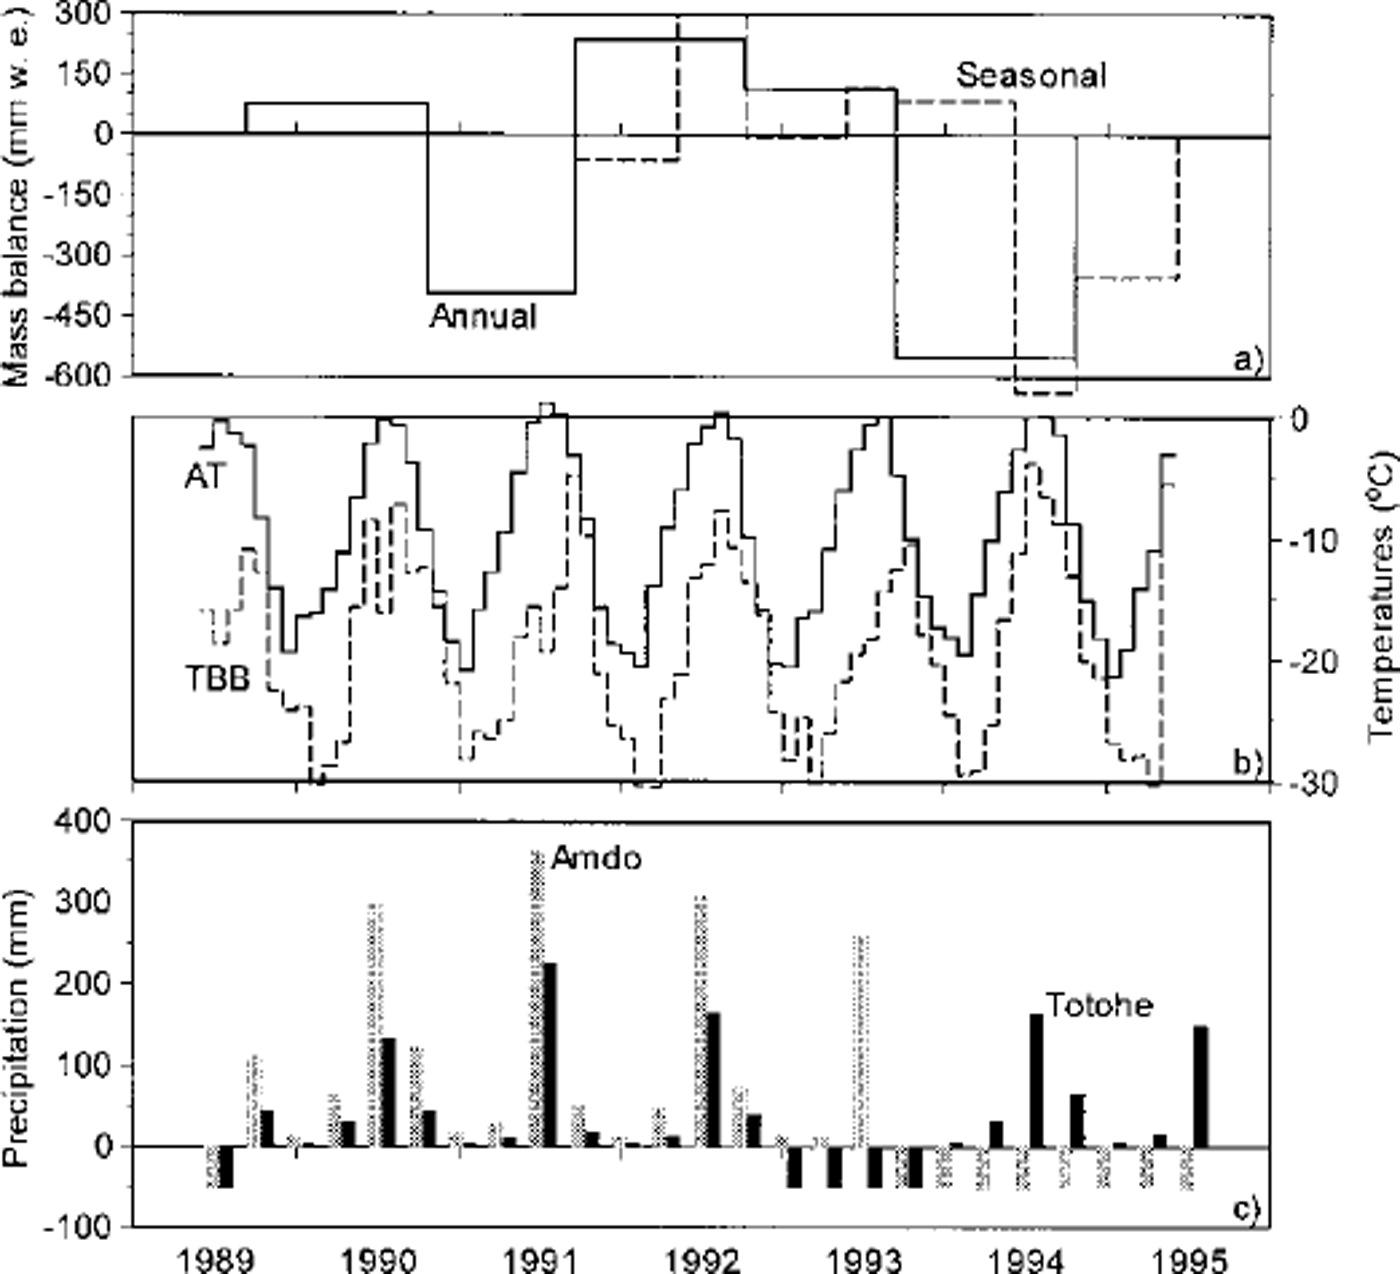
Fig. 6. (a) Fluctuations in annual (solid line) and seasonal (dashed line) averaged mass balance for the whole area of Xiao Dongkemadi glacier, (b) Fluctuations in monthly mean air temperature estimated at 5600 m a.s.l. on Xiao Dongkemadi glacier (AT; solid line) and monthly mean black-body temperature for the area including Xiao Dongkemadi glacier (33–34° N, 92–93° E; 1° × 1°; TBB; dashed line), (c) Three-month precipitation amount obtained at the Amdo (gray bars) and Totohe (solid bars) stations shown in Figure 1. Negative values denote data not available.
Meteorological Conditions, 1989–95
In order to evaluate the relationship between the glacier mass balance and meteorological parameters, air temperature, black-body temperature at the area including the glacier observed by a satellite, and the precipitation amount measured at neighbor stations are compared with seasonal and annual mass balances of the glacier. Monthly mean air temperature at 5600ma.s.l. is estimated for the whole period from the data of neighbor stations (Reference Ohta and AgetaOhta and Ageta, 1996). Precipitation on the plateau is one of the most unknown and most necessary items of information with respect to glacier mass balance. Black-body temperature is calculated from infrared radiation observed by the Japanese Geostationary Meteorological Satellite (GMS/IR). Since the black-body temperature is determined by remote sensing from a satellite, it is expected to be related to the height and amount of clouds. The black-body temperature is close to the surface temperature in clear-sky conditions. Reduced solar radiation and a higher possibility of precipitation are expected with lower black-body temperatures, while higher black-body temperatures indicate reduced cloudiness and thus increased solar radiation and decreased precipitation. Although the blackbody temperature in winter is quite low (the minimum monthly mean is –30°C), this does not imply high cloud amounts, but rather low surface temperatures, since according to a comparison of measurements with extraterrestrial radiation, high atmospheric transparency prevails in winter (Reference Seko, Pujianchen, Ageta, Ohata and TandongSeko and others, 1994). Several case studies have been done to clarify the relationship between black-body temperature and precipitation (e.g. Reference Arkin and ArdanuyArkin and Ardanuy, 1989; Reference Xie and ArkinXie and Arkin, 1996, Reference Xie and Arkin1997; Reference UenoUeno, 1998), but this relation could not be verified from black-body temperatures in this study.
Monthly mean air temperature estimated at 5600 ma.s.l. on the glacier, monthly mean black-body temperature in the area including the glacier (33–34° N, 92–93° E; l ° × 1°) calculated from the dataset of GMS/ IR, and 3 month precipitation at Amdo and Totohe (Fig. 1) are compared with the glacier mass balance (Fig. 6). In summer 1991, higher air temperature caused less accumulation due to rainfall, lower surface albedo and then higher melt, even though the amount of precipitation was high. Although air temperature and the amount of precipitation in summer 1994 were similar to levels in the summers of positive mass balance (1990, 1992 and 1993), the mass balance in summer 1994 was negative. It is considered that the negative mass balance in summer 1994 was caused by strong solar radiation, which was deduced from higher black-body temperature in July and August 1994 than in the summers of other years (Fig. 6b) since solar radiation is dominant in the heat balance on glaciers located at low latitudes (Reference Zhang, Yao, Xie and FujitaZhang and others, 1996). The activity of clouds in summer, therefore, should affect the glacier mass balance with respect to not only the accumulation, but also solar radiation and the resulting ablation.
Figure 7 shows the relationships between maximum monthly mean air temperature, maximum monthly mean black-body temperature and areal averaged annual mass balance of the glacier from 1989/90 to 1993/94. The figure shows a lesser relation between air temperature and mass balance. Although warmer conditions may bring about a drastic melt as in 1991, colder conditions do not always bring about a more positive mass balance. A negative mass balance can appear even under cold conditions, as in 1994. The figure shows, on the other hand, that the mass balance decreases with increases in black-body temperature since solar radiation is a dominant factor in heat balance on the glacier. Lower black-body temperature, however, does not always bring about a larger positive mass balance. This suggests that lower black-body temperatures in summer do not simply imply larger amounts of precipitation.
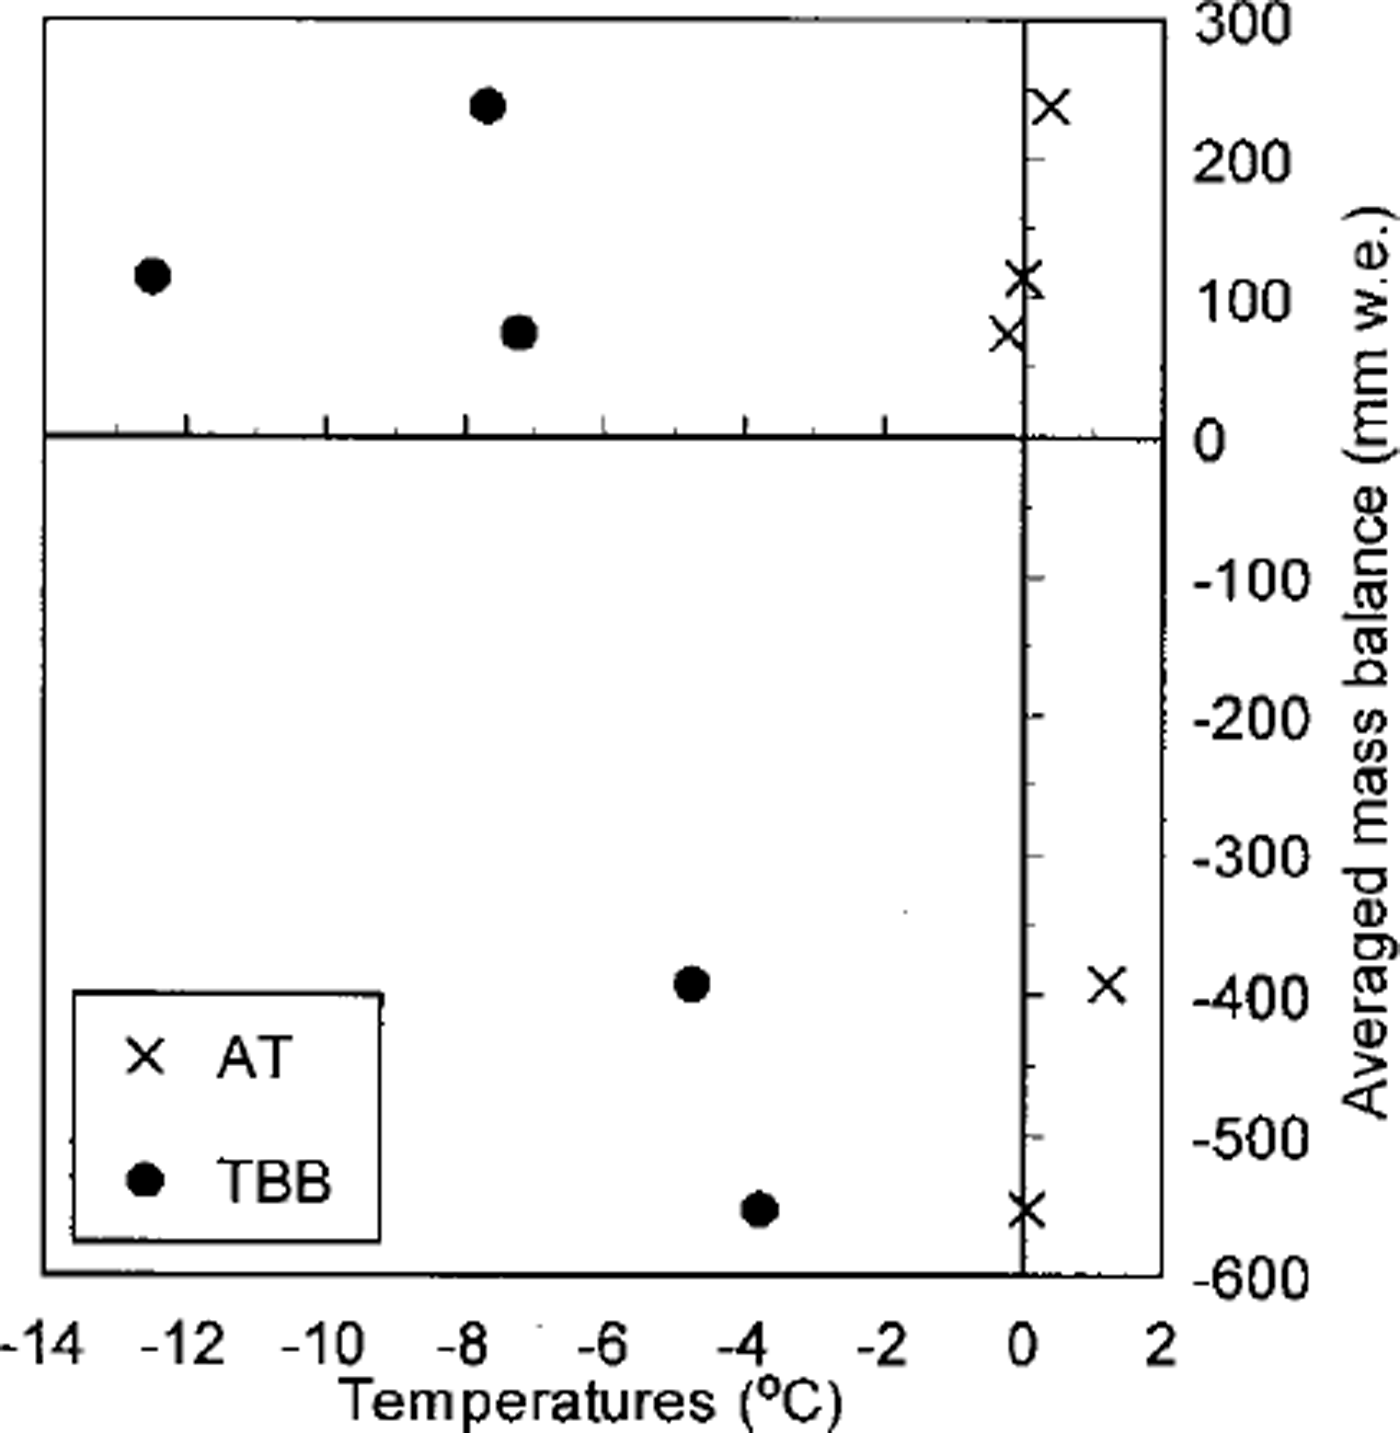
Fig. 7. Maximum values of monthly mean air temperature (cross) and monthly mean black-body temperature (circle) vs areal averaged annual mass balance of Xiao Dongkemadi glacier, 1989/90 to 1993/94.
Concluding Remarks
Mass-balance data for 5.5 years, which are the first continuous observational data for a glacier on the Tibetan Plateau, were obtained at Xiao Dongkemadi glacier on the central plateau from 1989 to 1995. The seasonal mass-balance profiles and variations in surface level show that accumulation and ablation occurred simultaneously in summers on the glacier. Summer accumulation affects the difference in annual mass-balance gradients in both negative and positive mass-balance years, since the surface conditions are drastically changed according to the air temperature, the phase of precipitation and surface albedo. The relation between air temperature and mass balance shows that warmer conditions may cause drastic melting,but that colder conditions do not always bring about a positive mass balance. The relation between blackbody temperature and mass balance shows, on the other hand, that the mass balance decreases with increases in black-body temperature because solar radiation is the main heat source in the heat balance on the glacier. Lower blackbody temperature, however, does not always bring about a larger positive mass balance. Since measurement/monitoring of precipitation on the plateau is a very difficult problem, accurate estimates of precipitation amounts around the glacier from other available variables are required for further mass-balance studies on the plateau.
Acknowledgements
This study is based on the data obtained by the research programs, Cryosphere Research Expedition in Qingzang Plateau (CREQ; 1988–93) and Cryosphere Research Expedition in the Himalayas (CREH, 1994 and 1995). We are very grateful to all members of CREQ and CREH for their valuable advice as well as logistic support during the observations. The dataset of GMS/IR was compiled and provided by N. Yamazaki, Meteorological Research Institute, Tsukuba, Japan. We thank M. Kuhn of Universität Innsbruck and an anonymous reviewer for their suggestions for revision of this paper. Financial support came from a Grant-in-Aid for the International Scientific Research Program (Nos. 03041038, 06041051 and 09490018) and International Geosphere-Biosphere Programme Scientific Research, both from the Ministry of Education, Science, Sports and Culture, Japanese Government, and Cooperative Research under theJapan-US Cooperative Science Program from the Japan Society for the Promotion of Science.


