1. Introduction
Turbidity currents (TCs) are multiphase flows driven by the horizontal pressure gradient which is induced by the suspended load (Meiburg, Radhakrishnan & Nasr-Azadani Reference Meiburg, Radhakrishnan and Nasr-Azadani2015) and is usually a complex polydisperse particulate flow. These flows, natural or human-triggered events, occur everywhere in rivers, estuaries and submarine environments, and they have an important impact on the safety and stability of underwater buildings (Middleton Reference Middleton1993; Simpson Reference Simpson1999; Meiburg & Kneller Reference Meiburg and Kneller2010; Delannay et al. Reference Delannay, Valance, Mangeney, Roche and Richard2017; Liu & Zhang Reference Liu and Zhang2019). The upper interface of the TC experiences entrainment and detrainment with the ambient fluid during propagation, while the lower interface of the TC interacts strongly with the bed materials regarding erosion and deposition (Ismail, Viparelli & Imran Reference Ismail, Viparelli and Imran2016). Due to the polydispersity of the mud, segregation has a non-negligible impact on the intensity and spatial range of the TC, and there is an increasing focus on understanding the characteristics and physical evolution of this phenomenon within the TC (Gladstone & Woods Reference Gladstone and Woods2000; Dellino et al. Reference Dellino, Mele, Sulpizio, La Volpe and Braia2008; Berzi, Jenkins & Larcher Reference Berzi, Jenkins and Larcher2010; Sulpizio et al. Reference Sulpizio, Dellino, Doronzo and Sarocchi2014).
To unequivocally show the evidence of multigrain/polydisperse TC evolution, direct real-time observation in the field is indeed effective (Xu, Noble & Rosenfeld Reference Xu, Noble and Rosenfeld2004; Arai et al. Reference Arai, Naruse, Miura, Kawamura, Hino, Ito, Inazu, Yokokawa, Izumi and Murayama2013; Xu, Sequeiros & Noble Reference Xu, Sequeiros and Noble2014). Due to the high intensity and destructive nature of the current, it is, however, very difficult and costly to employ in-situ measurement in the field (Meiburg et al. Reference Meiburg, Radhakrishnan and Nasr-Azadani2015; Talling et al. Reference Talling, Allin, Armitage, Arnott, Cartigny, Clare, Felletti, Covault, Girardclos and Hansen2015). More field studies preferred to analyse past TC processes according to the sedimentary structures of turbidites (Jiang et al. Reference Jiang, Zhang, Tang, Zhang, Zuo, Lin, Wang, Sun and Wang2014; Bell et al. Reference Bell, Kane, Pontén, Flint, Hodgson and Barrett2018; Hussain et al. Reference Hussain, Haughton, Shannon, Turner, Pierce, Obradors-Latre, Barker and Martinsen2020) rather than measure fluid velocity and spatial distribution of concentration in the flow. These field studies have evidently exhibited that there are differences in both spatial and temporal distribution for particles with different diameters during the deposition and propagation process in nature. However, it cannot be ignored that the method of field study is bound to be affected by many uncontrollable factors and the lack of comprehensive information.
To fully characterize the process and mechanism within a multigrain TC system, laboratory experiments (Gladstone, Phillips & Sparks Reference Gladstone, Phillips and Sparks1998; Baas et al. Reference Baas, McCaffrey, Haughton and Choux2005; Ezz, Cantelli & Imran Reference Ezz, Cantelli and Imran2013; Ismail et al. Reference Ismail, Viparelli and Imran2016; de Leeuw, Eggenhuisen & Cartigny Reference de Leeuw, Eggenhuisen and Cartigny2018; Pohl et al. Reference Pohl, Eggenhuisen, Tilston and Cartigny2019, Reference Pohl, Eggenhuisen, Cartigny, Tilston, de Leeuw and Hermidas2020; Soler et al. Reference Soler, Colomer, Folkard and Serra2020) and numerical simulations (Salaheldin et al. Reference Salaheldin, Imran, Chaudhry and Reed2000; Huang, Imran & Pirmez Reference Huang, Imran and Pirmez2007, Reference Huang, Imran and Pirmez2008; Abd El-Gawad et al. Reference Abd El-Gawad, Cantelli, Pirmez, Minisini, Sylvester and Imran2012; Ezz & Imran Reference Ezz and Imran2014) were employed to provide convenience for comprehensively monitoring the morphological evolution and current characteristics. In the streamwise direction, both experimental studies (Kubo Reference Kubo2004; Felix, Sturton & Peakall Reference Felix, Sturton and Peakall2005; Alexander et al. Reference Alexander, McLelland, Gray, Vincent, Leeder and Ellett2008) and numerical simulation researches (Steenhauer, Tokyay & Constantinescu Reference Steenhauer, Tokyay and Constantinescu2017; Lee Reference Lee2019; Ouillon, Meiburg & Sutherland Reference Ouillon, Meiburg and Sutherland2019) visualized that the highest concentration is at the head during the current evolution. Experimental work by Gladstone et al. (Reference Gladstone, Phillips and Sparks1998) showed that an increase in the proportion of fine particles in the current enhanced the mobility and the capacity of flow to transport sediment, with a substantial increase in the distance to which coarse particles were transported. This conclusion was validated by the non-uniform sediment numerical model of Salaheldin et al. (Reference Salaheldin, Imran, Chaudhry and Reed2000). Numerous studies have demonstrated that the particle size of sediments decreases along the route (Sequeiros et al. Reference Sequeiros, Naruse, Endo, Garcia and Parker2009; Abd El-Gawad et al. Reference Abd El-Gawad, Cantelli, Pirmez, Minisini, Sylvester and Imran2012; Huang, Imran & Pirmez Reference Huang, Imran and Pirmez2012). This is due to the fact that the smaller the particle size, the easier it is for the particles to remain in suspension and thus be able to be transported farther. In the upward direction, the particle distribution is generally considered to be controlled by the ratio of the particle settling velocity to the upward component of turbulent velocity (Baas et al. Reference Baas, McCaffrey, Haughton and Choux2005; Alexander et al. Reference Alexander, McLelland, Gray, Vincent, Leeder and Ellett2008; Shringarpure, Cantero & Balachandar Reference Shringarpure, Cantero and Balachandar2012). Garcia & Parker (Reference Garcia and Parker1993) and McCaffrey et al. (Reference McCaffrey, Choux, Baas and Haughton2003) mentioned that on the current body, the turbulent velocity was not sufficient to counteract the particle settling velocity, and consequently the concentration of suspended particles presented an upward decrease, which meant the body was well stratified in the vertical direction in terms of concentration. While at the current head, due to the strong fluid fluctuations, also considered as high current intensity, the particle settling velocity is less than the turbulent velocity. This allows a uniform distribution for fine particles in the vertical direction, with the exception of coarse particles that are mainly in the lower region. In multigrain TC, the presence of a small amount of fine particles will result in a reduction in the settling velocity of the coarse particles (Salaheldin et al. Reference Salaheldin, Imran, Chaudhry and Reed2000).
The evolution regimes of multigrain turbidity flows involve not only fluid–particle interactions but also particle–particle interactions (Meiburg et al. Reference Meiburg, Radhakrishnan and Nasr-Azadani2015), especially the more complex collision processes of particles with different particle sizes. Experiments can realistically depict TC evolution processes, but lack an accurate description of particle collision processes. Two-phase Eulerian–Eulerian models fully consider fluid–particle interactions and particle–particle interactions based on the proposed quasisingle-phase model (Lee Reference Lee2019; Meng et al. Reference Meng, Liao, Yu, Li and An2021) and are applicable to large and laboratory scales. Such models for the rheological description of collision processes are often established under the constitutive law of intergranular stresses (Chauchat Reference Chauchat2018), and have limitations for small-scale collision resolution and individual particle tracking. This is one of the critical keys for further understanding the evolution of TCs, and for this reason, Eulerian–Lagrangian models have been applied to investigate TCs in recent years (Biegert et al. Reference Biegert, Vowinckel, Ouillon and Meiburg2017; Xie et al. Reference Xie, Hu, Pähtz, He and Cheng2022). For multigrain particle flows, such models can also exhibit good simulation performance (Sun & Xiao Reference Sun and Xiao2016; Pähtz & Durán Reference Pähtz and Durán2020), especially near the bed where particle–particle interaction prevails.
Although practically all real systems feature polydisperse particles, particle collisions are binary for dilute particle flows (Grabowski & Wang Reference Grabowski and Wang2013). In this way, the problem of polydispersity can be simplified to the effect of bidispersity on the evolution of TC, which is the focus of this work. This study aims to improve the understanding of the fluid–particle interactions of transported particles with different particle sizes and particle–particle interaction during the bidisperse TC evolution. We study the bidisperse TCs by a computational fluid dynamics–discrete element method (CFD-DEM) model, which incorporates the benefits of both Eulerian and Lagrangian models into account, with a fast solution for the fluid phase and an accurate tracking of discrete particles. We employed the large-eddy simulation (LES) to simulate the TC in this study and we have previously confirmed its applicability in our previous studies (Xie et al. Reference Xie, Hu, Pähtz, He and Cheng2022, Reference Xie, Hu, Zhu, Yu and Pähtz2023). The main reason is that LES produces more accurate flow results than Reynolds-averaged Navier–Stokes simulations and has higher computational efficiency than direct numerical simulations (Meiburg et al. Reference Meiburg, Radhakrishnan and Nasr-Azadani2015).
We explore the bidisperse TC dynamics in a lock-exchange approach. In the lock-exchange TC evolution, it has been observed that the fluid containing particles propagates forward in the lower layers and the upper layers’ ambient fluid moves in the opposite direction into the lock. The backward-propagating disturbance reflects of the back wall and begins to propagate forward (Cantero et al. Reference Cantero, Lee, Balachandar and Garcia2007). The lock-exchange TCs can be divided into several stages and previous studies have extensively investigated the duration, front velocity and other characteristics of each regime (Huppert & Simpson Reference Huppert and Simpson1980; Necker et al. Reference Necker, Härtel, Kleiser and Meiburg2002; Shin, Dalziel & Linden Reference Shin, Dalziel and Linden2004; Cantero et al. Reference Cantero, Lee, Balachandar and Garcia2007) as follows. (A) An initial acceleration stage characterized by a rapid increase in the front velocity, reaching a maximum, followed by a slightly decrease before approaching a constant velocity. The acceleration stage has typically been observed to have a duration of approximately 4 dimensionless time (Cantero et al. Reference Cantero, Lee, Balachandar and Garcia2007; He et al. Reference He, Zhao, Hu, Yu and Lin2018), with a dimensionless maximum front velocity of approximately 0.5 (Gladstone et al. Reference Gladstone, Phillips and Sparks1998; Cantero et al. Reference Cantero, Lee, Balachandar and Garcia2007; Steenhauer et al. Reference Steenhauer, Tokyay and Constantinescu2017). (B) A slumping stage where the current front moves at a relatively constant velocity, and then the velocity gradually declines. The duration is affected by the current conditions, the value of the dimensionless constant velocity is approximately $0.4\pm 0.05$ (Rottman & Simpson Reference Rottman and Simpson1983; Cantero et al. Reference Cantero, Lee, Balachandar and Garcia2007), and the current thickness is associated with half the initial depth of the release (Bonnecaze, Huppert & Lister Reference Bonnecaze, Huppert and Lister1993; Shin et al. Reference Shin, Dalziel and Linden2004; Kyrousi et al. Reference Kyrousi, Leonardi, Roman, Armenio, Zanello, Zordan, Juez and Falcomer2018). (C) An inertial stage in which the buoyancy and inertial forces balance out. (D) A viscous stage under the balance of buoyancy and viscous forces. Under lower Reynolds number conditions, the strong viscous effect may prevent the manifestation of the inertial stage in the lock-exchange TC scenarios, leading to a direct transition from the slumping stage to the viscous stage (Amy et al. Reference Amy, Hogg, Peakall and Talling2005).
This work will discuss the effect of bidispersity on the characteristics of each stage of lock-exchange TC, such as duration, front velocity, flow thickness, etc. The organization of this paper is as follows. In the next section, we present the description of the model governing equations and how the bidisperse TC numerical configuration is established. In § 3.1, we explore the flow characteristics of the bidisperse TC, such as the front positions and front velocities of the two components, and compare the numerical results with previous knowledge. Next, the vortical coherent structures under the particle group motion of TC are described, and the association of different particle groups with the induced vortical structures is investigated in § 3.2. In § 3.3, we analyse the deposition rates and deposition profiles of the two components to acquire a better understanding of the effect of bidisperse TCs on topographic evolution. The average velocities and concentration distributions of transported particles are presented in § 3.4. The particle collisions in the bidisperse flow are often different from those in the monodisperse particle flow (Dhariwal & Bragg Reference Dhariwal and Bragg2018). Particle collisions in TCs, especially during segregation, are discussed in § 3.4. In § 3.5, a detailed analysis is performed on the transport properties of particles within the flow, particularly the evaluation of particle Reynolds number. The force evolution and energy conversion of the two components are explored in §§ 3.6 and 3.7, respectively. Finally, a summary of this work is given in § 4.
2. Methodology
The CFD-DEM method is a widely adopted method to simulate particle-laden flows (Schmeeckle Reference Schmeeckle2014; Gui et al. Reference Gui, Yang, Tu and Jiang2018). In this model framework, the particle phase is solved by DEM based on Newton's second law and the law of conservation of angular momentum, and the fluid phase is modelled by the finite volume method. The governing equations for the particle and fluid phases are introduced in § 2.1, as well as how the two phases are coupled together. Numerical set-up of lock-exchange TCs is presented in § 2.2.
2.1. Formulation of CFD-DEM model
Within the DEM framework, the translational and rotational motion of particle $i$ are solved separately, and their governing equations are as follows:
where $m_i$ and $I_i$ are the mass and the moment of inertia of particle $i$, respectively; $\boldsymbol {u}_{p,i}$ and $\boldsymbol {\omega }_{p,i}$ are the translational velocity and angular velocity of particle $i$, respectively; and $n^c_i$ represents the number of contacting particles around particle $i$. Here $\boldsymbol {F}^c_{i j}$ and $\boldsymbol {M}^c_{i j}$ are, respectively, the contact force and the torque acting on the particle $i$ by particle $j$ or the boundary wall; $\boldsymbol {F}^f_i$ represents the fluid–particle interaction force acting on the particle $i$, and $\boldsymbol {G}_i = m_i \boldsymbol {g}$ is the gravity of particle $i$.
We employ the Hertz–Mindlin contact law to calculate the particle–particle contact force $\boldsymbol {F}^c_{ij}$ between particle $i$ and particle $j$ and between the particle and the wall, which is thought of as a spring–dashpot model. Thus, the contact force $\boldsymbol {F}^c_{ij}$ is described by (Cundall & Strack Reference Cundall and Strack1979)
where $\boldsymbol {F}^n_{ij}$ and $\boldsymbol {F}^t_{ij}$ are normal and tangential components, respectively, which can be separately expressed by
where $\delta ^n_{ij}$, $\delta ^t_{ij}$, $\nu ^n_{ij}$ and $\nu ^t_{ij}$ represent the normal overlap distance, the tangential displacement, the normal relative velocity of particles $i$ and $j$ and tangential relative velocity of particles $i$ and $j$, respectively; $k^n$ and $k^t$ are the elastic constants for normal contact and tangential contact; $\gamma ^n$ and $\gamma ^t$ are the viscoelastic damping constants for normal contact and tangential contact; and $\mu _c=0.5$ is the friction coefficient. These constants are associated with a Young's modulus $Y=5\times 10^6$ Pa, Poisson ratio $\nu =0.45$ and coefficient of restitution $e=0.3$. In order to reduce the computational cost, here we adopt the Young's modulus that is approximately three orders of magnitude smaller than the real value, which generally does not affect the particle transport process on the macroscopic scale (Chen et al. Reference Chen, Xiao, Liu and Shi2017).
The number of particles in our established TC numerical model is very large and the particle diameter is much smaller than the Kolmogorov length size $\eta$, i.e. $d_p/\eta \ll O(1)$, where $\eta \sim O(10^{-3})$ m. We use a point-force approximation for the fluid force on the particles (Bagchi & Balachandar Reference Bagchi and Balachandar2004; Balachandar Reference Balachandar2009). It is assumed that the fluid force acts on the centroid of the particle, so that the fluid-induced torque is not involved in (2.2). According to our previous study (Xie et al. Reference Xie, Hu, Pähtz, He and Cheng2022), the fluid–particle interaction force $\boldsymbol {F}^f$ here includes buoyancy $\boldsymbol {F}^b$, drag force $\boldsymbol {F}^d$, lift force $\boldsymbol {F}^l$ and added mass force $\boldsymbol {F}^{add}$ ($\boldsymbol {F}^f=\boldsymbol {F}^b+\boldsymbol {F}^d+\boldsymbol {F}^l+\boldsymbol {F}^{add}$). Other hard to quantify and secondary forces, such as the Basset force, are not taken into account. These forces’ formulations and the coefficients involved are introduced separately in the following. The buoyancy $\boldsymbol {F}^b$ is
with $\boldsymbol {g} = [0,0,-9.81]\ \mathrm {m\ s}^{-2}$ being the gravitational acceleration, $\rho _f$ the fluid density and $d_p$ the particle diameter.
The drag force $\boldsymbol {F}^d$ is formulated as (Di Felice Reference Di Felice1994)
where $\alpha _f$ denotes the fluid volume fraction ($\alpha _f = 1 - \alpha _p$ with $\alpha _p$ being the particle volume fraction), $\boldsymbol {u}_f$ is the fluid velocity, $C_D$ is the drag coefficient and $\chi$ is the correction factor. Here $C_D$ and $\chi$ are given by
with $Re_p$ denoting the particle Reynolds number calculated as follows:
where $\mu _f$ is the fluid dynamic viscosity. Here the influence of adjacent particles on the drag force (Akiki, Jackson & Balachandar Reference Akiki, Jackson and Balachandar2017) is taken into account via fluid volume fraction $\alpha _f$. In our low particle volumetric concentration TC cases, this effect is weak, but we still adopt the comprehensive formulation that includes it.
The formulation of the lift force $\boldsymbol {F}^l$ reads (Loth & Dorgan Reference Loth and Dorgan2009)
where $\boldsymbol {\omega }_f$ is the fluid vorticity, and $C_L$ is the lift coefficient given by (McLaughlin Reference McLaughlin1991; Loth & Dorgan Reference Loth and Dorgan2009)
where $\omega ^\ast =|\boldsymbol {\omega }_f|d_p / |\boldsymbol {u}_f - \boldsymbol {u}_p|$, and the parameters $J^\ast$, $C^\ast _{L,\varOmega }$ and $\varOmega ^\ast _{p,eq}$ are expressed by (Mei Reference Mei1992; Loth & Dorgan Reference Loth and Dorgan2009)
with $Re_\omega =\rho _f |\boldsymbol {\omega }_f|d_p ^2 / \mu _f$ and $\varOmega ^\ast _p = |\boldsymbol {\omega }_p|d_p/|\boldsymbol {u}_f - \boldsymbol {u}_p|$.
The added mass force $\boldsymbol {F}^{a d d}$ is written as
where $C_{a d d}=0.5$ is the added mass coefficient.
We adopt LES for the fluid phase, in which large scales of flows are directly computed and small scales are modelled. The filtered incompressible Navier–Stokes equations are
where $\widetilde {u_{i,f}}$, $\tilde {p}$, $\widetilde {\tau _{i j}}$, $\widetilde {\varGamma _{i j}}$ are the filtered variables of fluid velocity, fluid pressure, fluid stress tensor and subgrid stress tensor of the fluid phase, respectively. The Smagorinsky model is adopted to resolve the subgrid scale stress tensor. The momentum exchange term from the particle phase to the fluid, $R_{i, p f}$, is computed by
with $k_c$ denoting the number of particles contained in the corresponding fluid cell and $V_{cell}$ the volume of computational fluid cell. The viscous and pressure parts of the interactions are implicitly expressed in $R_{pf}$ (see the derivation in Zhou et al. (Reference Zhou, Kuang, Chu and Yu2010)).
In this work, the TC CFD-DEM model presented is established by modifying the CFDEMcoupling $^\circledR$ that was developed by Kloss et al. (Reference Kloss, Goniva, Hager, Amberger and Pirker2012). Under the CFDEMcoupling$^\circledR$ framework, the simulation of the fluid phase is coded by OpenFOAM, and the discrete phase is implemented by the LIGGGHTS DEM model. In our previous study (Xie et al. Reference Xie, Hu, Pähtz, He and Cheng2022, Reference Xie, Hu, Zhu, Yu and Pähtz2023), we have validated this TC CFD-DEM model and applied it to explore the autosuspension process and fluid–particle interaction regimes. Note that the contribution of a particle within a given fluid cell to the cell-averaged variables is weighted by the fraction of this particle's volume that is indeed within this cell to this particle's volume. The different time steps of fluid phase and particle phase are separately limited by the Courant–Friedrichs–Lewy condition and the critical time step proposed by Li, Xu & Thornton (Reference Li, Xu and Thornton2005).
2.2. Numerical set-up
In the paper, we consider a TC with a binary mixture consisting of coarse and fine particles along a slope. The schematic of the simulated TC is shown in figure 1. The entire computational domain is a cuboid with a size of $L_x \times L_y \times L_z = 10\times 1\times 3$, where $x,y,z$ represent the longitudinal direction, the transverse direction and the vertical direction, respectively, with a $5.71^\circ$ bottom slope ($\tan \theta = 1/10$). The maximum height of the slope $z_b=1$ and the left water depth $h_l=2$. In the initial moment, a fluid–particle mixture with a particle volumetric concentration $\alpha _{p0}=0.01$ is placed to the left of the gate ($x<2$), which includes coarse particles with diameter $d_{pC}$ of 0.1 mm and fine particles with diameter $d_{pF}$ of 0.05 mm, while the right side of the gate is filled with ambient fluid with absence of particles. For the fluid, the density $\rho _f$ is 1000 kg m$^{-3}$ and the kinematic viscosity is $10^{-6}$ m$^2$ s$^{-1}$. As for the particles, the densities of coarse and fine particles $\rho _p$ both are 1200 kg m$^{-3}$ and thus the density ratio between the particle and fluid phases $s = \rho _p / \rho _f$ is 1.2.
For fluid simulation, no-slip boundary conditions are employed for the bottom wall and the longitudinal ($x$) walls, and periodic boundary conditions are exhibited in the transverse ($y$) direction. The top surface is set as a free-slip boundary condition. As for the particle phase, a geometrically smooth solid boundary is used longitudinally and vertically to avoid particle penetration, and the friction between particles and the wall is determined by the tangential contact force given in (2.5). Periodic boundary conditions are adopted in the transverse direction consistent with the fluid phase. After the gate is lifted, the bidisperse TC is generated and propagated downstream, which is entirely driven by the suspended particles. The duration of all simulations is 10 s. In order to improve the calculation efficiency, the time step of the fluid phase is 100 times that of the particle phase. The time step of the simulation is $\Delta t_f$ is $2\times 10^{-5}$ s, and that sub-time-step of the particle collision motion $\Delta t_p$ is $2\times 10^{-7}$ s. The multiple particle time steps will be iterated in one fluid time step so as to achieve physical synchronization of two-phase simulation, and then interphase data exchange is carried out (Afkhami et al. Reference Afkhami, Hassanpour, Fairweather and Njobuenwu2015).
In our simulations, the dimensional particle settling velocities $u_{T}$ of coarse and fine particles, given by Stokes’ law $u_T = (\rho _p-\rho _f)|\boldsymbol {g}|d_p^2/(18\mu _f)$, are $1.10\times 10^{-3}$ m s$^{-1}$ and $2.73\times 10^{-4}$ m s$^{-1}$, respectively, and the ratio between them is 4. The particle Reynolds number $Re_p$ defined by (2.10) is of the order of $O(10^{-3} \sim 10^{-2})$ and the particle Stokes number $St = s \rho _f |\boldsymbol {u}_f - \boldsymbol {u}_p|d_p/(9\mu _f)$ is of the order of $O(10^{-4} \sim 10^{-3})$, which are presented in table 1. Here $Re_p$ and $St$ for coarse particles are larger than those for fine particles. We employed the half of the left water depth $h_l/2$ and $t_0=(h_l/2)/u_b$ as the characteristic length scale and time scale, respectively. Here the buoyancy velocity $u_b=\sqrt {\alpha _{p0}g'h_l/2}= 0.0099$ m s$^{-1}$ for all cases is the characteristic velocity scale with $g'=|\boldsymbol {g}|(\rho _p-\rho _f)/\rho _f=0.2|\boldsymbol {g}|$ being the effective gravitational acceleration, which has been widely adopted by many predecessors, e.g. Necker et al. (Reference Necker, Härtel, Kleiser and Meiburg2002, Reference Necker, Härtel, Kleiser and Meiburg2005), Espath et al. (Reference Espath, Pinto, Laizet and Silvestrini2015) and Nasr-Azadani & Meiburg (Reference Nasr-Azadani and Meiburg2014). The particle effective gravity $|\boldsymbol {G'}|=|\boldsymbol {F}^b+m\boldsymbol {g}|$ is employed as the characteristic force scale.
Since the TCs in this paper are set on the slope, for the convenience of analysis and presentation, variables $\psi$ are transformed to the bed-parallel direction (parallel to the slope) and the bed-normal direction (perpendicular to the slope) as follows:
where $\psi$ can be fluid velocity, particle velocity and forces acting on the particles; and $\psi _{//}$, $\psi _{\bot }$, $\psi _x$ and $\psi _z$ are bed-parallel component, bed-normal component, longitudinal component and vertical component of variable $\psi$, respectively. The effect of slope angle on gentle slope conditions ($\tan \theta = 1/5\sim 1/20$) has been discussed in our previous study (Xie et al. Reference Xie, Hu, Zhu, Yu and Pähtz2023), and we only consider $\tan \theta = 1/10$ in this study. The slope can strengthen the dispersed phase segregation caused by the bed-parallel gravity difference of two dispersed phases and is more in line with the actual occurrence scenario of TCs (Pinet Reference Pinet2006).
Under the same initial particle volumetric concentration ($\alpha _{p0}=0.01$), six simulations are set according to the relative volume fraction of fine particles to total particles ($\phi _F = \alpha _{pF}/\alpha _{p0}$, where $\alpha _{pF}$ represents the initial fine particle concentration) ranging from 0 to 1 with an interval of 0.2, as shown in table 2 with relative particle phase fractions. The quantities of fine and coarse particles ($N_{pF}$ and $N_{pC}$) are also shown in the table. The sole changed variable between cases is the relative initial volume fraction for each particle size group. Additionally, we provide the flow Reynolds number $Re = \rho _f u_b h_l / (2\mu _t)$ and the front Reynolds number $Re_f=\rho _f u_{front} L_h / \mu _t$ in table 2, with $L_h$ denoting the current height determined by the TC interface.
In CFD, a set of hexahedral mesh is adopted for fluid phase. We employ three sets of grids with different resolutions. Figure 2 depicts the fluid bed-parallel velocity profiles of case $\phi _F=0.2$ under different grids. It can be seen that the profiles with different grids are highly similar, demonstrating the reliability of the model. We choose a grid resolution of $(N_x, N_y, N_z) = (250, 25, 80)$ to reduce computational cost while giving the accurate results. This resolution leads to the corresponding grid size being two to four times the particle diameter.
The fluid statistics and particle statistics are based on transverse averaging. To discuss particle deposition and transport processes separately, we divide the particles in the TC evolution into two types: deposition particles and transported particles. Particles near the slope (approximately less than two to three particle diameters away from the slope) and basically not moving ($|\boldsymbol {u}_p|/u_b < 0.01$) are defined as deposited particles. The remaining particles are defined as transported particles.
3. Results and discussion
3.1. Flow velocity and current height
During a gravity current's propagation, the TC fluid velocity profiles along the slope are similar (Altinakar, Graf & Hopfinger Reference Altinakar, Graf and Hopfinger1996). The bed-parallel velocity profiles are characterized by two shear layers separated by a velocity maximum, which can be fitted by the empirical power relation and the semi-Gaussian relationship in the near-bed region and the jet region, respectively (Altinakar et al. Reference Altinakar, Graf and Hopfinger1996; Farizan et al. Reference Farizan, Yaghoubi, Firoozabadi and Afshin2019). The profile of the fluid bed-parallel velocity normalized by the maximum bed-parallel velocity ($u_{f}^{//}/u_{f}^{//,max}$) is plotted in figure 3, together with the experimental results (Altinakar et al. Reference Altinakar, Graf and Hopfinger1996; Nourmohammadi, Afshin & Firoozabadi Reference Nourmohammadi, Afshin and Firoozabadi2011; Farizan et al. Reference Farizan, Yaghoubi, Firoozabadi and Afshin2019; Hitomi et al. Reference Hitomi, Nomura, Murai, De Cesare, Tasaka, Takeda, Park and Sakaguchi2021) for comparison. In figure 2, the dimensionless distance of the current from the slope $Z_\uparrow$ ($y$-axis in the figure) is defined as
where $Z$ denotes the distance from the slope and $H_m$ is the distance between the slope and the position where the maximum fluid bed-parallel velocity $u_f^{//,max}$ occurs. The layer-averaged height of current $H$ is expressed by (Ellison & Turner Reference Ellison and Turner1959)
in which the upper limit of the integral $Z_{top}$ is located at the position where $u_{f}^{//}$ transitions from positive to negative. One can see that all the simulation results are consistent with the previous experimental results, which confirms the feasibility of our TC model.
For the binary mixture with the same total particle concentration, we define the coarse and fine particle fronts of the TC ($x_{front,C}$ and $x_{front,F}$) as the positions of the coarse and fine particles farthest moving, respectively. Figure 4 shows the temporal evolution of non-dimensional current front $x_{front}$ and the front velocity $u_{front}$ ($={\rm d}\kern 0.06em x_{front}/{\rm {d}}t$) for coarse and fine particles, and exhibits how the mean front position and mean front velocity over $t=4\unicode{x2013}6$ and $t=8\unicode{x2013}10$ respond to the variation in $\phi _F$. It can be observed that the entire TC front goes through a short acceleration process of $t\approx 2$, which is approximately consistent with the duration of $t\approx 1.5$ in Cantero et al. (Reference Cantero, Lee, Balachandar and Garcia2007). The maximum front velocity reaches approximately 0.5, consistent with the recognition in Gladstone et al. (Reference Gladstone, Phillips and Sparks1998) and Steenhauer et al. (Reference Steenhauer, Tokyay and Constantinescu2017). After that, the front slightly decelerates for a short time and then travels at a constant velocity, i.e. constant velocity regime in lock-exchange TC evolution (Huppert & Simpson Reference Huppert and Simpson1980). Finally, the TC progressively slows down. Such evolution agrees with previous research (Huppert & Simpson Reference Huppert and Simpson1980; Cantero et al. Reference Cantero, Lee, Balachandar and Garcia2007). The constant velocity regime in the monodisperse fine particle TC is noticeable at approximately $t=4\unicode{x2013}10$. In the binary cases, this constant regime lasts for a shorter times and becomes less obvious with the decreasing fine particle fraction. Monodisperse coarse particle TC basically does not show a constant velocity process. In our simulation, the movement of the front during the acceleration stage aligns with the previous results of the theoretical solution (Huppert & Simpson Reference Huppert and Simpson1980) and simulations of saline homogeneous gravity flows (Cantero et al. Reference Cantero, Lee, Balachandar and Garcia2007). During the slumping stage, the constant velocity of the saline gravity flow is slightly higher than that in the present study. Additionally, the presence of particles causes the TC to exit the slumping stage earlier than the saline gravity flow, which agrees with the findings in Gladstone & Woods (Reference Gladstone and Woods2000).
Regardless of $\phi _F$, the front velocities of fine component and coarse component before $t= 6$ in figure 4(b,d) are quite similar, which makes the curves of the front positions of the two dispersed phases in figure 4(a) basically coincide. However, the front position of coarse particles and fine particles then separate gradually in figure 4(a). The main reason is that, as shown in figure 4(b), coarse particles decelerate faster than fine particles and the coarse particles even deposit finally on the slope. In addition, the front velocity for both coarse and fine particles is larger with greater $\phi _F$ (figure 4b,d). The front separation time of two dispersed phases is postponed and the front position can go farther as shown in figure 4(a). Above descriptions suggest that increasing the fraction of fine particles improves the TC's transport capacity significantly, which is consistent with the previous qualitative understanding (Gladstone et al. Reference Gladstone, Phillips and Sparks1998; Salaheldin et al. Reference Salaheldin, Imran, Chaudhry and Reed2000).
In order to capture the turbidity regions of two dispersed phases, we define the current height along the slope $h_{t,C}$ and $h_{t,F}$ for the coarse and fine particles, respectively. Figure 5 plots the instantaneous height at two specific moments ($t = 4$ and $t = 6$), the temporal variation of the current height at two chosen positions ($x=x_{front} - 0.8$ and $x=x_{front} - 1.6$), and the average height at two positions in two distinct time periods ($t=4\unicode{x2013}6$ and $t=13\unicode{x2013}15$). In figure 5(a,b), we can observe that the curves of the height along the slope basically coincide under all cases, whether it is fine component or coarse component. Additionally, there is an increasing noticeable difference in the thickness of the fine and coarse components, indicating a distinct vertical segregation of the two dispersed phases. As shown in figure 5(c,d), the thickness of the coarse and fine components near the front is basically the same within the acceleration stage. In dilute bidisperse suspensions, hydrodynamics assumes a dominant role, resulting in similar statistical behaviour for the same phase in the same total particle concentration, which is consistent with our previous study (Zhu et al. Reference Zhu, Qian, Lin and Yu2022). When entering the slumping stage, the decreasing speed of the thickness of the coarse component $h_{t,C}$ is greater than that of $h_{t,F}$, and $h_{t,C}$ decays to zero at $t= 10$. The value of $h_{t,F}$ gradually decreases and tends to unity, which is approximately half the initial height of the fluid–particle mixture ($h_{t,F} \approx 1$). This is consistent with the understanding of the flow regime of the lock-exchange TC (Bonnecaze et al. Reference Bonnecaze, Huppert and Lister1993; Necker et al. Reference Necker, Härtel, Kleiser and Meiburg2002; Kneller et al. Reference Kneller, Nasr-Azadani, Radhakrishnan and Meiburg2016; Kyrousi et al. Reference Kyrousi, Leonardi, Roman, Armenio, Zanello, Zordan, Juez and Falcomer2018). The unity thickness $h_{t,F}$ can be maintained for a period of time, especially in figure 5(c) where the sampling position is closer to the front. Furthermore, as shown in figure 5(c–f), the thicknesses of both the coarse and fine components are largely independent of $\phi _F$ in the early stage. In the later stage, the larger $\phi _F$ gives rise to the smaller thickness of the fine component.
3.2. Vortical coherent structures
Turbulent coherent structures can be shown with $Q$-criterion, which is given by the second invariant of fluid velocity gradient tensor $\boldsymbol {\nabla } \boldsymbol {u}_f$ (Hunt, Wray & Moin Reference Hunt, Wray and Moin1988),
with ${S_{ij}} = ( {\partial u_{f,i} /\partial x_j + \partial u_{f,j} /\partial x_i } )/2$ and ${\varOmega _{ij}} = ( {\partial u_{f,i} /\partial x_j - \partial u_{f,j} /\partial x_i } )/2$ representing the symmetric and antisymmetric components of fluid velocity gradient tensor (strain rate tensor and rotation rate tensor), respectively. This criterion was often employed to investigate coherent vortical structures (Koohandaz et al. Reference Koohandaz, Khavasi, Eyvazian and Yousefi2020; Xie et al. Reference Xie, Hu, Pähtz, He and Cheng2022). Here we discuss how these flow patterns around the current head respond to the variation of the relative fine particle volume fraction $\phi _F$.
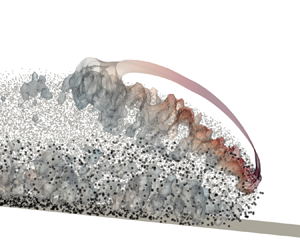
The vortical coherent structure by $Q=0.25$ together with particles in the $\phi _F=0.6$ case gives us a direct view for the time evolution of the bidisperse TC, as shown in figure 6. The coherent structures are rendered with the fluid bed-normal velocity. The coarse particles are drawn by dots in black and the fine ones are indicated by dots in grey, respectively. As the particle Reynolds number $Re_p$ is small, there only exists a large vortex due to the movement of the current front. The small vortex structures are mainly induced by the motion of the particle groups. In the initial stage ($t < 2$), the coarse and fine particles settle and move along the slope. The settling velocity of coarse particles is greater than that of fine particles, resulting in obvious coarse particle segregation downward as shown in figure 6(b). In addition, at $t = 6$, the front positions of coarse and fine particles are very close, which agrees well with the results in figure 4(a). However, the heights covered by coarse and fine particles are significantly different in the vertical direction, with the fine component reaching the higher position. The height of the fine particle layer can be seen to be larger than that of the coarse particles. The main reason is that the turbulent velocity is far from sufficient to counteract the particle settling velocity of the coarse component as compared with the fine one (Garcia & Parker Reference Garcia and Parker1993; McCaffrey et al. Reference McCaffrey, Choux, Baas and Haughton2003). As the TC continues to advance, most coarse particles settle and stop on the slope and only a small number follows in the current head at $t = 10$. At the current head, the high current intensity can still drive some coarse particles to travel along the slope. In the final stage ($t = 14$), all the coarse particles stop on the slope, but the fine particles still move along the slope. The lobe-and-cleft structures do not exist, which is mainly due to the weakened shear with the wall at low Reynolds number (Espath et al. Reference Espath, Pinto, Laizet and Silvestrini2014).
The mixing layer is expected to adjust in response to the initial relative particle volume fraction. Figure 7 shows the vortical coherent structures of the current head by $Q=0.25$ at $t=6$. The coarse or fine particles are coloured by black and grey, respectively. It is clearly observed that either the coarse or fine particle area is quite similar in all cases. Coarse particles with a larger settling velocity only cover half the height of fine particles, and even a large number of coarse particles have deposited on the slope. Moreover, in low particle concentration, the motion of coarse or fine particles is mainly influenced by the fluid hydrodynamics, which is also found in our previous studies (Zhu et al. Reference Zhu, Qian, Lin and Yu2022). The front position of the coarse or fine particles almost coincide in all cases, which is also observed in figure 4(a). For the mixing particle cases, the anticlockwise vortex near the upper interface is mainly caused by the fine particles and it enhances with the increasing fine particle concentration in terms of spatial scale. The relatively small vortex structures near the bottom boundary increase in number and size as the relative volume fraction of coarse particles increases. It implies that the increase of coarse particle proportion will enhance the local turbulent kinetic energy near the wall. Prior studies have shown that, for the small (point) particles, while coarse particles tend to enhance the turbulent kinetic energy, fine particles tend to attenuate it (Rashidi, Hetsroni & Banerjee Reference Rashidi, Hetsroni and Banerjee1990; Pan & Banerjee Reference Pan and Banerjee1996; Zhao, Andersson & Gillissen Reference Zhao, Andersson and Gillissen2013). The fluid in our simulation starts out static, and the enhancement of the local turbulent kinetic energy is probably attributed to more work done by coarse particles on the local fluid.
The three figures above evidently show that the two dispersed phases propagate in an approximately independent manner. Nonetheless, particle collisions and segregation-induced flows in the bidisperse transport process do establish some degree of connection between the two phases following their release, which will be discussed in detail in the following sections.
3.3. Bidisperse deposition process
The deposition of settling particles in the TC affects the shaping of the terrain during the propagation process. It is a common and meaningful method to analyse the deposition process through the deposition mass (Zgheib, Bonometti & Balachandar Reference Zgheib, Bonometti and Balachandar2015), deposition rate (Espath et al. Reference Espath, Pinto, Laizet and Silvestrini2014; Francisco, Espath & Silvestrini Reference Francisco, Espath and Silvestrini2017) and deposition profiles (de Leeuw et al. Reference de Leeuw, Eggenhuisen and Cartigny2018; Hu et al. Reference Hu, Tao, Li and He2020). Here, we attempt to figure out how the deposition of bidisperse TCs occurs from these behaviours, and we focus on the fine and coarse components independently.
The dimensionless deposition mass, $\tilde {m}_{depo}$, is defined as the ratio of the mass of the deposition particles to the initial mass of the corresponding particle components, the time evolution of which for six cases is shown in figure 8. Figure 9 plots the time evolution of non-dimensional particle deposition mass for the fine and coarse components (figure 9a,b), and their deposition rates ${\rm d} \tilde {m}_{depo}/{\rm d} t$ (figure 9c,d). For both fine and coarse particles, the total particle deposition mass increases continuously with the development of TC (figure 8) due to the overwhelming gravity of the particles compared with other forces hindering settlement. The deposition rate of fine particles increases approximately linearly before 14 dimensionless time, after which it remains constant or decreases slightly (figure 9c). The deposition rate of coarse component increases roughly linearly to a maximum value at $t= 7$, followed by a rapid decay of the deposition rate due to the reduction of transported coarse particles, and reaches zero around $t= 11$ (figure 9d). Before the coarse particles basically complete the settling process, the ratio of the deposition mass of the coarse particles to the fine particles is approximately equal to the ratio of their Stokes settling velocities ($\approx 4$). It is worth noting that since the deposition rate of the coarse component is always greater than that of the fine one until 10 dimensionless time. It makes the addition of total particle deposition mass dominated by the coarse component at around $t < 10$, with a very rapidly increasing trend. After $t = 10$, the deposition of the coarse component is basically completed, and the deposition of fine particles dominate the deposition behaviour of the current, which leads to a relatively slow increase in the mass of total particle deposition.
As the relative volume fraction of fine particles $\phi _F$ increases, the deposition rate of the fine component increases gradually (figure 9c), thus a larger particle deposition mass for larger $\phi _F$ (figure 9a), while the deposition rate of the coarse one does not change roughly, so does $\tilde {m}_{depo}$ for the coarse component. In other words, this means that in the bidisperse TC, the increase of the coarse component can slow down the deposition process of the fine component. It may be related to the higher colliding particle proportion at larger coarse component fraction, which will be discussed in detail in the next subsection. The strong oscillation of ${\rm d}\tilde {m}_{depo}/{\rm d}{t}$ for coarse particles is due to the relatively small number of particles at this time, which causes a jump in the number of particles in statistics.
The average particle deposition height, $h_{depos}$, expresses the volume of deposition particles per unit of bed-parallel area. Figure 10 depicts the average deposition height of the fine component $h_{F,depos}$ and the average deposition height of the coarse component $h_{C,depos}$ at the end of the simulation duration. It can be seen that on the outside of the gate, the average deposition height tends to become thinner along the slope. The variation is qualitatively consistent with the experimental results by Gladstone et al. (Reference Gladstone, Phillips and Sparks1998) and the simulation results by Francisco et al. (Reference Francisco, Espath and Silvestrini2017). From the left wall to the gate, the deposition height of fine particles in figure 10(a) shows that the closer to the left wall or the closer to the gate, the larger the deposition height. The occurrence of the former increase is related to the aggregation of fine particles with smaller settling velocities near the left wall under the effect of invasion flow. For the coarse component (figure 10b), the average deposition height increases near the gate. Since both fine and coarse particles can be transported farther on average as $\phi _F$ increases (figure 4), the deposits can accordingly cover a wider area (figure 10a,b).
3.4. Bidisperse particle statistics
Particle statistics during bidisperse TC segregation are discussed in this section, including particle velocities, particle concentration profiles and particle collisions.
3.4.1. Average bed-parallel velocities of transported particles
We perform a calculation of the average bed-parallel transported particle velocity for the fine and coarse components ($\overline {u^{//}_{pF}}$ and $\overline {u^{//}_{pC}}$) in figure 11. Figure 12 shows the average value of $\overline {u^{//}_{pF}}$ and $\overline {u^{//}_{pC}}$ over different periods at various $\phi _F$. One can easily see from the figures that the higher the fine particle proportion, the larger the average velocity of the fine or coarse particles. The average bed-parallel velocity of the transported fine or coarse particles increases, reaches the peak at around $t=4$ and then diminishes. In the bidisperse TC cases, the average bed-parallel velocity of the coarse particles, including the maximum velocity, is slightly higher than that of the fine particles during this acceleration phase ($t\le 4$). The possible reason is that the coarse particles settle faster compared with the fine particles, resulting in their bed-parallel velocity component being larger than fine particles. Afterward, the transported coarse particles slow down much more quickly than the transported fines before $t\approx 9$ due to the greater resistance against advancing. When the fine particle proportion is low ($\phi _F=0,0.2,0.4$), almost all coarse particles finally settle on the slope and the average bed-parallel transported particle velocity drops to zero. However, for the high fine particle proportion bidisperse cases ($\phi _F\ge 0.6$), the transported coarse particles speed up at approximately $t=9\unicode{x2013}12$ and even surpass the fine ones. Notably, the average velocity of transported coarse particles is currently close to the front velocity in figure 4(b). Thus, we can judge that the transported coarse particles are mostly located at the current front. We speculate that it is the strong flow near the front that keeps the coarse particles in motion.
3.4.2. Particle vertical profiles
Figure 13 shows the non-dimensional average particle concentration profiles (fine, coarse and total components, $\alpha _{pF}/\phi _F$, $\alpha _{pC}/\phi _C$ and $\alpha _{p}$) and gradient Richardson number $Ri_g$ at $x= 4.80$ when $t=7.9\unicode{x2013}8.1$ in all simulations. A useful factor, $Ri_g$, to evaluate the stratification (Kneller et al. Reference Kneller, Nasr-Azadani, Radhakrishnan and Meiburg2016) is given by
It is obvious that the fine and coarse components exhibit different characteristics while transporting. For the fine component (figure 13a), in the upper layers interacting with the ambient fluid, the non-dimensional particle concentration $\alpha _{pF}/\phi _F$ exhibits an upward exponential decrease. The increase in the fraction of fine particles helps the fine particles to be suspended at higher positions and increases the concentration gradient of fine component $\partial (\alpha _{pF}/\phi _F)/\partial z$ near the upper interface of the TC. In the lower layers, the non-dimensional concentration $\alpha _{pF}/\phi _F$ is uniformly distributed in the vertical direction, and is substantially equal to the initial particle concentration ($=$0.01). This kind of profile with different distribution of upper and lower layers can also be found in previous studies (Huang et al. Reference Huang, Imran and Pirmez2007; Kneller et al. Reference Kneller, Nasr-Azadani, Radhakrishnan and Meiburg2016). Due to the large settling velocity of the coarse component, the coarse particles are mainly transported in the lower layers of the current (figure 13b) as compared with the fine component and even form a deposited layer at the bottom more quickly. The concentration of coarse particles declines exponentially upwards, in line with the understanding of Hitomi et al. (Reference Hitomi, Nomura, Murai, De Cesare, Tasaka, Takeda, Park and Sakaguchi2021) and Sequeiros, Mosquera & Pedocchi (Reference Sequeiros, Mosquera and Pedocchi2018), which indicates an obviously stratified gradient of coarse component. With the increase of the $\phi _F$, the coarse particles can also be maintained at a slightly higher position, which means that the increase of fine particles can inhibit the settling of coarse particles to a certain extent. Such differential concentration profile of the coarse and fine components in the current head is attributed to their different settling velocities ($u_{T,C}>u_{T,F}$), which is consistent with the experimental understandings of Baas et al. (Reference Baas, McCaffrey, Haughton and Choux2005). In short, for the bidisperse TC, the upper layer is mainly dominated by the fine component, and the lower layer is coexistence of coarse and fine components. As can be observed in figure 13(c), for the monodisperse TCs, both coarse and fine particle concentrations firstly increase at the interfacial region and keep almost constant until near the slope. For the bidisperse TCs, we can observe the particle segregation. With increasing $\phi _F$, particles are less accumulated near the wall and more distributed in the TC head area, which can be also directly observed in figure 7.
Figure 13(d) shows that the gradient Richardson number increases at around $z-z_b=1$ and $z-z_b=0.5$, respectively, which is consistent with previous results in Nasr-Azadani, Meiburg & Kneller (Reference Nasr-Azadani, Meiburg and Kneller2018). The gradient Richardson number less than 0.25 at approximately $z-z_b=1$ is associated with the fine particle concentration profile. The growth of Kelvin–Helmholtz billows here is mainly inhibited by the considerable fluid viscosity at low Reynolds numbers (Koohandaz et al. Reference Koohandaz, Khavasi, Eyvazian and Yousefi2020). A very large $Ri_g$ at $z-z_b=0.5$ implies very strong stratification, which is dominated by the coarse particle concentration profile and fluid velocity profile.
3.4.3. Particle collision process
Particle segregation in the lock-exchange bidisperse TC mainly results from the different velocities of coarse and fine particles. The contact force, as the key to particle collisions, has showed its non-negligible effect on particle transport in our previous TC study (Xie et al. Reference Xie, Hu, Zhu, Yu and Pähtz2023). Here we employ different contact force thresholds $\eta _t$ to traverse and retrieve all the transported particles to obtain the contact force magnitude and the corresponding particle's proportion ($n_{co,C(F)}/N_{pC(F)}$), as shown in figure 14. In the monodisperse TC, the number of collision particles increases gradually due to similar falling velocity, reaches the maximum and then decreases because of the reduction of transported particles. However, in the bidisperse TC, the collision number increases rapidly during the segregation process, which is closely connected with the unequal settling velocities of coarse and fine particles in table 1. Both coarse particles and fine particles will be more accessible to collide with the other dispersed phase. When the threshold $\eta _t$ increases, the collision number decreases significantly except the $\phi _F=1$ case. We can confirm that the contact force in the pure coarse particle case is larger than half of the effective gravity force ($0.5|\boldsymbol {G}'|$), while that in the pure fine particle case is around $0.10|\boldsymbol {G}'|$ and $0.25|\boldsymbol {G}'|$. As for the bidisperse cases, we speculate that most collisions belong to the collisions between the coarse and fine particles and the magnitude of the force is mostly smaller than $0.25|\boldsymbol {G}_C'|$ ($2|\boldsymbol {G}_F'|$). In other words, the segregation enhances the collision on fine particles ($n_{co,F}/N_{pF}$ in figure 14e–h has been increased) and increases the proportion of colliding coarse particles with small contact force (figure 14a,b), whereas its ability to provide large contact force for coarse particles is weak (figure 14c,d). It is clear from the foregoing that the particle collisions are considerably affected by the segregation of two dispersed phases.
3.5. Particle transport properties in the TC process
The segregation process in bidisperse TC changes the transport properties of particles in the flow. Here we perform the statistics of the average particle Reynolds number (defined by (2.10)) of the transported fine and coarse particles ($\overline {Re_{p,F}}$ and $\overline {Re_{p,C}}$) as shown in figure 15(a). It characterizes the transport properties of the particles in the flow. The ratio of the two $\xi _{CF}=\overline {Re_{p,C}}/\overline {Re_{p,F}}$ is shown in figure 15(b). Note that we assume that when the mass of the transported particles of coarse component is less than 10 % of its initial mass, the component essentially finishes the settling process, and we define the exact time as $T_c$. The particle Reynolds number of the coarse component, as well as the forces exerted on them in the next subsection, is not plotted at $t > T_c$. The average particle Reynolds numbers of both fine and coarse particles decrease gradually (figure 15a), demonstrating a dropping slip velocity ($|\boldsymbol {u}_f - \boldsymbol {u}_p|$) and a rising drag coefficient $C_D$. In essence, it reflects that the two-phase movement tends to coordinate during the process of particles settling. The ratio $\xi _{CF}$ gradually falls and approaches 2 before the coarse component basically finishes settling, as shown in figure 15(b). It can give
where subscripts $@F$ and $@C$ represent the slip velocity for transported fine and coarse particles, respectively. In that way, it follows that as TC evolves, remaining transported coarse particles will eventually maintain a motion state similar to that of the fine particles, even though the majority of the coarse particles have been deposited by gravity. This part of the transported coarse particles mainly participate in TC evolution near the very front after approximately $t = 8$. In addition, the relative fine particle volume fraction $\phi _F$ essentially has no impact on $\overline {Re_{p,F}}$ and $\overline {Re_{p,C}}$, and accordingly has no impact on the average particle Reynolds number ratio $\xi _{CF}$.
We also investigate the average particle Reynolds number in the bed-parallel and bed-normal direction, $\overline {Re_{p}^{//}}$ and $\overline {Re_{p}^{\bot }}$, where the bed-parallel and bed-normal particle Reynolds number ($Re_{p}^{//}$ and $Re_{p}^{\bot }$) are separately given by velocity decomposition,
As $\overline {Re_{p}^{//}}$ and $\overline {Re_{p}^{\bot }}$ for the coarse component and for the fine component are quite similar, we only plot the time variation of $\overline {Re_{p,F}^{//}}$ and $\overline {Re_{p,F}^{\bot }}$ for fine particles in figure 16. Here $\overline {Re_{p,F}^{\bot }}$ decreases during the whole simulation duration, suggesting that the bed-parallel velocity difference between the fluid and transported fine particles is shrinking. Note that the decay rate of $\overline {Re_{p,F}^{//}}$ in logarithmic coordinates gradually slows down at $t = 0\unicode{x2013}4$ and then approximately keeps constant (${\rm d}( {\lg (\overline {Re_{p,F}^{//}} )})/{\rm d}t \approx -3.76\times {10^{-2}}$). By comparison, $\overline {Re_{p,F}^{\bot }}$ exhibits an obvious increase before $t=6.5$, associated with the rapid settling due to the dominance of particle gravity. After that, $\overline {Re_{p,F}^{\bot }}$ remains unchanged (only decreases slightly).
Figure 17 plots the average value of $\overline {Re_{p,F}^{//}}$ and $\overline {Re_{p,F}^{\bot }}$ over two periods at varying relative fine particle volume fraction $\phi _F$, which, in addition to figure 16, depicts how $\overline {Re_{p,F}^{//}}$ and $\overline {Re_{p,F}^{\bot }}$ respond to $\phi _F$. As can be observed from figures 16 and 17, the influence of $\phi _F$ on $\overline {Re_{p,F}^{//}}$ and $\overline {Re_{p,F}^{\bot }}$ can be divided into three stages.
(i) Bidisperse transport stage (stage I). In this stage, the reduction of fine particle quantity (the increase of coarse particle quantity) promotes the increase of the bed-normal average particle Reynolds number $\overline {Re_{p,F}^{\bot }}$. This is due to the greater settling velocity of the coarse particles intensifying the bed-normal flow. This enhanced flow and the collision during the segregation process (as shown in figure 14) jointly boost the fine component's settlement, resulting in a smaller covered height depicted in figure 13(a).
(ii) Transition stage (stage II). In this stage, TC transitions from bidisperse transport to fine particle transport as the coarse particles basically settle. The impact of $\phi _F$ on $\overline {Re_{p,F}^{\bot }}$ progressively diminishes, while a reduction in $\phi _F$ leads to a corresponding decrease in $\overline {Re_{p,F}^{//}}$.
(iii) Monodisperse transport stage (stage III). This is a stage where the reduction of $\phi _F$ decreases $\overline {Re_{p,F}^{//}}$. The reason is the lower particle velocity in the case of smaller $\phi _F$ (figure 11) that corresponds to the smaller slip velocity. These facts demonstrate that the bed-parallel transport of fine particles in the smaller $\phi _F$ case has better synchronization with the flow in the later stages of the bidisperse TC.
In brief, the alterations in particle transport properties resulting from variations in $\phi _F$ exhibit a strong correlation with the completion of the downward segregation process of the coarse component.
In order to intuitively exhibit the properties of particles following the flow, we depict the bed-parallel slice of fluid transverse velocity $v_f$ together with particles at different distances from the bed ($z-z_b = 0.04$ and 0.20) of three cases as shown in figure 18. As shown in the figure, the majority of particles’ transverse velocity conforms to that of the fluid. And the particle Stokes numbers $St$ of the coarse and fine components are both far less than unity in table 1. These facts reveal that both types of particles can effectively follow the flow. Thus, it is reasonable to conjecture that the transport motion of them would be similar, as mentioned above. Nonetheless, the coarse particles exhibit a higher $St$ value, indicating a relatively weaker capacity for transport.
3.6. Average force evolution
Figure 19(a,b) shows the time variation of dimensionless average forces on the particles in the bed-parallel and bed-normal direction of Case 4 ($\phi _F=0.6$), respectively. The dimensionless forces in the figure are for all transported particles, which is the sum of the force components of all transported particles divided by the total particle effective gravity. The figures include effective drag force $\boldsymbol {F}^{Ed}$ (the sum of effective gravity $\boldsymbol {G}'$ and drag force $\boldsymbol {F}^d$), lift force $\boldsymbol {F}^l$, added mass force $\boldsymbol {F}^{add}$, contact force $\boldsymbol {F}^c$ and total force ($\boldsymbol {F}^T=\boldsymbol {F}^{Ed}+\boldsymbol {F}^{l}+\boldsymbol {F}^{add}+\boldsymbol {F}^{c}$).
In the bed-parallel direction (figure 19a), the positive average total force first increases and then decreases to zero at $t=0\unicode{x2013}4$, which indicates that the particles are on average accelerated along the slope. At $t > 4$, the total force becomes negative, and the particles, on average, exhibit a gradual decay in velocity, consistent with our knowledge of TC on flat slopes (Xie et al. Reference Xie, Hu, Pähtz, He and Cheng2022). The effective drag force remains positive (except in the very beginning stages) and is the dominant factor promoting particles to transport along the slope, where the effective gravity plays a decisive role ($\overline {\boldsymbol {G}'_{//}}=\sin \theta \simeq 0.1$). The average lift force is positive at $t=0\unicode{x2013}2$, because most of the particles are subjected to the positive vorticity. After $t=2$, the negative vorticity induced by the bottom wall gradually becomes prominent, and more particles enter the negative vorticity region, so that the lift force becomes considerably negative. The added mass and contact forces are approximately negligible in the bed-parallel direction as compared with other forces. In the bed-normal direction indicated in figure 19(b), the average total force is negative at first ($t=0\unicode{x2013}2.3$), then becomes positive at $t=2.3\unicode{x2013}4.9$ and eventually turns back to negative after $t=4.9$ due to the overwhelming particle gravity. The positive average contact force provided by the bottom wall comparatively resists the negative effective drag force, whereas the lift force and added mass force are secondary.
It is worthwhile to explore the dynamic process of the coarse and fine components separately, which is crucial for the evolution of the bidisperse TC. Figure 20 shows the time evolution of the average forces for the transported fine and coarse particles in the bed-parallel and bed-normal direction.
In the bed-parallel direction, before the coarse component roughly finishes the settling process (approximately $t<8.4$), the evolution trend of the total force of the coarse and fine particles is approximately exactly the same. It explains why the forward positions of the two components in figure 4(a) highly coincide. The main forces of the two components are still effective drag force and lift force, which is consistent with the overall understanding of TC in figure 19(a). For the fine components (figure 20a), between 0 and 4 dimensionless time, the effective drag force is roughly 0, which means that the effective gravity and drag force along the slope are in balance, and the lift force is positive. Subsequently, the effective drag force gradually increases and becomes the factor that drives the particles forward, while the lift force becomes negative and becomes the inhibitory factor. For the coarse component (figure 20c), the effective drag force acts as the dominant factor promoting the advancement from the very beginning. Since the coarse particles have a larger settling velocity, they will enter the negative vorticity region of the lower layer more quickly, and thus the lift force remains negative except for the very initial moment. Interestingly, the contact force of the coarse particles shows a negative value before the settling process is completed (figure 20c), while the fine particle shows a positive value (figure 20a). Combining the average contact force of the TC as a whole (figure 19a), it is not difficult to conclude that in the evolution of the bidisperse TC, the fine particles are pushed forward by the coarse particles until the coarse particles basically complete the settlement. After that, the contact force on the fine particles also becomes negative due to the collision of sediment and the bottom slope.
In the vertical direction (figure 20b,d), the total force evolution of the coarse grains is also highly similar with that of the fine grains. The effective drag force of the coarse particles is negative, and due to the prominent effective gravity, the particles sink, while the contact force remains negative. At $t=0\unicode{x2013}7$ in figure 20(b), the fine particles receive a downward contact force from the collision with the coarse particles. The purpose of this contact force is to make the fine particles sink as quickly as possible in synchronization with the coarse particles. This causes the slip velocity of the fine particles to be very large, and the upward drag force exceeds the effective gravity of the particle, making the effective drag force positive. After $t > 7$, the fine particle group as a whole generally exhibits the settling with a constant velocity ($\overline {\boldsymbol {F}^{T}_{\bot }}\approx 0$), in which the contact force becomes positive and the effective drag force turns to negative.
Given that, in the bed-parallel direction, the fine and coarse particles are predominantly governed by the effective drag force ($\overline {\boldsymbol {F}^{Ed}_{//,F}}$ and $\overline {\boldsymbol {F}^{Ed}_{//,C}}$), lift force ($\overline {\boldsymbol {F}^{l}_{//,F}}$ and $\overline {\boldsymbol {F}^{l}_{//,C}}$) and contact force ($\overline {\boldsymbol {F}^{c}_{//,F}}$ and $\overline {\boldsymbol {F}^{c}_{//,C}}$), we here explore how these components respond to $\phi _F$ as shown in figure 21. It is clear that the influence of $\phi _F$ on these force components can be divided into two parts according to the critical point $t=T_c$. During segregation in bidisperse transport at time $t< T_c$, the contact force exerted on fine particles is positively correlated with the coarse particle proportion, as noted by the exacerbated coarse–fine collisions in figure 14. The negative contact force experienced by coarse particles rises in tandem with their quantity at $4< t< T_c$. It results in a more rapid deceleration and creates an increased velocity difference between the two dispersed phases. As a consequence, this collision process tends to provoke increase/decrease in the velocity differences between the fine particles/coarse particles and fluid phase, resulting in corresponding alterations in the bed-parallel negative drag force experienced by the fine and coarse particles. Thus, fine and coarse particles’ effective drag forces are observed to decrease and increase, respectively. The lift force at this time is not sensitive to the change in $\phi _F$ (figure 21b,e). To sum up, variations in contact force are counterbalanced by variations in effective drag force, which is expressed as
After $t=T_c$, the TC is dominated by the transport of fine particles. Even if the coarse component has been deposited, its impact on the movement of the fine particle will persist at $t>T_c$. The negative contact force $\overline {{\boldsymbol {F}}_{//,F}^{c}}$ gradually rises in figure 21(c) as $\phi _F$ drops because fine particles are moved closer to the bottom wall. At the same time, the weakening of the flow at a smaller $\phi _F$ suggests the weakening of the vorticity field, which makes the negative lift gradually decrease in figure 21(b). The variation in lift force equalizes the variation in contact force brought on by altering $\phi _F$, i.e.,
3.7. Energy conversion process
We analyse the energy transformation process of TC. It is generally recognized that the TC is initially driven by the particle gravitational potential energy (Meiburg et al. Reference Meiburg, Radhakrishnan and Nasr-Azadani2015). During the evolution of the TC, the particle gravitational potential energy is gradually transformed into the fluid potential energy, fluid kinetic energy, particle kinetic energy and dissipated energy due to the fluid viscosity and particle collision process. Particle gravitational potential energy $E_p^p$, fluid potential energy $E_p^f$, particle kinetic energy $E_k^p$ and fluid kinetic energy $E_k^f$ can be explicitly calculated as follows:
where $N_p$ is the number of particles, $z_{p,i}$ is the elevation of the particle $i$ and $\varOmega$ represents the whole simulation domain. The relationship among the energy components in the TC system can be given as follows (Xie et al. Reference Xie, Hu, Pähtz, He and Cheng2022):
where $\Delta {E_{Diss}}$ is the dissipated energy and $\Delta$ denotes the energy discrepancy between the current time and the initial time.
Figure 22 depicts the time evolution of change of each energy component, $\Delta E_p^{p,\ast }$, $\Delta E_p^{f,\ast }$, $\Delta E_k^{p,\ast }$, $\Delta E_k^{f,\ast }$ and $\Delta E_{Diss}^{\ast }$, where the energy component with symbol $\ast$ represents that the energy is non-dimensionalized by the relative initial particle gravitational potential energy with reference to the plane $z=1$. We plot the available potential energy $E_{p,avail}^\ast =-\Delta E_p^{p,\ast } - \Delta E_p^{f,\ast }$ in figure 22(c). Figure 22(a,b,c, f) shows that the trend changes of the curves of the non-dimensionalized potential energy terms and the dissipated energy term are quite similar. The particle gravitational potential energy decreases gradually in all cases with particles settling and transporting downstream, except in the monodisperse coarse particle TC. In the case of $\phi _F=0$, the particle gravitational potential energy declines first, and it remains essentially unchanged at $t>12$ because most of coarse particles have settled on the slope. As shown in figure 22(d,e), the fluid kinetic energy and the particle kinetic energy gradually increase from dimensionless time 0 to 4, and then gradually decrease at $t>4$. The fact that the particle kinetic energy reaches its maximum $t=4$ is related to the change of the average longitudinal total force of the transported particles from positive to negative (figure 19). After $t=4$, the particle phase begins to exert a force on the fluid phase of TC, so as to promote its advancement. During this transition, TC enters the slumping stage with a constant velocity. In general, in the TC evolution, the majority of the particle gravitational potential energy is converted into fluid potential energy and dissipated energy, only a small amount of energy is converted into the kinetic energy of the fluid and particle phases, which is consistent with previous understandings (Xie et al. Reference Xie, Hu, Pähtz, He and Cheng2022, Reference Xie, Hu, Zhu, Yu and Pähtz2023).
Figure 23 plots the above energy components as a function of $\phi _F$ at five selected moments. At $t<12$, an increase in the proportion of coarse particles boosts the consumption rate of the particle gravitational potential energy in figure 23(a) due to the higher settling velocity of the coarse particles, resulting in more available potential energy $E_{p,avail}^\ast$, as shown in figure 23(c). The conversion amount of the particle gravitational potential energy in each case is approximately equal around $t=12$ when most of the coarse particles have completed the settling process (figure 9b). From figure 23(d,e), it is generally observed that the kinetic energy of fluid and particle phases tends to be greater at lower $\phi _F$ before $t=4$. It is due to the faster settling of coarse particles. When $t\ge 8$, most of the coarse particles are settled, and an increase in $\phi _F$ results in higher kinetic energy of the fluid and particle phases, as shown in figure 23(d,e). Figure 23( f) shows that the amount of energy dissipated grows with the proportion of coarse particles at the early stage, which may be associated with the increase in the number of small vortex structures (figure 7).
To depict the conversion for available potential energy, figure 24 plots the time evolution of fluid kinetic energy, particle kinetic energy and dissipated energy that are divided by the available potential energy ($\Delta E^{f,\ast }_k/E_{p,avail}^{\ast }$, $\Delta E^{p,\ast }_k/E_{p,avail}^{\ast }$ and $\Delta E^{\ast }_{Diss}/E_{p,avail}^{\ast }$). Figure 24 also shows how these quantities vary with $\phi _F$ at different times. The available potential energy is primarily converted into fluid kinetic energy and dissipated energy in the early stages and primarily into dissipated energy in the latter stages, whereas the amount converted into particle kinetic energy in the whole process is very low. At $t=0\unicode{x2013}2$, the conversion proportion from available potential energy to fluid kinetic energy increases (figure 24a), while the conversion proportion to dissipated energy decreases (figure 24c). Subsequently, the change trends of the two reverse. Throughout the simulation period, the conversion proportion to particle kinetic energy continuously declines (figure 24b). As $\phi _F$ increases, the conversion proportion to fluid kinetic energy and particle kinetic energy increases (figure 24d,e), while that to dissipated energy decreases (figure 24f). This implies that the increase in fine particle proportion helps to maintain the TC flowing and slow down the dissipation of energy, which agrees with figures 22 and 23.
To address the energy evolution process of the coarse and fine components in the bidisperse TC, we employ the ratio of the energy component change per unit particle mass of fine to coarse components ($\psi ^\varSigma _{p,FC}$ for gravitational potential energy and $\psi ^\varSigma _{k,FC}$ for particle kinetic energy) and the ratio of the energy component change rate per unit particle mass of fine to coarse components ($\psi ^{\partial t}_{p,FC}$ for gravitational potential energy and $\psi ^{\partial t}_{k,FC}$ for gravitational potential energy). These variables are given by
with the superscript $pF$ and $pC$ for energy denoting the fine and coarse components, respectively.
Figure 25 depicts the temporal evolution of $\psi ^\varSigma _{p,FC}$, $\psi ^\varSigma _{k,FC}$, $\psi ^{\partial t}_{p,FC}$ and $\psi ^{\partial t}_{k,FC}$. Notably, the curves in the figure only illustrate the ratios in the bidisperse transport stage. The figure makes it clear that these ratios are independent of $\phi _F$. It suggests that these parameters can be employed to uniformly characterize the energy conversion of the bidisperse TC. We can observe from figure 25(a) that $\psi ^\varSigma _{p,FC}$ is always less than unity. This means that the gravitational potential energy converted from the fine particles is always smaller than that from the coarse particles; in other words, the coarse component is more critical. With the TC evolution, $\psi ^\varSigma _{p,FC}$ gradually increases and approaches unity. In figure 25(c), the change rate ratio $\psi ^{\partial t}_{p,FC}<1$ at $t=0\unicode{x2013}4$, implying that the conversion rate of potential energy of coarse particles is dominant. At $t=4\unicode{x2013}6$, $\psi ^{\partial t}_{p,FC}\approx 1$ means that the conversion rate of potential energy of fine particles is comparable with that of coarse particles, and subsequently the conversion rate of fine particles is larger.
Here $\psi ^\varSigma _{k,FC}$ keeps increasing from approximately 0.1 to 10 shown in figure 25(b), exhibiting a transition from the initial predominance of coarse particle motion to that of fine particle transport. The particle kinetic energy generally increases first and then decreases (figure 22d); however, compared with fine particles, coarse particles experience kinetic energy decay earlier in general. As a result, there is an ‘inverse energy change stage ($\psi _{p,FC}^{\partial {t}}<0$)’ at $t = 3.2\unicode{x2013}3.6$ in figure 25(d) where the kinetic energy of the fine particles $E^{pF}_k$ increases while $E^{pC}_k$ decreases. It is interesting that when the kinetic energies of the coarse and fine particles are equal (approximately $t=3.6$ in figure 25b), the kinetic energy of the coarse particles $E^{pC}_k$ starts to decline. Following this ($t>3.6$), the kinetic energy of the fine particles $E^{pF}_k$ similarly enters the decreasing stage due to the decrease in the kinetic energy of the coarse particles $E^{pC}_k$ and the slowing down of the potential energy input (decrease in $\partial \Delta E^p_p/\partial t$ in figure 22a).
4. Concluding remarks
Turbidity currents are ubiquitous in subaqueous environments, which can be affected by suspension polydispersity. Given that the particle collisions in low particle concentration suspension are essentially binary (Grabowski & Wang Reference Grabowski and Wang2013), this study reduces the polydispersity problem to a bidispersity one for simplicity. We investigate the evolution of bidisperse TCs using the Eulerian–Lagrangian CFD-DEM model.
The numerical fluid velocity profiles of bidisperse TC can be quantitatively consistent with previous experimental results. The front position moves forward faster with the increasing relative fine particle volume fraction $\phi _F$, which corresponds with the findings in Gladstone et al. (Reference Gladstone, Phillips and Sparks1998) and Salaheldin et al. (Reference Salaheldin, Imran, Chaudhry and Reed2000). These comparable results demonstrate the viability of employing the CFD-DEM model to simulate bidisperse TCs.
The results demonstrate that the bidisperse TC exhibits a similar velocity profile, evolution of front velocity, and evolution of current height as the monodisperse TC, which is consistent with our previous study (Zhu et al. Reference Zhu, Qian, Lin and Yu2022). The variation in the proportion of fine particles has a negligible effect on the front velocity and position during the acceleration stage of TC. When TC transitions into the slumping stage, a higher proportion of fine particles leads to a more pronounced constant velocity regime. The heights of the coarse and fine components are basically the same during the initial acceleration stage. Subsequently, the height of the coarse component decreases continuously, while that of the fine component is almost equal to the half the height of the initial fluid–particle mixture for a period of time during the slumping stage, followed by a gradual decrease in the middle and later stages.
We show that the bidisperse TCs are flows in which two dispersed phases appear to evolve independently of each other but remain internally connected through coarse–fine collisions and flows. As the coarse particles have a higher settling velocity, they finish the settling process earlier and become deposited material, and the end time is $t=T_c$. By definition of $T_c$, the evolution of the bidisperse TC can be divided into two stages: the first ($t< T_c$) is the synchronised transport of coarse and fine particles; and the second ($t>T_c$) is dominated by the transport of fine particles. In the following, we elaborate the physical regimes of bidisperse TC, particularly the segregation regimes before $T_c$, with regard to the perspectives of particle component distribution, vortical coherent structures, force evolution and energy conversion.
In the bidisperse transport stage ($t< T_c$), the coarse particle profile does not depend on $\phi _F$, while fine particles maintain a slightly thicker TC profile with increasing $\phi _F$. The reason is that collisions between fine and coarse particles can enhance fine particles’ settling. There exist obviously fragmented vortical coherent structures in the lower layers, which are closely related to the existence and distribution of coarse particles. The vortical structures near the upper interface of the TC head are mainly governed by fine particles. The larger the $\phi _F$, the larger the fluid velocity, and thus the larger the streamwise vortex size. Effective drag force ($\overline {\boldsymbol {F}^{Ed}_{//}}$), lift force ($\overline {\boldsymbol {F}^{l}_{//}}$) and contact force ($\overline {\boldsymbol {F}^{c}_{//}}$) are considerable in magnitude in the bed-parallel direction. When the particles collide, the average contact force of coarse to fine particles has a positive effect on fine component transport along the slope. For larger $\phi _F$, the effective collisions between coarse and fine particles are decreased, leading to the diminishing average contact force acting on fine particles. The effective drag force $\overline {\boldsymbol {F}^{Ed}_{//}}$ increases, which also explains the increase in the macroscopic transport velocity with increasing $\phi _F$. Note that the change in the effective drag force caused by the change in $\phi _F$ is substantially comparable to the change in the contact force. Then the particle Reynolds number ratio is approaching 2 ($\xi _{CF}\to 2$), implying that the transport motion of the two dispersed phases is similar.
In the fine component transport stage ($t>T_c$), the collision of the deposited materials produces the resistance to the bed-parallel transport of fine component. This negative contact force diminishes as $\phi _F$ grows, and its change is roughly balanced by the change in lift force.
Regarding the energy conversion, the coarse particles’ potential energy decreases faster in the early stages resulting in a larger transported particle velocity while the fine particles’ potential energy declines mildly. The kinetic energy first increases and then decays when $t< T_c$. The coarse particles’ kinetic energy begins to decay as soon as their kinetic energy per unit mass equals that of the fine particles, which occurs earlier than the fine particles.
The effect of bidispersity on particle flows is not only affected by the fraction ratio of coarse and fine components, but also by factors such as particle size and its ratio. Future research should look into this effect to strengthen a comprehensive understanding of the effect of bidispersity on TCs.
Supplementary material
All data supporting the findings of this study (including source data) are available within the paper and its supplementary information files at https://doi.org/10.1017/jfm.2023.623.
Funding
The work was supported by the National Natural Science Foundation of China (grant no. 12172331 for P.H., no. 12002334 for C.Z., no. 12222211 for D.P. and no. 12072319 for Z.Y.) and Zhejiang Provincial Natural Science Foundation (grant no. LR19E090002 for P.H. and no. LQ21A020004 for C.Z.). C.Z. acknowledges the China Scholarship Council (no. 202108330166) for providing him with a visiting scholarship at NUS, Singapore.
Declaration of interests
The authors report no conflict of interest.