


1 Introduction
Since the invention of chirped pulse amplification (CPA)[
Reference Strickland and Mourou
1
], high-power laser technology has developed rapidly in the past several decades[
Reference Mourou
2
]. With ultra-high laser intensity ( $\ge {10}^{18}\ \mathrm{W}/{\mathrm{cm}}^2$
), high-power lasers have become the cornerstone of the high-field sciences and have been applied in plasma-based charged particle accelerators[
Reference Esarey, Schroeder and Leemans
3
–
Reference Wang, Feng, Ke, Yu, Xu, Qi, Chen, Qin, Zhang, Fang, Liu, Jiang, Wang, Wang, Yang, Wu, Leng, Liu, Li and Xu
5
], laboratory astrophysics[
Reference Gregori, Ravasio, Murphy, Schaar, Baird, Bell, Benuzzi-Mounaix, Bingham, Constantin, Drake, Edwards, Everson, Gregory, Kuramitsu, Lau, Mithen, Niemann, Park, Remington, Reville, Robinson, Ryutov, Sakawa, Yang, Woolsey, Koenig and Miniati
6
,
Reference Albertazzi, Ciardi, Nakatsutsumi, Vinci, Béard, Bonito, Billette, Borghesi, Burkley, Chen, Cowan, Herrmannsdörfer, Higginson, Kroll, Pikuz, Naughton, Romagnani, Riconda, Revet, Riquier, Schlenvoigt, Skobelev, Faenov, Soloviev, Huarte-Espinosa, Frank, Portugall, Pépin and Fuchs
7
], attosecond science[
Reference Xu, Zhang, Zhang, Lu, Zhou, Zhou, Dromey, Zhu, Zepf, He and Qiao
8
] and high-energy-density physics[
Reference Zylstra, Hurricane, Callahan, Kritcher, Ralph, Robey, Ross, Young, Baker, Casey, Döppner, Divol, Hohenberger, Wilde, Van Wonterghem, Woods, Woodworth, Yamaguchi, Yang and Zimmerman
9
,
Reference Yu, Liu, Zhao, Zhu, Lu, Cao, Zhang, Shao and Sheng
10
]. Meanwhile, the manipulation and detection of ultra-intense lasers have become increasingly challenging as the laser peak power has grown, primarily due to the limited damage thresholds of solid optical materials. To overcome this challenge, extensive research has been devoted to plasma optical components, which have rapidly developed owing to their orders-of-magnitude higher optical damage thresholds in comparison to solid-state optics[
Reference Thaury, Quéré, Geindre, Levy, Ceccotti, Monot, Bougeard, Réau, d’Oliveira, Audebert, Marjoribanks and Martin
11
–
Reference Riconda and Weber
22
]. In the past decades, a variety of advanced plasma optical components have been demonstrated for their capacities to manipulate the temporal contrast[
Reference Thaury, Quéré, Geindre, Levy, Ceccotti, Monot, Bougeard, Réau, d’Oliveira, Audebert, Marjoribanks and Martin
11
], intensity[
Reference Ren, Cheng, Li and Suckewer
12
,
Reference Trines, Fiúza, Bingham, Fonseca, Silva, Cairns and Norreys
13
,
Reference Edwards, Munirov, Singh, Fasano, Kur, Lemos, Mikhailova, Wurtele and Michel
18
], duration[
Reference Hur, Ersfeld, Lee, Kim, Roh, Lee, Song, Kumar, Yoffe, Jaroszynski and Suk
21
], phase[
Reference Leblanc, Denoeud, Chopineau, Mennerat, Martin and Quéré
15
,
Reference Lehmann and Spatschek
17
] and polarization[
Reference Turnbull, Michel, Chapman, Tubman, Pollock, Chen, Goyon, Ross, Divol, Woolsey and Moody
14
,
Reference Wang, Weng, Li, Shen, Jiang, Huang, Zhu, Ma, Zhang, Li, Sheng and Zhang
20
] of relativistic intensity laser pulses. Notably, plasma holograms have been proposed as advanced plasma optics and applied in various domains[
Reference Leblanc, Denoeud, Chopineau, Mennerat, Martin and Quéré
15
,
Reference Lehmann and Spatschek
17
,
Reference Edwards, Munirov, Singh, Fasano, Kur, Lemos, Mikhailova, Wurtele and Michel
18
], particularly in the generation of relativistic intensity vortex lasers.
$\ge {10}^{18}\ \mathrm{W}/{\mathrm{cm}}^2$
), high-power lasers have become the cornerstone of the high-field sciences and have been applied in plasma-based charged particle accelerators[
Reference Esarey, Schroeder and Leemans
3
–
Reference Wang, Feng, Ke, Yu, Xu, Qi, Chen, Qin, Zhang, Fang, Liu, Jiang, Wang, Wang, Yang, Wu, Leng, Liu, Li and Xu
5
], laboratory astrophysics[
Reference Gregori, Ravasio, Murphy, Schaar, Baird, Bell, Benuzzi-Mounaix, Bingham, Constantin, Drake, Edwards, Everson, Gregory, Kuramitsu, Lau, Mithen, Niemann, Park, Remington, Reville, Robinson, Ryutov, Sakawa, Yang, Woolsey, Koenig and Miniati
6
,
Reference Albertazzi, Ciardi, Nakatsutsumi, Vinci, Béard, Bonito, Billette, Borghesi, Burkley, Chen, Cowan, Herrmannsdörfer, Higginson, Kroll, Pikuz, Naughton, Romagnani, Riconda, Revet, Riquier, Schlenvoigt, Skobelev, Faenov, Soloviev, Huarte-Espinosa, Frank, Portugall, Pépin and Fuchs
7
], attosecond science[
Reference Xu, Zhang, Zhang, Lu, Zhou, Zhou, Dromey, Zhu, Zepf, He and Qiao
8
] and high-energy-density physics[
Reference Zylstra, Hurricane, Callahan, Kritcher, Ralph, Robey, Ross, Young, Baker, Casey, Döppner, Divol, Hohenberger, Wilde, Van Wonterghem, Woods, Woodworth, Yamaguchi, Yang and Zimmerman
9
,
Reference Yu, Liu, Zhao, Zhu, Lu, Cao, Zhang, Shao and Sheng
10
]. Meanwhile, the manipulation and detection of ultra-intense lasers have become increasingly challenging as the laser peak power has grown, primarily due to the limited damage thresholds of solid optical materials. To overcome this challenge, extensive research has been devoted to plasma optical components, which have rapidly developed owing to their orders-of-magnitude higher optical damage thresholds in comparison to solid-state optics[
Reference Thaury, Quéré, Geindre, Levy, Ceccotti, Monot, Bougeard, Réau, d’Oliveira, Audebert, Marjoribanks and Martin
11
–
Reference Riconda and Weber
22
]. In the past decades, a variety of advanced plasma optical components have been demonstrated for their capacities to manipulate the temporal contrast[
Reference Thaury, Quéré, Geindre, Levy, Ceccotti, Monot, Bougeard, Réau, d’Oliveira, Audebert, Marjoribanks and Martin
11
], intensity[
Reference Ren, Cheng, Li and Suckewer
12
,
Reference Trines, Fiúza, Bingham, Fonseca, Silva, Cairns and Norreys
13
,
Reference Edwards, Munirov, Singh, Fasano, Kur, Lemos, Mikhailova, Wurtele and Michel
18
], duration[
Reference Hur, Ersfeld, Lee, Kim, Roh, Lee, Song, Kumar, Yoffe, Jaroszynski and Suk
21
], phase[
Reference Leblanc, Denoeud, Chopineau, Mennerat, Martin and Quéré
15
,
Reference Lehmann and Spatschek
17
] and polarization[
Reference Turnbull, Michel, Chapman, Tubman, Pollock, Chen, Goyon, Ross, Divol, Woolsey and Moody
14
,
Reference Wang, Weng, Li, Shen, Jiang, Huang, Zhu, Ma, Zhang, Li, Sheng and Zhang
20
] of relativistic intensity laser pulses. Notably, plasma holograms have been proposed as advanced plasma optics and applied in various domains[
Reference Leblanc, Denoeud, Chopineau, Mennerat, Martin and Quéré
15
,
Reference Lehmann and Spatschek
17
,
Reference Edwards, Munirov, Singh, Fasano, Kur, Lemos, Mikhailova, Wurtele and Michel
18
], particularly in the generation of relativistic intensity vortex lasers.
The relativistic vortex-laser–plasma interaction has received dramatic attention in the past year[
Reference Shi, Zhang, Arefiev and Shen
23
]. With ultra-intense intensity and helical electromagnetic fields, the relativistic vortex laser is regarded as a unique tool for accelerating and manipulating relativistic charged particles, as well as gaining insight into the transfer of angular momentum (AM) between particles and fields under high-field conditions[
Reference Hemsing and Marinelli
24
–
Reference Guo, Zhang, Xu, Guo, Shen and Lan
40
]. The relativistic intensity and precise phase of vortex lasers are foundational conditions that enable the realization of ingenious dynamic processes in these exciting theoretical and numerical studies. In order to advance the experimental research on relativistic vortex-laser–plasma interaction, various theoretical and numerical schemes have been proposed to generate relativistic intensity vortex lasers[
Reference Leblanc, Denoeud, Chopineau, Mennerat, Martin and Quéré
15
,
Reference Lehmann and Spatschek
17
,
Reference Shi, Shen, Zhang, Zhang, Wang and Xu
41
–
Reference Wu, Zhang, Nie, Sinclair, Farrell, Marsh, Alves, Tsung, Mori and Joshi
46
], yet obstacles persist in several aspects, for example, further enhancing the intensity of vortex lasers and uncovering the exact phase information. In the laboratory, the maximum intensity of vortex lasers using reflected phase plates or off-axis spiral phase mirrors still remains around ${10}^{20}\ \mathrm{W}/{\mathrm{cm}}^2$
[
Reference Wang, Jiang, Dong, Lu, Li, Xu, Sun, Yu, Guo, Liang, Leng, Li and Xu
32
,
Reference Longman, Salgado, Zeraouli, Apiñaniz, Pérez-Hernández, Eltahlawy, Volpe and Fedosejevs
47
,
Reference Chen, Zheng, Lu, Wang, Cai, Wang, Zheng, Ai, Leng, Xu and Fan
48
]. Further enhancement of the output intensity beyond
${10}^{20}\ \mathrm{W}/{\mathrm{cm}}^2$
[
Reference Wang, Jiang, Dong, Lu, Li, Xu, Sun, Yu, Guo, Liang, Leng, Li and Xu
32
,
Reference Longman, Salgado, Zeraouli, Apiñaniz, Pérez-Hernández, Eltahlawy, Volpe and Fedosejevs
47
,
Reference Chen, Zheng, Lu, Wang, Cai, Wang, Zheng, Ai, Leng, Xu and Fan
48
]. Further enhancement of the output intensity beyond ${10}^{21}\ \mathrm{W}/{\mathrm{cm}}^2$
would necessitate a continuous increase in the diameters of the optics. In particular, uncovering the phase of relativistic vortex lasers is of high significance for not only demonstrating the generation of a relativistic vortex laser, but also achieving those exciting numerical and theoretical results in experiments. This has already reached consensus among researchers in the laser–plasma community[
Reference Shi, Zhang, Arefiev and Shen
23
,
Reference Dai, Cui and Zhang
49
], yet an effective detection method is currently still unavailable.
${10}^{21}\ \mathrm{W}/{\mathrm{cm}}^2$
would necessitate a continuous increase in the diameters of the optics. In particular, uncovering the phase of relativistic vortex lasers is of high significance for not only demonstrating the generation of a relativistic vortex laser, but also achieving those exciting numerical and theoretical results in experiments. This has already reached consensus among researchers in the laser–plasma community[
Reference Shi, Zhang, Arefiev and Shen
23
,
Reference Dai, Cui and Zhang
49
], yet an effective detection method is currently still unavailable.
In this paper, we demonstrate a novel method for the reconstruction of the vortex phase and generation of relativistic vortex lasers by surface plasma holograms (SPHs). Firstly, a moderate object laser (vortex laser) and a reference laser (Gaussian laser) are used to simultaneously irradiate the surface of a flat plasma target and interfere with each other. Under the modulation of the ponderomotive force of the interference laser and the generated charge separation fields, SPHs form on the surface plasma of the target. By using the quadrature phase-shift interference, we can reconstruct the phase profile of the incident vortex laser from the density distribution of the SPHs. After the SPH formation, an ultra-intense Gaussian laser as a read-out laser irradiates the hologram. The read-out laser is diffracted by the SPH and duplicates the phase of the object laser, which converts it into an ultra-intense vortex laser. Three-dimensional particle-in-cell (3D-PIC) simulations indicate that a Gaussian read-out laser pulse with intensity of $1.98\times {10}^{20}\ \mathrm{W}/{\mathrm{cm}}^2$
can be converted and amplified to be an ultra-intense vortex laser with intensity of
$1.98\times {10}^{20}\ \mathrm{W}/{\mathrm{cm}}^2$
can be converted and amplified to be an ultra-intense vortex laser with intensity of $1.7\times {10}^{21}$
W/cm
$1.7\times {10}^{21}$
W/cm ${}^2$
at focus. The averaged orbital angular momentum (OAM) of the vortex-laser photon is up to
${}^2$
at focus. The averaged orbital angular momentum (OAM) of the vortex-laser photon is up to $0.86\mathrm{\hslash}$
, with the energy conversion efficiency to the vortex laser as high as 13.6
$0.86\mathrm{\hslash}$
, with the energy conversion efficiency to the vortex laser as high as 13.6 $\%$
. As far as we know, this provides a practical way for the first time to reconstruct the vortex phase of relativistic vortex lasers, which is crucial for generating and applying vortex lasers in various domains, for example, attosecond charged particle generation and manipulation. This also demonstrates that plasma as an optical medium enables both manipulation and precise detection of high-power lasers, which will open a new avenue of plasma optics in the ultra-relativistic regime.
$\%$
. As far as we know, this provides a practical way for the first time to reconstruct the vortex phase of relativistic vortex lasers, which is crucial for generating and applying vortex lasers in various domains, for example, attosecond charged particle generation and manipulation. This also demonstrates that plasma as an optical medium enables both manipulation and precise detection of high-power lasers, which will open a new avenue of plasma optics in the ultra-relativistic regime.
2 Model and method
The fundamental characteristics of the hologram are the abilities of recording, storing and retrieving the phase of beams. Here, we take the vortex laser and Gaussian laser as examples to introduce the plasma hologram in our study. As shown in Figure 1(a), a linearly polarized (LP) Laguerre–Gaussian (LG) laser with an incident angle of $\theta$
with respect to the
$\theta$
with respect to the $x$
-axis serves as an object laser, while an LP Gaussian laser propagating along the
$x$
-axis serves as an object laser, while an LP Gaussian laser propagating along the $x$
-axis serves as the reference laser. The electric field amplitude of these two lasers can be expressed respectively as
$x$
-axis serves as the reference laser. The electric field amplitude of these two lasers can be expressed respectively as ${E}_{\mathrm{o}}\left(r,\varphi, x\right)={E}_{\mathrm{o}}\exp \left(i{\phi}_{\mathrm{o}}\right)$
and
${E}_{\mathrm{o}}\left(r,\varphi, x\right)={E}_{\mathrm{o}}\exp \left(i{\phi}_{\mathrm{o}}\right)$
and ${E}_{\mathrm{r}}\left(r,\varphi, x\right)={E}_{\mathrm{r}}\exp \left(i{\phi}_{\mathrm{r}}\right)$
, where
${E}_{\mathrm{r}}\left(r,\varphi, x\right)={E}_{\mathrm{r}}\exp \left(i{\phi}_{\mathrm{r}}\right)$
, where $\left(r,\varphi, x\right)$
is the cylindrical coordinate and
$\left(r,\varphi, x\right)$
is the cylindrical coordinate and ${E}_{\mathrm{o}}={C}_{\mathrm{o}}\left[{w}_{\mathrm{o}}/{w}_{\mathrm{o}}(x)\right]{L}_{lp}\kern-1pt\left[2{r}^2/{w}_{\mathrm{o}}^2(x)\right]\kern-1pt{\left[\sqrt{2}r/{w}_{\mathrm{o}}(x)\right]}^{{l}}$ $\exp \left[-{r}^2/{w}_{\mathrm{o}}^2(x)\right]$
and
$\exp \left[-{r}^2/{w}_{\mathrm{o}}^2(x)\right]$
and ${E}_{\mathrm{r}}={C}_{\mathrm{r}}\left[{w}_{\mathrm{r}}/{w}_{\mathrm{r}}(x)\right]\exp \left[-{r}^2/{w}_{\mathrm{r}}^2(x)\right]$
are the amplitudes of the object laser and reference laser, respectively. Here,
${E}_{\mathrm{r}}={C}_{\mathrm{r}}\left[{w}_{\mathrm{r}}/{w}_{\mathrm{r}}(x)\right]\exp \left[-{r}^2/{w}_{\mathrm{r}}^2(x)\right]$
are the amplitudes of the object laser and reference laser, respectively. Here, ${\phi}_{\mathrm{o}}= l\varphi +{\phi}_{{lp}}+{k}_\text{o}x\cos \theta +{k}_\text{o}y\sin \theta$
and
${\phi}_{\mathrm{o}}= l\varphi +{\phi}_{{lp}}+{k}_\text{o}x\cos \theta +{k}_\text{o}y\sin \theta$
and ${\phi}_{\mathrm{r}}={k}_\mathrm{r}x+\left({k}_{\mathrm{r}}{r}^2x\right)/\left[2\left({f}_{\mathrm{r}}^2+{x}^2\right)\right]+\arctan \left(x/{f}_{\mathrm{r}}\right)$
are the phases of the object laser and reference laser, respectively,
${\phi}_{\mathrm{r}}={k}_\mathrm{r}x+\left({k}_{\mathrm{r}}{r}^2x\right)/\left[2\left({f}_{\mathrm{r}}^2+{x}^2\right)\right]+\arctan \left(x/{f}_{\mathrm{r}}\right)$
are the phases of the object laser and reference laser, respectively, ${L}_{lp}$
is a generalized Laguerre polynomial with radial index
${L}_{lp}$
is a generalized Laguerre polynomial with radial index $p$
and azimuthal index
$p$
and azimuthal index $l$
,
$l$
, ${\phi}_{lp}=\left({k}_{\mathrm{o}}{r}^2x\right)/\left[2\left({f}_{\mathrm{o}}^2+{x}^2\right)\right]+\left(l+2p+1\right)\arctan \left(x/{f}_{\mathrm{o}}\right)$
describes the space-dependent phase,
${\phi}_{lp}=\left({k}_{\mathrm{o}}{r}^2x\right)/\left[2\left({f}_{\mathrm{o}}^2+{x}^2\right)\right]+\left(l+2p+1\right)\arctan \left(x/{f}_{\mathrm{o}}\right)$
describes the space-dependent phase, ${f}_{\mathrm{o}}=\left(\pi {w}_{\mathrm{o}}^2\right)/{\lambda}_{\mathrm{o}}$
and
${f}_{\mathrm{o}}=\left(\pi {w}_{\mathrm{o}}^2\right)/{\lambda}_{\mathrm{o}}$
and ${f}_{\mathrm{r}}=\left(\pi {w}_{\mathrm{r}}^2\right)/{\lambda}_{\mathrm{r}}$
are the Rayleigh length of two lasers, respectively, and
${f}_{\mathrm{r}}=\left(\pi {w}_{\mathrm{r}}^2\right)/{\lambda}_{\mathrm{r}}$
are the Rayleigh length of two lasers, respectively, and $k,$
$k,$ $\lambda$
and
$\lambda$
and $C$
are the wave number of the laser, the wavelength of the laser and a constant, respectively. The subscript ‘o’ denotes the object laser, and the subscript ‘r’ denotes the reference laser. For convenience, we set the parameter
$C$
are the wave number of the laser, the wavelength of the laser and a constant, respectively. The subscript ‘o’ denotes the object laser, and the subscript ‘r’ denotes the reference laser. For convenience, we set the parameter $p=0$
and
$p=0$
and ${k}_{\mathrm{o}}={k}_{\mathrm{r}}=k$
, and the intensity of the interference laser can be written as follows:
${k}_{\mathrm{o}}={k}_{\mathrm{r}}=k$
, and the intensity of the interference laser can be written as follows:
 $$\begin{align}{I}_\mathrm{i}={\left|{E}_{\mathrm{o}}+{E}_{\mathrm{r}}\right|}^2={\left|{E}_{\mathrm{o}}\right|}^2+{\left|{E}_{\mathrm{r}}\right|}^2+2\mid {E}_{\mathrm{o}}\Vert {E}_{\mathrm{r}}\mid \cos \left({\phi}_{\mathrm{o}}-{\phi}_{\mathrm{r}}\right).\end{align}$$


We take the ${E}_{\mathrm{o}}$
and
${E}_{\mathrm{o}}$
and ${E}_{\mathrm{r}}$
as unit amplitudes. When the focus spot size of the object laser
${E}_{\mathrm{r}}$
as unit amplitudes. When the focus spot size of the object laser ${w}_{\mathrm{o}}$
, the reference laser
${w}_{\mathrm{o}}$
, the reference laser ${w}_{\mathrm{r}}$
and the angle
${w}_{\mathrm{r}}$
and the angle $\theta$
satisfy the following conditions, Equation
$\theta$
satisfy the following conditions, Equation $(1)$
can be simplified as follows:
$(1)$
can be simplified as follows:
 $$\begin{align*}{I}_{\mathrm{i}}\simeq \left\{\begin{array}{l}2+2\cos \left[\frac{kr^2x}{2}\left(\frac{1}{f_{\mathrm{o}}^2+{x}^2}\right)+\left(l+1\right)\arctan \left(\frac{x}{f_{\mathrm{o}}}\right)+ l\varphi \right],\\ {}\theta ={0}^{\circ },\,{w}_{\mathrm{r}}\gg {w}_{\mathrm{o}}\sim {\lambda}_{\mathrm{o}},\hfill\left(2\mathrm{a}\right)\\ {}2+2\cos \left[ l\varphi + kx\left(1-\cos \theta \right)- ky\sin \theta \right],\\ {}\theta \ne {0}^{\circ },\,{w}_{\mathrm{o}}\sim {w}_{\mathrm{r}}\gg {\lambda}_{\mathrm{o}}.\hfill\left(2\mathrm{b}\right).\end{array}\right.\end{align*}$$
Figures 1(b)–1(e) show holograms with parameters $\theta ={0}^{\circ }$
,
$\theta ={0}^{\circ }$
, $\theta ={20}^{\circ }$
and
$\theta ={20}^{\circ }$
and $l=1$
,
$l=1$
, $l=2$
, respectively. As shown in Figures 1(b) and 1(c), the holograms exhibit circular features as indicated by Equation (2a), and the number of vortex arms increases with
$l=2$
, respectively. As shown in Figures 1(b) and 1(c), the holograms exhibit circular features as indicated by Equation (2a), and the number of vortex arms increases with $l$
. When the laser parameters satisfy the conditions of Equation (2b), the holograms exhibit fork features, and the number of forked stripes increases with
$l$
. When the laser parameters satisfy the conditions of Equation (2b), the holograms exhibit fork features, and the number of forked stripes increases with $l$
. In particular, the parameter
$l$
. In particular, the parameter $l$
of the object laser can be retrieved through the pattern of the hologram in return. When a read-out Gaussian laser is diffracted by the holograms, it duplicates the phase of the object laser and converts it to a vortex laser.
$l$
of the object laser can be retrieved through the pattern of the hologram in return. When a read-out Gaussian laser is diffracted by the holograms, it duplicates the phase of the object laser and converts it to a vortex laser.
In the following, we uncover the principle of phase reconstruction using quadrature phase-shift interference[
Reference Kevin, Eddy, Scott, Peter, Donald, Jack, Dennis and Scot
50
]. Taking Equation (2a) as an example, by introducing a phase shift of $\pi /2$
in the phase of the object laser, the intensity of the interference laser can be represented as follows[
Reference Huang, Ren, Yan, Ahmed, Yue, Bozovich, Erkmen, Birnbaum, Dolinar, Tur and Willner
51
]:
$\pi /2$
in the phase of the object laser, the intensity of the interference laser can be represented as follows[
Reference Huang, Ren, Yan, Ahmed, Yue, Bozovich, Erkmen, Birnbaum, Dolinar, Tur and Willner
51
]:
 $$\begin{align}{I}_{\mathrm{i},\pi /2}&={\left|{E}_{\mathrm{o}}\exp \left( i\pi /2\right)+{E}_{\mathrm{r}}\right|}^2\nonumber\\ {}&={\left|{E}_{\mathrm{o}}\exp \left( i\pi /2\right)\right|}^2+{\left|{E}_{\mathrm{r}}\right|}^2+2\mid {E}_{\mathrm{o}}\Vert {E}_{\mathrm{r}}\mid \sin \left({\phi}_{\mathrm{o}}-{\phi}_{\mathrm{r}}\right).\end{align}$$
Combining Equations (1) and (3), the phase profile of the object laser can be expressed as follows:
 $$\begin{align}{\phi}_{\mathrm{o}}={\phi}_{\mathrm{r}}+\arctan \left(\frac{-{I}_{\mathrm{i},\pi /2}+{I}_{\mathrm{o}}+{I}_{\mathrm{r}}}{I_\mathrm{i}-{I}_{\mathrm{o}}-{I}_{\mathrm{r}}}\right).\end{align}$$
Since ${w}_{\mathrm{o}}\gg {\lambda}_{\mathrm{o}}$
, the phase distribution of the reference laser can be approximated as a planar wavefront, for example,
${w}_{\mathrm{o}}\gg {\lambda}_{\mathrm{o}}$
, the phase distribution of the reference laser can be approximated as a planar wavefront, for example, ${\phi}_{\mathrm{r}}=0$
for convenience. Thus, the phase distribution of the object laser can be retrieved by the four key parameters, that is,
${\phi}_{\mathrm{r}}=0$
for convenience. Thus, the phase distribution of the object laser can be retrieved by the four key parameters, that is, ${I}_\mathrm{i}$
,
${I}_\mathrm{i}$
, ${I}_{\mathrm{i},\pi /2}$
,
${I}_{\mathrm{i},\pi /2}$
, ${I}_{\mathrm{o}}$
and
${I}_{\mathrm{o}}$
and ${I}_{\mathrm{r}}$
.
${I}_{\mathrm{r}}$
.
Figure 2 schematically illustrates the key features of the SPH and vortex-laser generation. To demonstrate the feasibility of the proposed method, we performed full 3D-PIC simulations with the open-source code EPOCH[
Reference Arber, Bennett, Brady, Lawrence-Douglas, Ramsay, Sircombe, Gillies, Evans, Schmitz, Bell and Ridgers
52
]. The grid size of the simulation box is $55{\lambda}_0\times 40{\lambda}_0\times 40{\lambda}_0$
, sampled by
$55{\lambda}_0\times 40{\lambda}_0\times 40{\lambda}_0$
, sampled by $1100\times 800\times 800$
cells with nine macro-particles per cell. The coordinate of the left-hand side of the simulation box is
$1100\times 800\times 800$
cells with nine macro-particles per cell. The coordinate of the left-hand side of the simulation box is $x=-20{\lambda}_0$
. In this study, an LP LG laser with mode (
$x=-20{\lambda}_0$
. In this study, an LP LG laser with mode ( $l=1$
,
$l=1$
, $p=0$
) is used as the object laser, while two LP Gaussian lasers serve as the reference laser and read-out laser, respectively. The object and reference lasers are incident simultaneously from the left-hand side of the simulation box. The dimensionless electric field amplitude of the three lasers can be expressed as
$p=0$
) is used as the object laser, while two LP Gaussian lasers serve as the reference laser and read-out laser, respectively. The object and reference lasers are incident simultaneously from the left-hand side of the simulation box. The dimensionless electric field amplitude of the three lasers can be expressed as ${\mathbf{a}}_{\mathrm{o}}={a}_{\mathrm{o}}\left[{w}_{\mathrm{o}}/{w}_{\mathrm{o}}(x)\right]\left[\sqrt{2}r/{w}_{\mathrm{o}}(x)\right]$ $\exp \left[-{r}^2/{w}_{\mathrm{o}}^2(x)\right]\cos \left(\varphi +{\phi}_{lp}\right){\mathbf{e}}_y$
,
$\exp \left[-{r}^2/{w}_{\mathrm{o}}^2(x)\right]\cos \left(\varphi +{\phi}_{lp}\right){\mathbf{e}}_y$
, ${\mathbf{a}}_{\mathrm{r}}={a}_{\mathrm{r}}\left[{w}_{\mathrm{r}}/{w}_{\mathrm{r}}(x)\right]\exp \left(-{r}^2/{w}_{\mathrm{r}}^2\right){\mathbf{e}}_y$
and
${\mathbf{a}}_{\mathrm{r}}={a}_{\mathrm{r}}\left[{w}_{\mathrm{r}}/{w}_{\mathrm{r}}(x)\right]\exp \left(-{r}^2/{w}_{\mathrm{r}}^2\right){\mathbf{e}}_y$
and ${\mathbf{a}}_{\mathrm{r-o}}={a}_{\mathrm{r-o}}\cdot\left[{w}_{\mathrm{r-o}}/{w}_{\mathrm{r-o}}(x)\right]\exp \left(-{r}^2/{w}_{\mathrm{r-o}}^2\right){\mathbf{e}}_y$
, where
${\mathbf{a}}_{\mathrm{r-o}}={a}_{\mathrm{r-o}}\cdot\left[{w}_{\mathrm{r-o}}/{w}_{\mathrm{r-o}}(x)\right]\exp \left(-{r}^2/{w}_{\mathrm{r-o}}^2\right){\mathbf{e}}_y$
, where ${a}_{\mathrm{o}}=4{a}_{\mathrm{r}}=1.2$
and
${a}_{\mathrm{o}}=4{a}_{\mathrm{r}}=1.2$
and ${a}_{\mathrm{r-o}}=12$
are the peak amplitude of the corresponding laser electric fields, respectively. The normalization factor of the electric field of the laser can be represented as
${a}_{\mathrm{r-o}}=12$
are the peak amplitude of the corresponding laser electric fields, respectively. The normalization factor of the electric field of the laser can be represented as $a=(\mathrm{e}E)/\left({m}_{\mathrm{e}}c{\omega}_0\right)$
. The space-dependent phase is
$a=(\mathrm{e}E)/\left({m}_{\mathrm{e}}c{\omega}_0\right)$
. The space-dependent phase is ${\phi}_{10}=\left({kr}^2x\right)/\left[2\left({f}_{\mathrm{o}}^2+{x}^2\right)\right]+2\arctan \left(x/{f}_{\mathrm{o}}\right)$
. Here,
${\phi}_{10}=\left({kr}^2x\right)/\left[2\left({f}_{\mathrm{o}}^2+{x}^2\right)\right]+2\arctan \left(x/{f}_{\mathrm{o}}\right)$
. Here, ${w}_{\mathrm{o}}=1.5{\lambda}_0$
and
${w}_{\mathrm{o}}=1.5{\lambda}_0$
and ${w}_{\mathrm{r}}={w}_{\mathrm{r-o}}=12{\lambda}_0$
are the laser focus spot sizes,
${w}_{\mathrm{r}}={w}_{\mathrm{r-o}}=12{\lambda}_0$
are the laser focus spot sizes, ${T}_0$
is the laser cycle,
${T}_0$
is the laser cycle, ${\omega}_0$
is the laser frequency, and
${\omega}_0$
is the laser frequency, and $e$
,
$e$
, ${m}_{\mathrm{e}}$
and
${m}_{\mathrm{e}}$
and $c$
are the unit charge, the electron mass and the speed of light in vacuum, respectively. The focus of the lasers in vacuum is located at
$c$
are the unit charge, the electron mass and the speed of light in vacuum, respectively. The focus of the lasers in vacuum is located at $x=0{\lambda}_0$
. All three lasers have Gaussian time profiles with duration of
$x=0{\lambda}_0$
. All three lasers have Gaussian time profiles with duration of ${\tau}_{\mathrm{o}}={\tau}_{\mathrm{r}}=300{T}_0$
for the object and reference lasers, and
${\tau}_{\mathrm{o}}={\tau}_{\mathrm{r}}=300{T}_0$
for the object and reference lasers, and ${\tau}_{\mathrm{r-o}}=7{T}_0$
for the read-out laser. The read-out laser is incident with a time delay of
${\tau}_{\mathrm{r-o}}=7{T}_0$
for the read-out laser. The read-out laser is incident with a time delay of $320{T}_0$
. The flat target consists of fully ionized protons and electrons within the region of
$320{T}_0$
. The flat target consists of fully ionized protons and electrons within the region of $25{\lambda}_0<x<32{\lambda}_0$
,
$25{\lambda}_0<x<32{\lambda}_0$
, $-18{\lambda}_0<y$
,
$-18{\lambda}_0<y$
, $z<18{\lambda}_0$
. The density of the target has a longitudinal linear increase from
$z<18{\lambda}_0$
. The density of the target has a longitudinal linear increase from $6{n}_{\mathrm{c}}$
to
$6{n}_{\mathrm{c}}$
to $30{n}_{\mathrm{c}}$
between
$30{n}_{\mathrm{c}}$
between $x=25{\lambda}_0$
and
$x=25{\lambda}_0$
and $x=27.5{\lambda}_0$
, and remains constant at
$x=27.5{\lambda}_0$
, and remains constant at $30{n}_{\mathrm{c}}$
between
$30{n}_{\mathrm{c}}$
between $x=27.5{\lambda}_0$
and
$x=27.5{\lambda}_0$
and $x=32{\lambda}_0$
, where
$x=32{\lambda}_0$
, where ${n}_{\mathrm{c}}=\left({m}_{\mathrm{e}}{\varepsilon}_0{\omega}_0^2\right)/{e}^2$
is the critical density and
${n}_{\mathrm{c}}=\left({m}_{\mathrm{e}}{\varepsilon}_0{\omega}_0^2\right)/{e}^2$
is the critical density and ${\varepsilon}_0$
is the vacuum dielectric constant. Note that the vortex laser employed in the simulation can already be generated in the laboratory by using reflected phase plates or off-axis spiral phase mirrors[
Reference Wang, Jiang, Dong, Lu, Li, Xu, Sun, Yu, Guo, Liang, Leng, Li and Xu
32
,
Reference Longman, Salgado, Zeraouli, Apiñaniz, Pérez-Hernández, Eltahlawy, Volpe and Fedosejevs
47
].
${\varepsilon}_0$
is the vacuum dielectric constant. Note that the vortex laser employed in the simulation can already be generated in the laboratory by using reflected phase plates or off-axis spiral phase mirrors[
Reference Wang, Jiang, Dong, Lu, Li, Xu, Sun, Yu, Guo, Liang, Leng, Li and Xu
32
,
Reference Longman, Salgado, Zeraouli, Apiñaniz, Pérez-Hernández, Eltahlawy, Volpe and Fedosejevs
47
].

Figure 2 Schematic of the surface plasma hologram (SPH) formation and ultra-intense vortex-laser generation. (a) The object laser with mode LG ${}_{10}$
and the reference laser interfere at the surface of the flat plasma target. The target surface shows the intensity of the interfering laser. (b) The isosurface of the proton density at the target surface at
${}_{10}$
and the reference laser interfere at the surface of the flat plasma target. The target surface shows the intensity of the interfering laser. (b) The isosurface of the proton density at the target surface at $t=0$
,
$t=0$
, $0.5$
and
$0.5$
and $1$
ps, respectively. (c) A read-out laser irradiates the SPH, is diffracted by the SPH, duplicates the vortex phase of the object laser and converts it to an ultra-intense vortex laser in the focus.
$1$
ps, respectively. (c) A read-out laser irradiates the SPH, is diffracted by the SPH, duplicates the vortex phase of the object laser and converts it to an ultra-intense vortex laser in the focus.
3 Simulation results
3.1 Surface plasma hologram formation
The object laser and the reference laser interfere on the target surface, resulting in the formation of a standing wave electromagnetic field with a specific distribution. Figure 3(a) shows the transverse distribution of the electric field ${E}_y$
of the interference laser at
${E}_y$
of the interference laser at $x=25{\lambda}_0$
. The electric field
$x=25{\lambda}_0$
. The electric field ${E}_y$
of the interference laser has a helical distribution at the cross-section. The maximum amplitude of
${E}_y$
of the interference laser has a helical distribution at the cross-section. The maximum amplitude of ${E}_y$
is
${E}_y$
is ${a}_\mathrm{i}=0.3$
, corresponding to the intensity of
${a}_\mathrm{i}=0.3$
, corresponding to the intensity of ${10}^{17}\ \mathrm{W}/{\mathrm{cm}}^2$
. When the target surface is irradiated by the interference laser, the surface electrons are primarily driven by the laser ponderomotive force. We can calculate the transverse ponderomotive force of the interference laser by
${10}^{17}\ \mathrm{W}/{\mathrm{cm}}^2$
. When the target surface is irradiated by the interference laser, the surface electrons are primarily driven by the laser ponderomotive force. We can calculate the transverse ponderomotive force of the interference laser by ${\boldsymbol{F}}_{\perp}=-{e}^2/\left(4{m}_{\mathrm{e}}{\omega}_0^2\right)\nabla {\left|{E}_\mathrm{i}\right|}^2\simeq \left({E}_{\mathrm{o}}{E}_{\mathrm{r}}{e}^2\right)/\left(2{m}_{\mathrm{e}}{\omega}_0^2\right)$ $\sin [\left({kr}^2x\right)/2\left({f}_{\mathrm{o}}^2+{x}^2\right)+2\arctan \left(x/{f}_{\mathrm{o}}\right)+\varphi ] \left[(krx)/\left({f}_{\mathrm{o}}^2+{x}^2\right){\widehat{e}}_{\mathrm{r}}+\left(1/r\right){\widehat{e}}_{\varphi}\right]$
, which depends on the azimuthal coordinate
$\sin [\left({kr}^2x\right)/2\left({f}_{\mathrm{o}}^2+{x}^2\right)+2\arctan \left(x/{f}_{\mathrm{o}}\right)+\varphi ] \left[(krx)/\left({f}_{\mathrm{o}}^2+{x}^2\right){\widehat{e}}_{\mathrm{r}}+\left(1/r\right){\widehat{e}}_{\varphi}\right]$
, which depends on the azimuthal coordinate $\varphi$
. As shown in Figure 3(b), the intensity of the interference laser has a similar helical distribution, which agrees well with Figure 1(b). Furthermore, the transverse ponderomotive force exhibits a helical pattern, so that the surface electrons move sideways, forming a helical structure, as shown in Figure 3(c). However, due to the different charge-to-mass ratios of protons and electrons, the charge density distribution on the target surface, as shown in Figure 3(d), generates a strong charge separation electric field. This field strengthens with increasing differences in the charge density and drives the evolution of proton density towards electron density distribution. When the proton density distribution closely matches the electron density distribution, the electric field force exerted on the electrons is balanced by the ponderomotive force of the interference laser, resulting in the formation of SPHs. Figures 3(e) and 3(f) show the transverse distributions of electron and proton density at
$\varphi$
. As shown in Figure 3(b), the intensity of the interference laser has a similar helical distribution, which agrees well with Figure 1(b). Furthermore, the transverse ponderomotive force exhibits a helical pattern, so that the surface electrons move sideways, forming a helical structure, as shown in Figure 3(c). However, due to the different charge-to-mass ratios of protons and electrons, the charge density distribution on the target surface, as shown in Figure 3(d), generates a strong charge separation electric field. This field strengthens with increasing differences in the charge density and drives the evolution of proton density towards electron density distribution. When the proton density distribution closely matches the electron density distribution, the electric field force exerted on the electrons is balanced by the ponderomotive force of the interference laser, resulting in the formation of SPHs. Figures 3(e) and 3(f) show the transverse distributions of electron and proton density at $t=300{T}_0$
. After the interaction between the interference laser and the plasma flat target, the electrons and protons on the target surface are pushed aside along the helical intensity distribution of the laser while their density profile exhibits a helical groove pattern.
$t=300{T}_0$
. After the interaction between the interference laser and the plasma flat target, the electrons and protons on the target surface are pushed aside along the helical intensity distribution of the laser while their density profile exhibits a helical groove pattern.

Figure 3 (a) The transverse distribution of electric fields ${E}_y$
of the interference laser at
${E}_y$
of the interference laser at $x=25{\lambda}_0$
. (b) The intensity distribution of the interference laser and its transverse ponderomotive force at
$x=25{\lambda}_0$
. (b) The intensity distribution of the interference laser and its transverse ponderomotive force at $x=23.9{\lambda}_0$
at
$x=23.9{\lambda}_0$
at $t=60{T}_0$
. (c) The distribution of electron density and (d) the difference between electron density and proton density
$t=60{T}_0$
. (c) The distribution of electron density and (d) the difference between electron density and proton density $\delta n={n}_{\mathrm{e}}-{n}_{\mathrm{c}}$
at
$\delta n={n}_{\mathrm{e}}-{n}_{\mathrm{c}}$
at $t=60{T}_0$
. The density distributions of (e) electrons and (f) protons at
$t=60{T}_0$
. The density distributions of (e) electrons and (f) protons at $x=25{\lambda}_0$
at
$x=25{\lambda}_0$
at $t=300{T}_0$
.
$t=300{T}_0$
.
3.2 Vortex phase reconstruction
Since the SPH is formed by the laser irradiation on the target, the depth of the SPHs is therefore positively correlated with the energy deposited by the interference laser, that is, ${d}_{\mathrm{SPH}}\left(y,z\right)\propto {I}_\mathrm{i}\left(y,z\right){\tau}_{\mathrm{o,r}}$
, where
${d}_{\mathrm{SPH}}\left(y,z\right)\propto {I}_\mathrm{i}\left(y,z\right){\tau}_{\mathrm{o,r}}$
, where ${I}_{\mathrm{i}}\left(y,z\right)$
is the intensity of interference laser at the target surface. Thus,
${I}_{\mathrm{i}}\left(y,z\right)$
is the intensity of interference laser at the target surface. Thus, ${I}_\mathrm{i}\left(y,z\right)$
can be inferred from
${I}_\mathrm{i}\left(y,z\right)$
can be inferred from ${d}_{\mathrm{SPH}}\left(y,z\right)$
. To reconstruct the vortex phase of the object laser, we have performed three additional simulations, that is, adding
${d}_{\mathrm{SPH}}\left(y,z\right)$
. To reconstruct the vortex phase of the object laser, we have performed three additional simulations, that is, adding $\pi /2$
to the phase of the object laser, having only the object laser and only the reference laser, respectively, while keeping other parameters unchanged. Here, we take
$\pi /2$
to the phase of the object laser, having only the object laser and only the reference laser, respectively, while keeping other parameters unchanged. Here, we take ${n}_\mathrm{p}\simeq {n}_{\mathrm{c}}$
as an example to get the depth of the SPHs from the density distributions of the SPHs in the four simulations (see the Supplementary Material for more details). Comparative analysis reveals that altering the phase of the object laser does not change the pattern of the SPHs, but it does cause the pattern to rotate. We use the same laser duration in all four simulations, and the phase of the object laser can thus be expressed as follows:
${n}_\mathrm{p}\simeq {n}_{\mathrm{c}}$
as an example to get the depth of the SPHs from the density distributions of the SPHs in the four simulations (see the Supplementary Material for more details). Comparative analysis reveals that altering the phase of the object laser does not change the pattern of the SPHs, but it does cause the pattern to rotate. We use the same laser duration in all four simulations, and the phase of the object laser can thus be expressed as follows:
 $$\begin{align}{\phi}_{\mathrm{o}}\left(y,z\right)=\arctan \left[\frac{-{d}_{\mathrm{i},\pi /2}\left(y,z\right)+{d}_{\mathrm{o}}\left(y,z\right)+{d}_{\mathrm{r}}\left(y,z\right)}{d_\mathrm{i}\left(y,z\right)-{d}_{\mathrm{o}}\left(y,z\right)-{d}_{\mathrm{r}}\left(y,z\right)}\right].\end{align}$$
Figures 4(a)–4(d) respectively present the predicted and simulated phase profiles of the object laser, as well as the laser electric field derived from the phase. The helical phase distribution and the corresponding electric field pattern of the object laser are evident from the figures, demonstrating a strong agreement between the theoretical predictions and simulation results. By the use of data processing algorithms, one can further enhance the precision and accuracy of the phase reconstruction[ Reference Bianco, Memmolo, Leo, Montresor, Distante, Paturzo, Picart, Javidi and Ferraro 53 ]. Accurate vortex phase information is crucial for understanding precise electron dynamics in the vortex-laser–plasma interaction. As far as we know, it is the first time that such a precise method for reconstructing the phase of relativistic vortex lasers has been given, which is of significance for generating high-quality relativistic vortex lasers in the laboratory and holds significant implications for relativistic vortex-laser–plasma interaction experiments. For example, spatiotemporal vortex lasers, which possess AM perpendicular to the optical axis, have attracted widespread interest due to their significant potential in generating and accelerating isolated ultrashort electron bunch[ Reference Sun, Wang, Dong, He, Shi, Lv, Zhan, Leng, Zhuang and Li 54 ]. This proposed method can be applied in detecting the phase distributions of relativistic structured lasers such as spatiotemporal vortex lasers, representing an indispensable aspect of experimental investigation into the interactions between relativistic structured lasers and plasmas[ Reference Sun, Wang, Dong, He, Shi, Lv, Zhan, Leng, Zhuang and Li 54 ].

Figure 4 The reconstructed phase profiles of the object laser obtained through (a) theoretical calculations and (b) numerical simulations, as well as the laser electric fields obtained through (c) theoretical calculations and (d) numerical simulations.
We also considered the cases of a higher-order mode laser and oblique incidence of the object laser. When $l=2$
, the SPH exhibits two helical arms. When the object laser satisfies the condition given by Equation (2b), the SPH shows a fork pattern. In both cases, the patterns of the SPHs are consistent with those shown in Figures 1(b) and 1(c). In particular, we have also validated the applicability of Equation (5) in these two cases and depicted the phase reconstruction of the object lasers from theoretical calculations (see the Supplementary Material for more details). It should be noted that this phase reconstruction method is theoretically applicable to low-density plasma, and experimental techniques now allow for the detection of plasma density distribution using visible light, near-infrared light or X-rays[
Reference Dai, Cui and Zhang
49
,
Reference Ress, DaSilva, London, Trebes, Mrowka, Procassini, Barbee and Lehr
55
–
Reference Jang, Kim, Nam, Uhm and Suk
58
]. For reference, an experimental setup has been proposed for generating and detecting SPHs (see the Supplementary Material for more details).
$l=2$
, the SPH exhibits two helical arms. When the object laser satisfies the condition given by Equation (2b), the SPH shows a fork pattern. In both cases, the patterns of the SPHs are consistent with those shown in Figures 1(b) and 1(c). In particular, we have also validated the applicability of Equation (5) in these two cases and depicted the phase reconstruction of the object lasers from theoretical calculations (see the Supplementary Material for more details). It should be noted that this phase reconstruction method is theoretically applicable to low-density plasma, and experimental techniques now allow for the detection of plasma density distribution using visible light, near-infrared light or X-rays[
Reference Dai, Cui and Zhang
49
,
Reference Ress, DaSilva, London, Trebes, Mrowka, Procassini, Barbee and Lehr
55
–
Reference Jang, Kim, Nam, Uhm and Suk
58
]. For reference, an experimental setup has been proposed for generating and detecting SPHs (see the Supplementary Material for more details).
3.3 Ultra-intense vortex-laser generation
When the SPH is formed, the read-out laser is incident from the left-hand side of the simulation box at $t=320{T}_0$
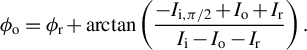
. Due to the helical density distribution of the SPH, the reflected laser by the SPH reproduces the phase of the vortex laser. Ultimately, the output laser transforms into a vortex laser near the focal volume. Figure 5(a) shows the 3D isosurface distribution of the electric field
$t=320{T}_0$
. Due to the helical density distribution of the SPH, the reflected laser by the SPH reproduces the phase of the vortex laser. Ultimately, the output laser transforms into a vortex laser near the focal volume. Figure 5(a) shows the 3D isosurface distribution of the electric field ${E}_y$
at
${E}_y$
at $t=388{T}_0$
. It is shown that
$t=388{T}_0$
. It is shown that ${E}_y$
of the output laser exhibits a typical helical feature. To evaluate the performance of the SPH, we approximate the isosurface (e.g.,
${E}_y$
of the output laser exhibits a typical helical feature. To evaluate the performance of the SPH, we approximate the isosurface (e.g., ${n}_\mathrm{p}\simeq 5{n}_{\mathrm{c}}$
) of the target surface protons as an ideal mirror, and substitute its spatial distribution into Fresnel–Kirchhoff’s diffraction formula to calculate the diffracted electric field of the output laser:
${n}_\mathrm{p}\simeq 5{n}_{\mathrm{c}}$
) of the target surface protons as an ideal mirror, and substitute its spatial distribution into Fresnel–Kirchhoff’s diffraction formula to calculate the diffracted electric field of the output laser:
 $$\begin{align}E\left(y,z\right)=\frac{1}{i{\lambda}_0}\iint {u}_0\left({y}^{\prime },{z}^{\prime}\right)k\left(\theta \right)\frac{\exp \left( ik\rho \right)}{\rho}\mathrm{d}{y}^{\prime}\mathrm{d}{z}^{\prime },\end{align}$$

Figure 5 (a) 3D isosurface distribution of the electric field ${E}_y$
at
${E}_y$
at $t=388{T}_0$
. The (
$t=388{T}_0$
. The ( $y$
,
$y$
, $z$
) projection plane on the right-hand side is taken at
$z$
) projection plane on the right-hand side is taken at $x=8.25{\lambda}_0$
. The (
$x=8.25{\lambda}_0$
. The ( $x$
,
$x$
, $y$
) projection plane of laser intensity at the bottom is taken at
$y$
) projection plane of laser intensity at the bottom is taken at $z=0{\lambda}_0$
, and the (
$z=0{\lambda}_0$
, and the ( $x$
,
$x$
, $z$
) projection plane at the rearside is taken at
$z$
) projection plane at the rearside is taken at $y=0{\lambda}_0$
. (b)–(d) The distribution of the transverse electric field
$y=0{\lambda}_0$
. (b)–(d) The distribution of the transverse electric field ${E}_y$
at different cross-sections ranging from
${E}_y$
at different cross-sections ranging from $x=7.1{\lambda}_0$
to
$x=7.1{\lambda}_0$
to $8.1{\lambda}_0$
at
$8.1{\lambda}_0$
at $t=388{T}_0$
(simulation results). (e)–(g) Same as (b)–(d) but from Fresnel–Kirchhoff’s diffraction formula.
$t=388{T}_0$
(simulation results). (e)–(g) Same as (b)–(d) but from Fresnel–Kirchhoff’s diffraction formula.
where $\rho =\sqrt{{\left[x-t\left({y}^{\prime },{z}^{\prime}\right)\right]}^2+{\left(y-{y}^{\prime}\right)}^2+{\left(z-{z}^{\prime}\right)}^2}$
,
$\rho =\sqrt{{\left[x-t\left({y}^{\prime },{z}^{\prime}\right)\right]}^2+{\left(y-{y}^{\prime}\right)}^2+{\left(z-{z}^{\prime}\right)}^2}$
, ${u}_0\left({y}^{\prime },{z}^{\prime}\right)=C\exp \left(-{r}^2/{\sigma}_0^2\right)$
is the incident Gaussian laser,
${u}_0\left({y}^{\prime },{z}^{\prime}\right)=C\exp \left(-{r}^2/{\sigma}_0^2\right)$
is the incident Gaussian laser, $t\left({y}^{\prime },{z}^{\prime}\right)$
represents the spatial distribution of the SPH isosurface and
$t\left({y}^{\prime },{z}^{\prime}\right)$
represents the spatial distribution of the SPH isosurface and $k\left(\theta \right)=\frac{\cos \left(n,r\right)-\cos \left(n,r_0\right)}{2}$
is the inclination factor. We select three positions within the region between
$k\left(\theta \right)=\frac{\cos \left(n,r\right)-\cos \left(n,r_0\right)}{2}$
is the inclination factor. We select three positions within the region between $x=7.1{\lambda}_0$
and
$x=7.1{\lambda}_0$
and $8.1{\lambda}_0$
along the
$8.1{\lambda}_0$
along the $x$
-axis to calculate the diffraction electric field
$x$
-axis to calculate the diffraction electric field ${E}_y$
of the output laser. Figures 5(b)–5(d) and 5(e)–5(g) show the simulation results and the theoretical calculations, respectively. One sees that both demonstrate transverse helical electric fields with an approximately
${E}_y$
of the output laser. Figures 5(b)–5(d) and 5(e)–5(g) show the simulation results and the theoretical calculations, respectively. One sees that both demonstrate transverse helical electric fields with an approximately $\pi$
phase distribution and a hollow electric field structure, which are in excellent agreement with the characteristic of a clear LG
$\pi$
phase distribution and a hollow electric field structure, which are in excellent agreement with the characteristic of a clear LG ${}_{10}$
mode laser. Note that part of the laser distributed in the outer ring will focus towards the central axis at an angle during the output vortex-laser focusing. This may lead to a slight increase in the duration of the output vortex laser.
${}_{10}$
mode laser. Note that part of the laser distributed in the outer ring will focus towards the central axis at an angle during the output vortex-laser focusing. This may lead to a slight increase in the duration of the output vortex laser.
Meanwhile, the output laser is focused near $x=6{\lambda}_0$
after replicating the phase of the object laser, with the focal spot size decreasing from
$x=6{\lambda}_0$
after replicating the phase of the object laser, with the focal spot size decreasing from $12{\lambda}_0$
to around
$12{\lambda}_0$
to around $2{\lambda}_0$
, and its intensity increasing by an order of magnitude compared to the incident read-out laser. Figure 6(a) shows the intensity distribution of the output laser in the transverse section at
$2{\lambda}_0$
, and its intensity increasing by an order of magnitude compared to the incident read-out laser. Figure 6(a) shows the intensity distribution of the output laser in the transverse section at $t=390{T}_0$
. One can see that the vortex laser is amplified as expected with the maximum intensity up to
$t=390{T}_0$
. One can see that the vortex laser is amplified as expected with the maximum intensity up to $1.7\times {10}^{21}$
W/cm
$1.7\times {10}^{21}$
W/cm ${}^2$
. These tightly focused relativistic vortex-laser pulses have diverse applications in high-energy-density physics[
Reference Shi, Zhang, Arefiev and Shen
23
,
Reference Zhao, Hu, Lu, Zhang, Hu, Zhu, Sheng, Turcu, Pukhov, Shao and Yu
35
], novel optics, etc.
${}^2$
. These tightly focused relativistic vortex-laser pulses have diverse applications in high-energy-density physics[
Reference Shi, Zhang, Arefiev and Shen
23
,
Reference Zhao, Hu, Lu, Zhang, Hu, Zhu, Sheng, Turcu, Pukhov, Shao and Yu
35
], novel optics, etc.
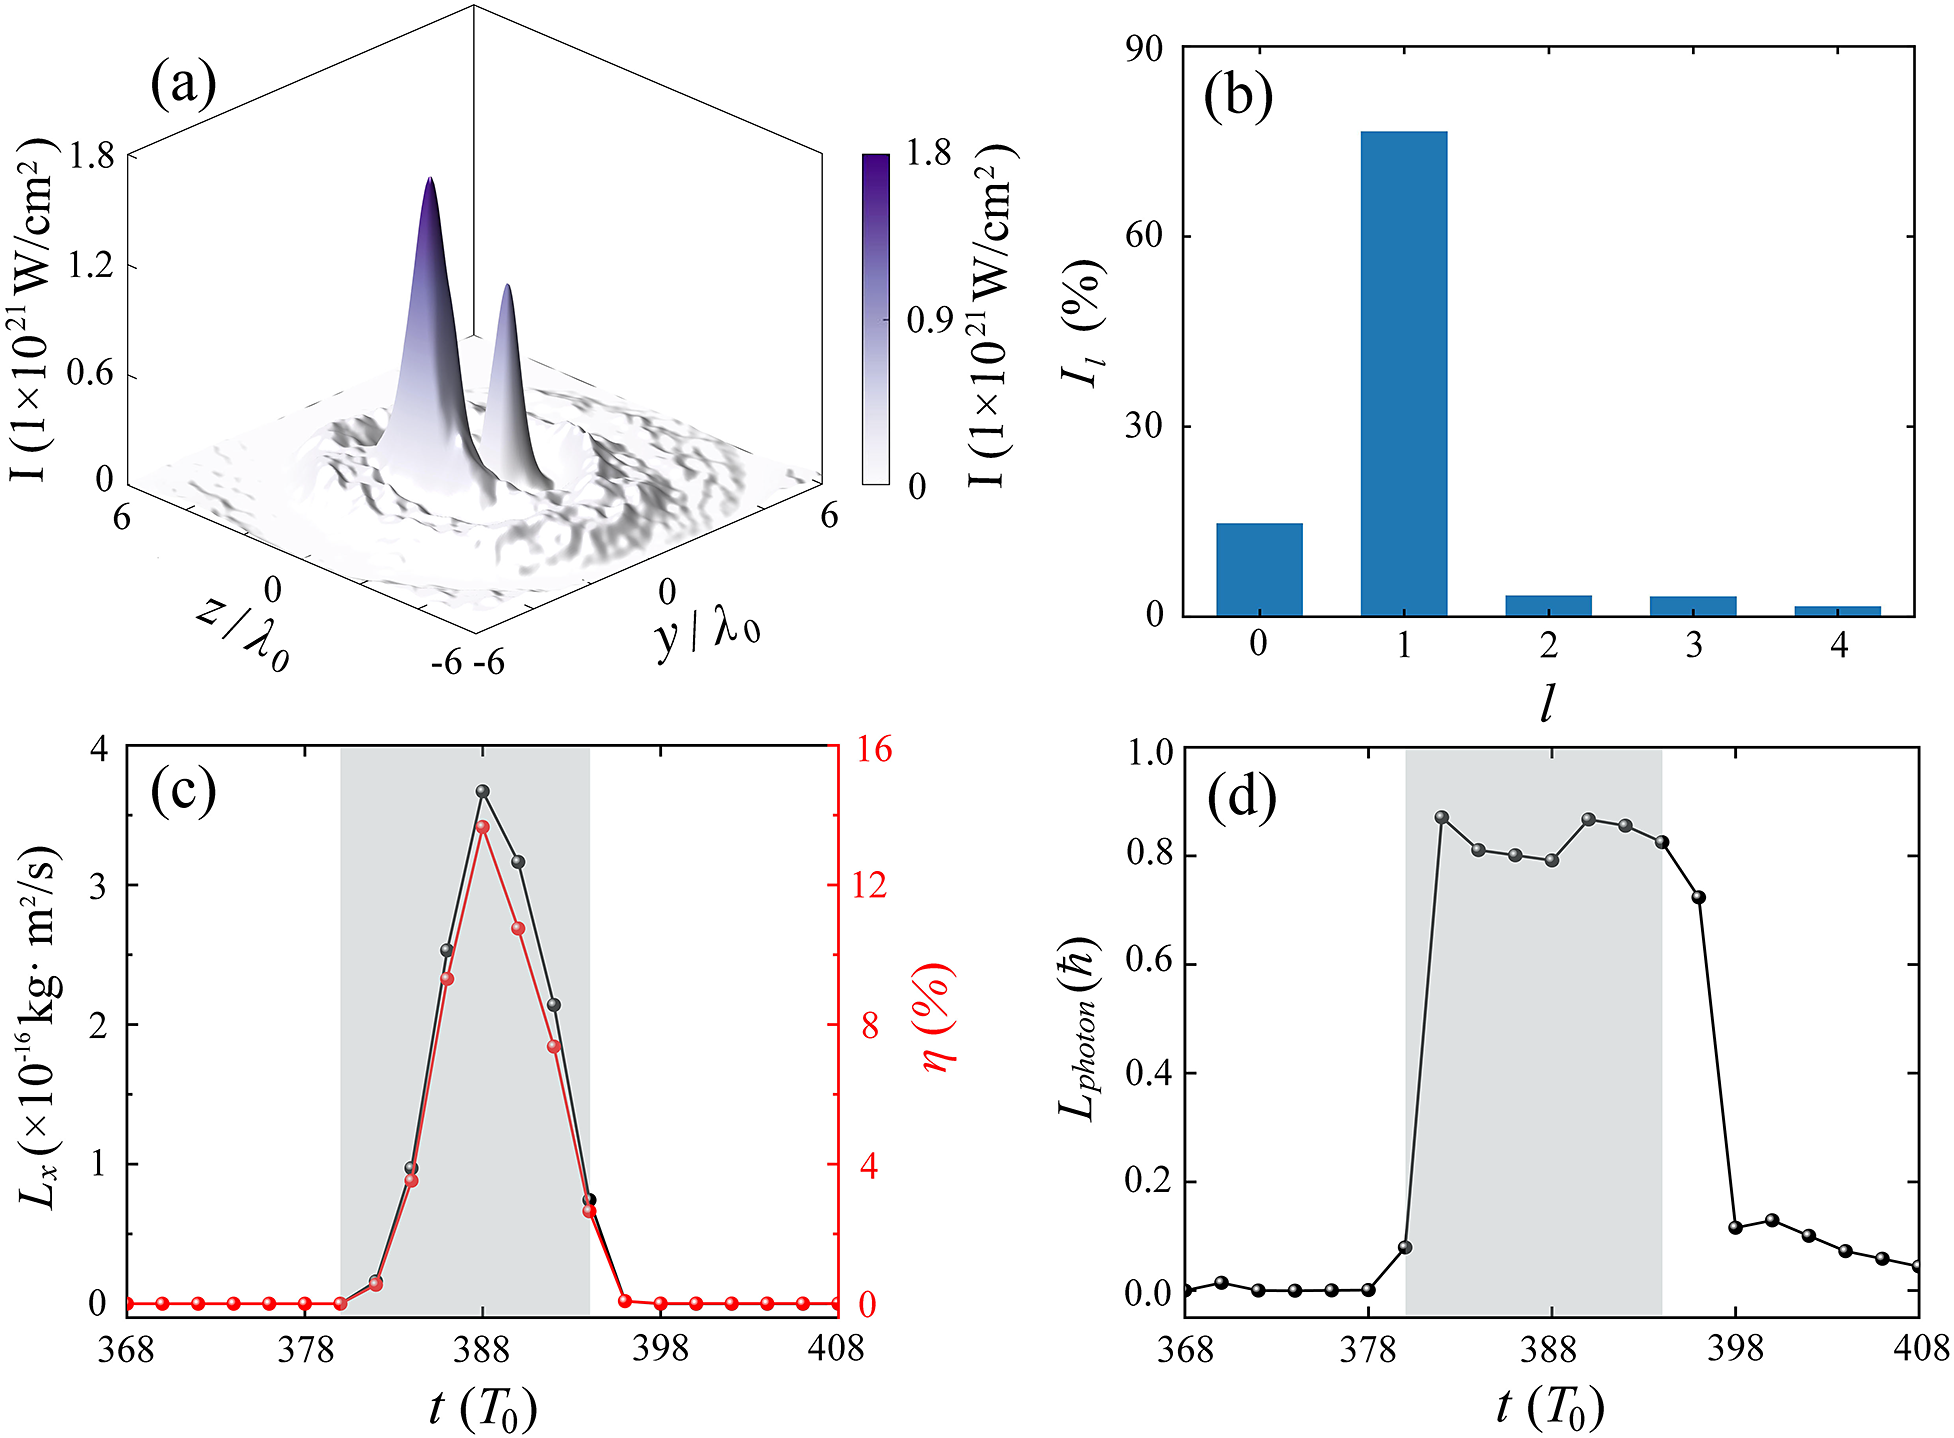
Figure 6 (a) Transverse distribution of the vortex laser intensity at $x=6{\lambda}_0$
at
$x=6{\lambda}_0$
at $t=390{T}_0$
. (b) Laguerre–Gaussian (LG) mode spectrum at
$t=390{T}_0$
. (b) Laguerre–Gaussian (LG) mode spectrum at $x=6{\lambda}_0$
at
$x=6{\lambda}_0$
at $t=390{T}_0$
. (c) Evolution of the laser total angular momentum (AM) (black line) and energy conversion efficiency to the vortex-laser pulse (red line). (d) Evolution of the averaged AM of laser photons. Here the gray area marks the stage when the laser is in the focal volume.
$t=390{T}_0$
. (c) Evolution of the laser total angular momentum (AM) (black line) and energy conversion efficiency to the vortex-laser pulse (red line). (d) Evolution of the averaged AM of laser photons. Here the gray area marks the stage when the laser is in the focal volume.
In order to investigate the weights of different modes in the output vortex laser, we select a cross-section of the electric field ${E}_y$
of the output laser at the position of
${E}_y$
of the output laser at the position of $x=6{\lambda}_0$
at
$x=6{\lambda}_0$
at $t=390{T}_0$
and evaluate the corresponding weights of different LG modes from
$t=390{T}_0$
and evaluate the corresponding weights of different LG modes from $l$
= 0 to
$l$
= 0 to $l$
= 4. Here, the weight of an LG mode can be expressed as follows:
$l$
= 4. Here, the weight of an LG mode can be expressed as follows:
 $$\begin{align}{I}_{lp}=\frac{<{E}_{lp}\left(r,\phi, x\right)\mid {E}_y\left(r,\phi, x\right)>}{<{E}_y\left(r,\phi, x\right)\mid {E}_y\left(r,\phi, x\right)>},\end{align}$$
where ${E}_y\left(r,\phi, x\right)$
and
${E}_y\left(r,\phi, x\right)$
and ${E}_{lp}\left(r,\phi, x\right)$
are the transverse electric fields of the output laser and the LG
${E}_{lp}\left(r,\phi, x\right)$
are the transverse electric fields of the output laser and the LG ${}_{lp}$
mode laser at the cross-section, respectively. In the following calculation,
${}_{lp}$
mode laser at the cross-section, respectively. In the following calculation, $p$
is set to
$p$
is set to $0$
while
$0$
while $l$
is considered to have variable values. As shown in Figure 6(b), the dominant mode of the output vortex laser is LG
$l$
is considered to have variable values. As shown in Figure 6(b), the dominant mode of the output vortex laser is LG ${}_{10}$
with a weight of 76.6%, which is in agreement with the simulation results in Figure 5. We also calculated the total AM of the vortex laser, the energy conversion efficiency to the vortex laser and the averaged AM of the laser photons in the focal volume (
${}_{10}$
with a weight of 76.6%, which is in agreement with the simulation results in Figure 5. We also calculated the total AM of the vortex laser, the energy conversion efficiency to the vortex laser and the averaged AM of the laser photons in the focal volume ( $3{\lambda}_0<x<10{\lambda}_0$
). Here, the electromagnetic AM and energy of a laser pulse can be estimated as
$3{\lambda}_0<x<10{\lambda}_0$
). Here, the electromagnetic AM and energy of a laser pulse can be estimated as ${L}_{\mathrm{laser}}={\varepsilon}_0\int \mathbf{r}\times \left(\mathbf{E}\times \mathbf{B}\right) \mathrm{d}V={L}_x+{L}_y+{L}_z$
and
${L}_{\mathrm{laser}}={\varepsilon}_0\int \mathbf{r}\times \left(\mathbf{E}\times \mathbf{B}\right) \mathrm{d}V={L}_x+{L}_y+{L}_z$
and ${E}_{\mathrm{laser}}=\frac{1}{2}\int \left({\varepsilon}_0{\mathbf{E}}^2+\frac{1}{\mu_0}{\mathbf{B}}^2\right)\mathrm{d}V$
, respectively, where
${E}_{\mathrm{laser}}=\frac{1}{2}\int \left({\varepsilon}_0{\mathbf{E}}^2+\frac{1}{\mu_0}{\mathbf{B}}^2\right)\mathrm{d}V$
, respectively, where ${\mu}_0$
is the vacuum permeability. Then the photon’s averaged AM can be written as
${\mu}_0$
is the vacuum permeability. Then the photon’s averaged AM can be written as ${L}_{\mathrm{photon}}=\mathrm{\hslash}{\omega}_0\left[{\varepsilon}_0\int \mathbf{r}\times \left(\mathbf{E}\times \mathbf{B}\right)\mathrm{d}V\right]/\left[\frac{1}{2}\int \left({\varepsilon}_0{\mathbf{E}}^2+\frac{1}{\mu_0}{\mathbf{B}}^2\right)\mathrm{d}V\right]=\left(\delta +l\right)\mathrm{\hslash}$
, where
${L}_{\mathrm{photon}}=\mathrm{\hslash}{\omega}_0\left[{\varepsilon}_0\int \mathbf{r}\times \left(\mathbf{E}\times \mathbf{B}\right)\mathrm{d}V\right]/\left[\frac{1}{2}\int \left({\varepsilon}_0{\mathbf{E}}^2+\frac{1}{\mu_0}{\mathbf{B}}^2\right)\mathrm{d}V\right]=\left(\delta +l\right)\mathrm{\hslash}$
, where $\delta$
and
$\delta$
and $l$
represent the spin and orbital AM of a photon, respectively. Given that the AM carried by the laser pulses is predominantly along their propagation axis, the AM referred to in this study primarily corresponds to
$l$
represent the spin and orbital AM of a photon, respectively. Given that the AM carried by the laser pulses is predominantly along their propagation axis, the AM referred to in this study primarily corresponds to ${L}_x$
. Figure 6(c) shows the evolution of the laser AM and energy conversion efficiency to the vortex laser. Upon entering the focal volume, the read-out laser gradually transforms into a vortex one, with its AM increasing to a maximum of
${L}_x$
. Figure 6(c) shows the evolution of the laser AM and energy conversion efficiency to the vortex laser. Upon entering the focal volume, the read-out laser gradually transforms into a vortex one, with its AM increasing to a maximum of $3.67\times {10}^{-16}\ \mathrm{kg}\cdot {\mathrm{m}}^2/\mathrm{s}$
at
$3.67\times {10}^{-16}\ \mathrm{kg}\cdot {\mathrm{m}}^2/\mathrm{s}$
at $t=388{T}_0$
. As the laser exits the focal volume, it diverges and loses the vortex phase, leading to a decrease in AM. The evolution of energy conversion efficiency to the vortex laser is consistent with the AM, with a maximum value of 13.66%, which is obviously higher than that of the previous study[
Reference Zhang, Li, Zheng, Zhao, Lu, Li, Xu, Liu, Tian, Lin, Zhang and Yu
45
].
$t=388{T}_0$
. As the laser exits the focal volume, it diverges and loses the vortex phase, leading to a decrease in AM. The evolution of energy conversion efficiency to the vortex laser is consistent with the AM, with a maximum value of 13.66%, which is obviously higher than that of the previous study[
Reference Zhang, Li, Zheng, Zhao, Lu, Li, Xu, Liu, Tian, Lin, Zhang and Yu
45
].
4 Discussion
To investigate the effects of the laser parameters on the SPHs and the generation of output vortex lasers, we vary the parameters of the interference laser in the ( ${a}_{\mathrm{o,r}}$
,
${a}_{\mathrm{o,r}}$
, ${\tau}_{\mathrm{o,r}}$
) plane. This involves varying the normalized amplitude and duration of the interference laser from
${\tau}_{\mathrm{o,r}}$
) plane. This involves varying the normalized amplitude and duration of the interference laser from ${a}_{\mathrm{o}}=4{a}_{\mathrm{r}}=0$
to
${a}_{\mathrm{o}}=4{a}_{\mathrm{r}}=0$
to $3$
, and
$3$
, and ${\tau}_{\mathrm{o,r}}$
from 0 to 2.5 ps, respectively. Figures 7(a) and 7(b) show their effect on the average depth (
${\tau}_{\mathrm{o,r}}$
from 0 to 2.5 ps, respectively. Figures 7(a) and 7(b) show their effect on the average depth ( ${d}_0$
) of the SPHs and the ratio of output vortex-laser intensity to incident read-out laser intensity (
${d}_0$
) of the SPHs and the ratio of output vortex-laser intensity to incident read-out laser intensity ( $I$
/
$I$
/ ${I}_0$
). As mentioned previously, SPHs record and convey the vortex phase of the object lasers through the surface plasma density distribution. Therefore, we calculate the average depth, that is,
${I}_0$
). As mentioned previously, SPHs record and convey the vortex phase of the object lasers through the surface plasma density distribution. Therefore, we calculate the average depth, that is, ${d}_0=\left(\sum {d}_{\mathrm{grid}}/{N}_{\mathrm{grid}}\right)\left(r\le {w}_{\mathrm{o,r}}\right)$
, from the original target surface position to the formed SPH surfaces (
${d}_0=\left(\sum {d}_{\mathrm{grid}}/{N}_{\mathrm{grid}}\right)\left(r\le {w}_{\mathrm{o,r}}\right)$
, from the original target surface position to the formed SPH surfaces ( ${n}_\mathrm{p}\simeq 5{n}_{\mathrm{c}}$
), where
${n}_\mathrm{p}\simeq 5{n}_{\mathrm{c}}$
), where ${d}_{\mathrm{grid}}$
and
${d}_{\mathrm{grid}}$
and ${N}_{\mathrm{grid}}$
are the depth of the simulation box grid and the number of grids, respectively. Since the motion of the surface ions is propelled by the charge separation electric fields, a sufficiently long laser duration is required to effectively modulate the surface ion density. In this sense, the intensity and duration of the drive lasers are two critical parameters for the formation of SPHs. When the pulse duration or intensity of the interference lasers cannot reach a certain value, the interference laser struggles to produce SPHs with sufficient depth, as shown in Figure 7(a). Under such circumstances, the ratio
${N}_{\mathrm{grid}}$
are the depth of the simulation box grid and the number of grids, respectively. Since the motion of the surface ions is propelled by the charge separation electric fields, a sufficiently long laser duration is required to effectively modulate the surface ion density. In this sense, the intensity and duration of the drive lasers are two critical parameters for the formation of SPHs. When the pulse duration or intensity of the interference lasers cannot reach a certain value, the interference laser struggles to produce SPHs with sufficient depth, as shown in Figure 7(a). Under such circumstances, the ratio $I/{I}_0$
is also small, as shown in Figure 7(b). Once the duration and intensity of the interference lasers reach this value, the produced SPHs can amplify the intensity of the output vortex laser by an order of magnitude. However, with further increases in the duration and intensity of the interference laser, the amplification of the vortex-laser intensity decreases instead. This indicates that there exists an optimal parameter region for amplifying the intensity of the vortex laser.
$I/{I}_0$
is also small, as shown in Figure 7(b). Once the duration and intensity of the interference lasers reach this value, the produced SPHs can amplify the intensity of the output vortex laser by an order of magnitude. However, with further increases in the duration and intensity of the interference laser, the amplification of the vortex-laser intensity decreases instead. This indicates that there exists an optimal parameter region for amplifying the intensity of the vortex laser.
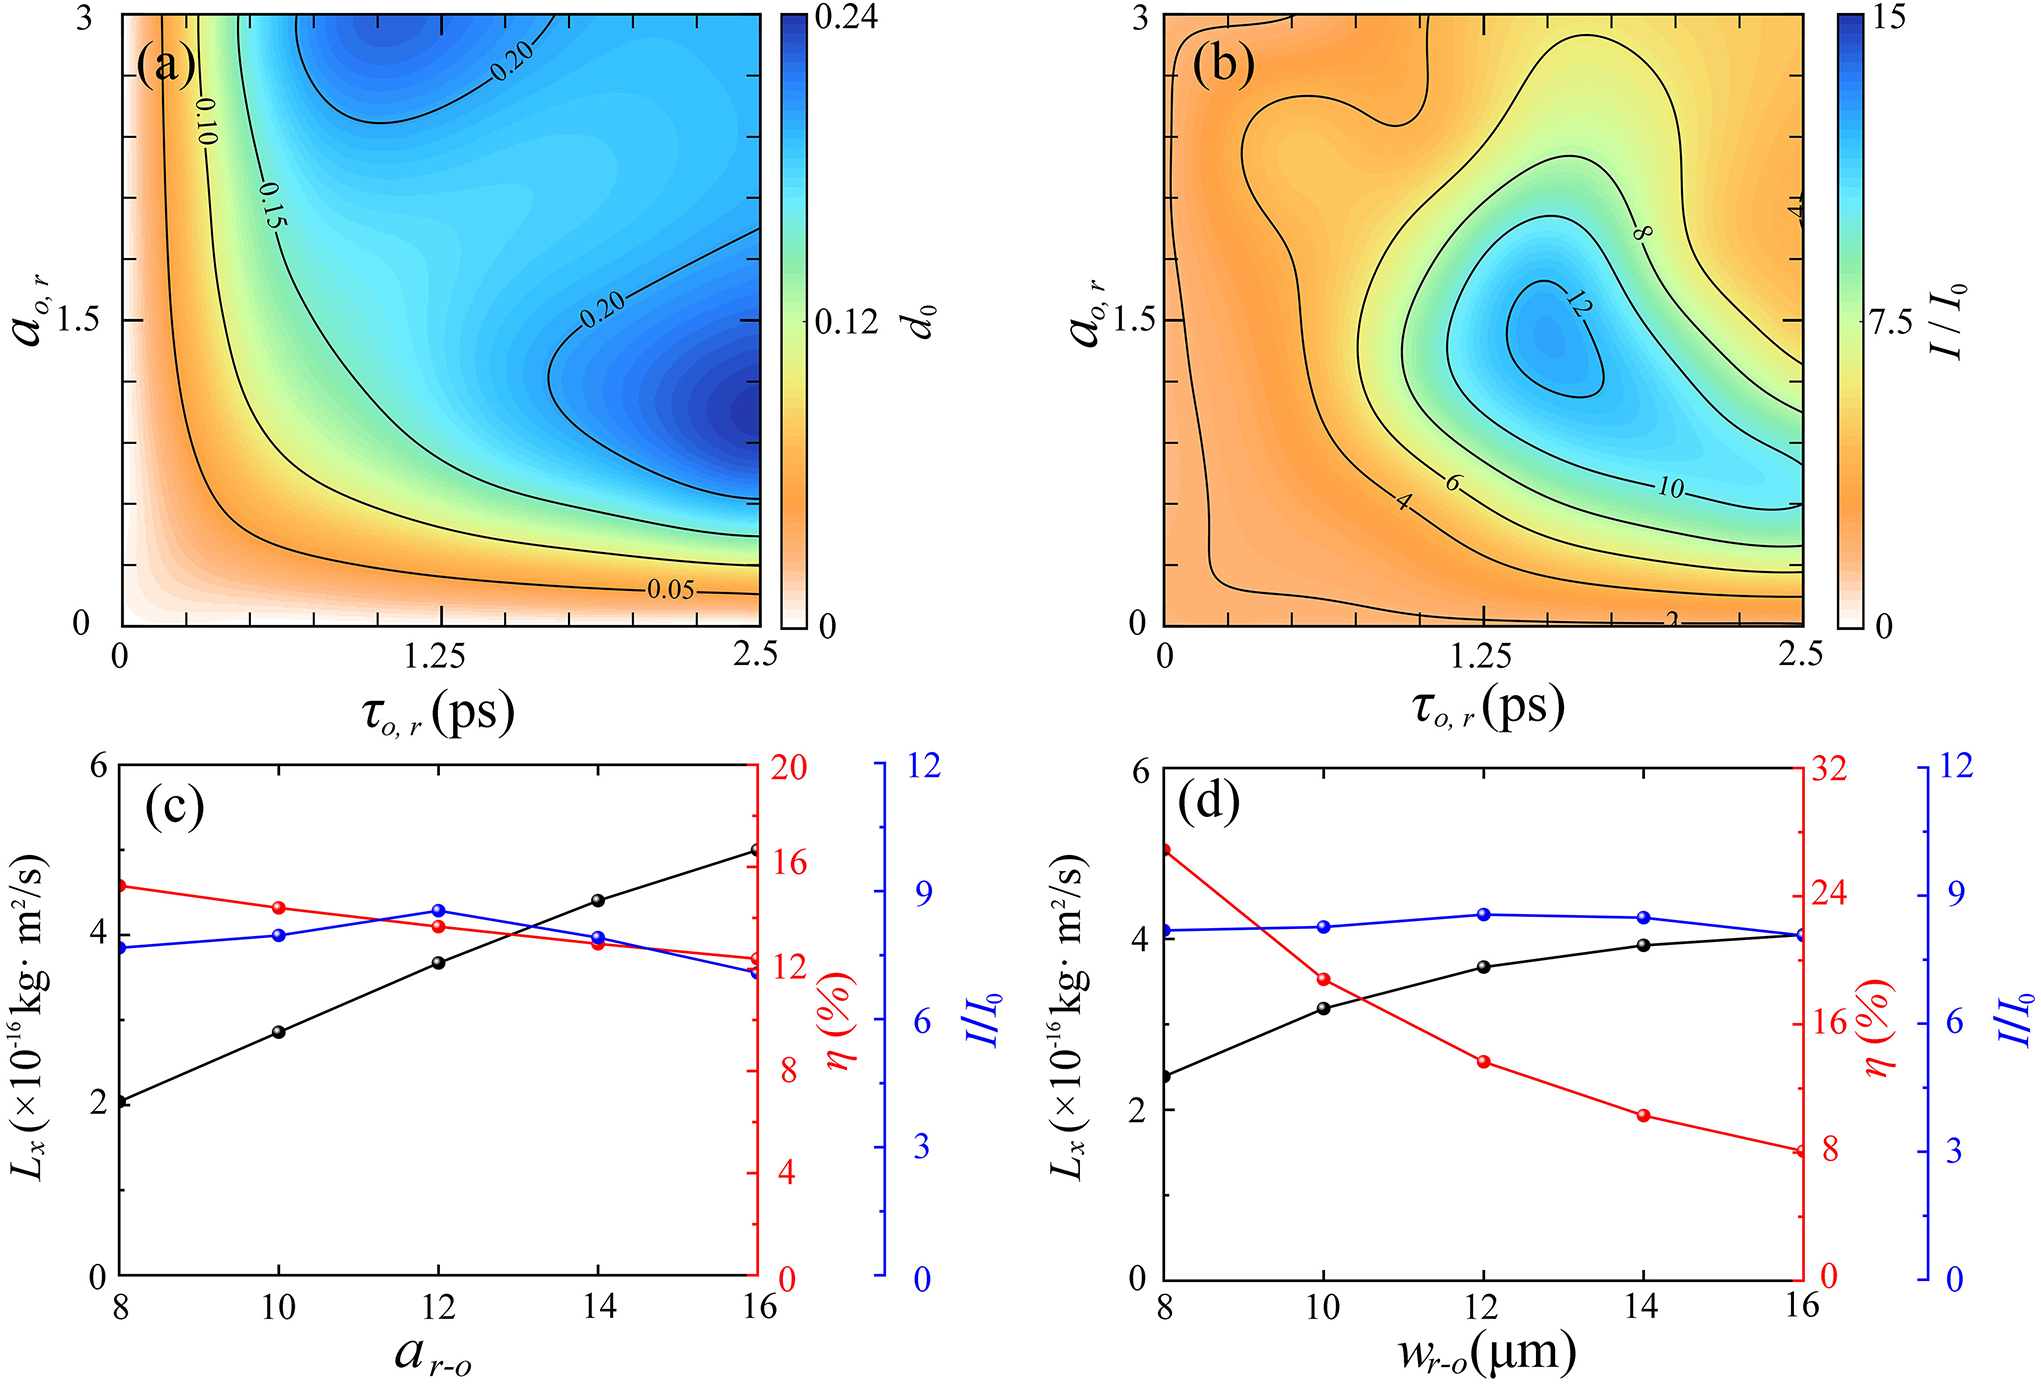
Figure 7 (a) The averaged depth of the SPHs in the ( ${a}_{\mathrm{o,r}}$
,
${a}_{\mathrm{o,r}}$
, ${\tau}_{\mathrm{o,r}}$
) plane. (b) The ratio of output vortex-laser intensity to the incident read-out laser intensity (
${\tau}_{\mathrm{o,r}}$
) plane. (b) The ratio of output vortex-laser intensity to the incident read-out laser intensity ( $I$
/
$I$
/ ${I}_0$
) in the (
${I}_0$
) in the ( ${a}_{\mathrm{o,r}}$
,
${a}_{\mathrm{o,r}}$
, ${\tau}_{\mathrm{o,r}}$
) plane. Scaling of the laser total AM (
${\tau}_{\mathrm{o,r}}$
) plane. Scaling of the laser total AM ( ${L}_x$
, black circles), the energy conversion efficiency to the vortex laser (
${L}_x$
, black circles), the energy conversion efficiency to the vortex laser ( $\eta$
, red circles) and the ratio of output vortex-laser intensity to the incident read-out laser intensity (
$\eta$
, red circles) and the ratio of output vortex-laser intensity to the incident read-out laser intensity ( $I/{I}_0$
, blue circles) (c) with regard to the laser electric field amplitude
$I/{I}_0$
, blue circles) (c) with regard to the laser electric field amplitude ${a}_{\mathrm{r-o}}$
and (d) the focus spot size
${a}_{\mathrm{r-o}}$
and (d) the focus spot size ${w}_{\mathrm{r-o}}$
of the incident read-out laser.
${w}_{\mathrm{r-o}}$
of the incident read-out laser.
We also considered the effects of target material and laser pre-pulses on the SPH formation. As the modulation of target surface plasma is driven by the ponderomotive force of the interference laser and the charge separation fields, the charge-to-mass ratio of ions significantly affects the time required for plasma density modulation. Ions with lower charge-to-mass ratios require a longer modulation time. Taking hydrocarbon targets, for example, a longer duration of laser pulses is required to achieve effective modulation of SPHs (see the Supplementary Material for more details). Since a long-duration interference laser is preferred for the formation of SPHs, the laser pre-pulses effect can thus be ignored, facilitating future experiments. Meanwhile, the expansion of the plasma due to thermal diffusion can be alleviated through multiple measurements during the experimental phase detection process. In addition, we also considered the lifetime of SPHs. After the interference laser leaves the target surface, the surface plasma undergoes an expansion process. Based on the average energy density of surface protons, we calculated the average thermal motion velocity to be approximately $0.001c$
(
$0.001c$
( $0.33\;\unicode{x3bc} \mathrm{m}/\mathrm{ps}$
). Considering that the width of the helical arms of the SPH is approximately
$0.33\;\unicode{x3bc} \mathrm{m}/\mathrm{ps}$
). Considering that the width of the helical arms of the SPH is approximately $3$
$3$ $\unicode{x3bc} \mathrm{m}$
, the theoretically predicted lifetime of the SPH is estimated to be around 10 ps. We increased the delay time of the read-out laser to
$\unicode{x3bc} \mathrm{m}$
, the theoretically predicted lifetime of the SPH is estimated to be around 10 ps. We increased the delay time of the read-out laser to $320{T}_0$
, and the electric field of the reflected vortex laser still exhibited prominent vortex-laser characteristics (see the Supplementary Material for more details).
$320{T}_0$
, and the electric field of the reflected vortex laser still exhibited prominent vortex-laser characteristics (see the Supplementary Material for more details).
Finally, we investigate the effects of the parameters of the read-out laser on the vortex-laser generation. Figure 7(c) shows the scaling of the output vortex-laser AM ( ${L}_x$
, black circles), the energy conversion efficiency to the vortex-laser pulse (
${L}_x$
, black circles), the energy conversion efficiency to the vortex-laser pulse ( $\eta$
, red circles) and the ratio of output vortex-laser intensity to the incident read-out laser intensity (
$\eta$
, red circles) and the ratio of output vortex-laser intensity to the incident read-out laser intensity ( $I/{I}_0$
, blue circles) with regard to the laser electric field amplitude
$I/{I}_0$
, blue circles) with regard to the laser electric field amplitude ${a}_{\mathrm{r-o}}$
. With the increase in amplitude of the read-out laser, the AM of the output vortex laser exhibits an approximately linear growth, while the energy conversion efficiency to the vortex laser decreases approximately linearly. However, the ratio
${a}_{\mathrm{r-o}}$
. With the increase in amplitude of the read-out laser, the AM of the output vortex laser exhibits an approximately linear growth, while the energy conversion efficiency to the vortex laser decreases approximately linearly. However, the ratio $I/{I}_0$
is insensitive to the laser normalized amplitude
$I/{I}_0$
is insensitive to the laser normalized amplitude ${a}_{\mathrm{r-o}}$
. It slightly increases with the increase in
${a}_{\mathrm{r-o}}$
. It slightly increases with the increase in ${a}_0$
before decreasing, reaching its maximum value of
${a}_0$
before decreasing, reaching its maximum value of $8.57$
at
$8.57$
at ${a}_{\mathrm{r-o}}=12$
. In Figure 7(d) the laser spot size is varied from
${a}_{\mathrm{r-o}}=12$
. In Figure 7(d) the laser spot size is varied from ${w}_{\mathrm{r-o}}=8{\lambda}_0$
to
${w}_{\mathrm{r-o}}=8{\lambda}_0$
to $16{\lambda}_0$
, while all other parameters remain unchanged. It is shown that the AM of the output vortex laser increases with the incident laser spot size
$16{\lambda}_0$
, while all other parameters remain unchanged. It is shown that the AM of the output vortex laser increases with the incident laser spot size ${w}_{\mathrm{r-o}}$
. However, the energy conversion efficiency to the vortex laser decreases significantly. This can be attributed to the decreased SPH depth from the
${w}_{\mathrm{r-o}}$
. However, the energy conversion efficiency to the vortex laser decreases significantly. This can be attributed to the decreased SPH depth from the $x$
-axis outward, which makes it inefficient to diffract the peripheral laser. Consequently, the energy conversion efficiency of generating the vortex laser decreases gradually. In addition, the ratio
$x$
-axis outward, which makes it inefficient to diffract the peripheral laser. Consequently, the energy conversion efficiency of generating the vortex laser decreases gradually. In addition, the ratio $I/{I}_0$
is insensitive to changes in the laser spot size, indicating robustness in oblique incidence laser cases.
$I/{I}_0$
is insensitive to changes in the laser spot size, indicating robustness in oblique incidence laser cases.
5 Conclusion
In summary, we demonstrate the generation of SPHs by the interference of a vortex laser and a Gaussian laser on the plasma target surface, and confirm its capability of reconstructing the vortex phase and generating ultra-intense vortex lasers. 3D-PIC simulation results indicate that the generated ultra-intense vortex laser possesses ultra-high intensity ( $1.7\times {10}^{21}$
W/cm
$1.7\times {10}^{21}$
W/cm ${}^2$
), small spot size (
${}^2$
), small spot size ( $\sim 2{\lambda}_0$
) and large AM (
$\sim 2{\lambda}_0$
) and large AM ( $3.67\times {10}^{-16}\,\mathrm{kg}\cdot {\mathrm{m}}^2/\mathrm{s}$
), with an energy conversion efficiency of up to 13.66
$3.67\times {10}^{-16}\,\mathrm{kg}\cdot {\mathrm{m}}^2/\mathrm{s}$
), with an energy conversion efficiency of up to 13.66 $\%$
. It is the first time that such a novel method to retrieve the vortex phase of relativistic vortex lasers has been proposed, which holds critical significance for experimental research on relativistic vortex-laser–plasma interaction. In particular, we demonstrate that plasma can serve not only as a medium for manipulating relativistic intensity laser pulses but also as a detector for precise measurements of the laser phase. This can facilitate future experimental research of vortex-laser–plasma interaction and shall open a new avenue of plasma optics in the ultra-relativistic regime.
$\%$
. It is the first time that such a novel method to retrieve the vortex phase of relativistic vortex lasers has been proposed, which holds critical significance for experimental research on relativistic vortex-laser–plasma interaction. In particular, we demonstrate that plasma can serve not only as a medium for manipulating relativistic intensity laser pulses but also as a detector for precise measurements of the laser phase. This can facilitate future experimental research of vortex-laser–plasma interaction and shall open a new avenue of plasma optics in the ultra-relativistic regime.
Acknowledgement
This work was supported by the National Natural Science Foundation of China (Grant Nos. 12375244, 12305265, 12135009 and 12174047) and the Natural Science Foundation of Hunan Province of China (Grant No. 2025JJ30002).
Supplementary material
The supplementary material for this article can be found at http://doi.org/10.1017/hpl.2025.9.


 Open access