Introduction
Marine mammals, a sentinel group of marine megafauna, are threatened by a plethora of anthropogenic activities, such as chemical and noise pollution, resource depletion, habitat modification/loss, vessel collisions and fishing activities (Baulch & Perry, Reference Baulch and Perry2014; Lauriano et al., Reference Lauriano, Pierantonio, Donovan and Panigada2014; Merchant et al., Reference Merchant, Pirotta, Barton and Thompson2014; Knowlton et al., Reference Knowlton, Robbins, Landry, McKenna, Kraus and Werner2016; Alexiadou et al., Reference Alexiadou, Foskolos and Frantzis2019; Bernaldo De Quirós et al., Reference Bernaldo De Quirós, Fernandez, Baird, Brownell, Aguilar De Soto, Allen, Arbelo, Arregui, Costidis, Fahlman, Frantzis, Gulland, Iñíguez, Johnson, Komnenou, Koopman, Pabst, Roe, Sierra, Tejedor and Schorr2019; Rudd et al., Reference Rudd, Awbery, Waller, Crowe, Bauer, Jacquemart, Nikpaljevic and Akkaya2022). In particular, interactions between fisheries and marine mammals usually stem from depredation (i.e. the removal of catch from fishing gear) and are most likely to take place where spatial overlap between marine mammal distribution and fisheries occurs (Fossa et al., Reference Fossa, Lammers and Orsi Relini2011; Di Tullio et al., Reference Di Tullio, Fruet and Secchi2016; Zappes et al., Reference Zappes, Simões-Lopes, Andriolo and Di Beneditto2016). These interactions entail both direct and indirect threats to the animals, such as injuries and drowning from entanglement in fishing gear (i.e. bycatch), prey depletion and intentional killing as a form of retaliation (Bearzi et al., Reference Bearzi, Politi, Agazzi and Azzellino2006, Reference Bearzi, Fortuna and Reeves2008; Díaz López, Reference Díaz López2006; Gonzalvo et al., Reference Gonzalvo, Giovos and Moutopoulos2015; Revuelta et al., Reference Revuelta, Domènech, Fraija-Fernández, Gozalbes, Novillo, Penadés-Suay and Tomás2018). In addition to that, fishers are also negatively affected by depredation from marine mammals, as a result of damage in fishing gear and catches of lower quality and quantity (Rocklin et al., Reference Rocklin, Santoni, Culioli, Tomasini, Pelletier and Mouillot2009) that eventually lead to economic losses (Gönener & Özdemir, Reference Gönener and Özdemir2012). Since most marine mammals display k-selected life traits, i.e. they are long-lived predators with low reproductive and growth rates and high adult survival, even low levels of disturbance can cause considerable impacts on their populations (Heppell et al., Reference Heppell, Caswell and Crowder2000).
To date, research efforts on marine mammal-fisheries interactions have been directed mostly towards commercial fleets; however, small-scale and artisanal fisheries are equally associated with high levels of fishery-related interactions and need to be investigated further (Jaramillo-Legorreta et al., Reference Jaramillo-Legorreta, Rojas-Bracho, Brownell, Read, Reeves, Ralls and Taylor2007; Mangel et al., Reference Mangel, Alfaro-shigueto, Van Waerebeek, Cáceres, Bearhop, Witt and Godley2010; Moore et al., Reference Moore, Cox, Lewison, Read, Bjorkland, Mcdonald, Crowder, Aruna, Ayissi, Espeut, Joynson-hicks, Pilcher, Poonian, Solarin and Kiszka2010; Reeves et al., Reference Reeves, McClellan and Werner2013). Small-scale fisheries (hereafter termed SSF) utilize vessels smaller than 12 m (European Maritime and Fisheries Fund, Regulation 508/2014) and employ more than 90% of the world's fishers, for subsistence or for income generation (FAO, 2018). Preceding studies have mainly used interviews with fishers, on-board observers or remote electronic monitoring systems to obtain relevant information on fisheries interactions (Bartholomew & Shine, Reference Bartholomew and Shine2008; Moore et al., Reference Moore, Cox, Lewison, Read, Bjorkland, Mcdonald, Crowder, Aruna, Ayissi, Espeut, Joynson-hicks, Pilcher, Poonian, Solarin and Kiszka2010; Bender et al., Reference Bender, Machado, De Azevedo Silva, Floeter, Monteiro-Netto, Luiz and Ferreira2014; Doherty et al., Reference Doherty, Alfaro-Shigueto, Hodgson, Mangel, Witt and Godley2014; Goetz et al., Reference Goetz, Read, Ferreira, Portela, Santos, Vingada, Siebert, Marçalo, Santos, Araújo, Monteiro, Caldas, Riera and Pierce2015; Gonzalvo et al., Reference Gonzalvo, Giovos and Moutopoulos2015; Marcalo et al., Reference Marcalo, Katara, Feijo, Araujo, Oliveira, Santos, Ferreira, Monteiro, Pierce, Silva and Vingada2015; Revuelta et al., Reference Revuelta, Domènech, Fraija-Fernández, Gozalbes, Novillo, Penadés-Suay and Tomás2018). Nonetheless, in most developing countries, where SSF prevail, bycatch rates of marine mammals remain either unknown, underestimated or seriously underreported, while data on fishing effort and marine mammal abundance are often non-existent (Soykan et al., Reference Soykan, Moore, Crowder, Safina and Lewison2008).
The Mediterranean Sea is an enclosed basin with a complex geopolitical situation (Geijer & Jones, Reference Geijer and Jones2015) and it is home to 11 resident cetacean species (Notarbartolo di Sciara & Birkun, Reference Notarbartolo di Sciara and Birkun2010) and the Endangered (EN) Mediterranean monk seal (Monachus monachus Hermann, 1779; hereafter termed monk seals) (Karamanlidis & Dendrinos, Reference Karamanlidis and Dendrinos2015). While the western part has received most of the research effort regarding these predators (Kerem et al., Reference Kerem, Hadar, Goffman, Scheinin, Kent, Boisseau and Schattner2012), the central and eastern parts are left with just 5.6 and 2.1% of the total research effort, respectively (Mannocci et al., Reference Mannocci, Roberts, Halpin, Authier, Boisseau, Bradai, Canãdas, Chicote, David, Di-Méglio, Fortuna, Frantzis, Gazo, Genov, Hammond, Holcer, Kaschner, Kerem, Lauriano, Lewis, Notarbartolo Di Sciara, Panigada, Raga, Scheinin, Ridoux, Vella and Vella2018). Even though the central and eastern parts of the Mediterranean Sea are largely oligotrophic, they host most marine mammal species found in this region. Until recently, the research output regarding the impacts of fisheries on local marine mammal populations originating from these areas was limited (IUCN, 2012), however in more recent years a few studies have addressed marine mammal-fisheries interactions in the region (Snape et al., Reference Snape, Broderick, Çiçek, Fuller, Tregenza, Witt and Godley2018; Karamanlidis et al., Reference Karamanlidis, Adamantopoulou, Kallianiotis, Tounta and Dendrinos2020; Rudd et al., Reference Rudd, Awbery, Waller, Crowe, Bauer, Jacquemart, Nikpaljevic and Akkaya2022). In addition to that, interactions between bottlenose dolphins (Tursiops truncatus Montagu, 1821; hereafter termed bottlenose dolphins) and SSF have been reported from coastal areas of Sardinia, Italy (Díaz López, Reference Díaz López2006; Díaz López & Bernal Shirai, Reference Díaz López and Bernal Shirai2007; Pennino et al., Reference Pennino, Pérez Roda, Pierce and Rotta2016), the Balearic Islands, Spain (Brotons et al., Reference Brotons, Grau and Rendell2008; Gazo et al., Reference Gazo, Gonzalvo and Aguilar2008) and western Greece (Gonzalvo et al., Reference Gonzalvo, Giovos and Moutopoulos2015). Likewise, various forms of interactions between SSF and monk seals have been documented in the Aegean Sea (Güçlüsoy, Reference Güçlüsoy2008b; Ríos et al., Reference Ríos, Drakulic, Paradinas, Milliou and Cox2017) and in the Atlantic coast off Western Sahara, where an important population of the species resides (González & De Larrinoa, Reference González and De Larrinoa2013).
The overarching aim of the present study is to provide an initial assessment of potential SSF–marine mammal interactions along the data-limited Montenegrin, Albanian and Turkish coastlines in the central and eastern Mediterranean Sea, by investigating their spatial co-occurrence. To date, no systematic or long-term studies on SSF–marine mammal co-occurrence have been undertaken in the southern Adriatic and Levantine regions for any of the aforementioned species, despite SSF being the main fishing segment of the Montenegrin (78% – 191 SFF vessels), Albanian (61% – 344 SFF vessels) and Turkish (89% – 13,786 SSF vessels) fishing fleets (Ministry of Agriculture and Rural Development, 2015; OECD, 2021; Bakiu et al., Reference Bakiu, Moutopoulos, Gurma and Çakalli2022). In these regions, SSF vessels lack the Automatic Identification Systems (AIS) or Vessel Monitoring Systems (VMS) that large-scale fishing vessels carry, which severely limits data availability regarding their operations (Witt & Godley, Reference Witt and Godley2007; Dunn et al., Reference Dunn, Jablonicky, Crespo, McCauley, Kroodsma, Boerder, Gjerde and Halpin2018). This data gap, in combination with the high cost of other traditional monitoring methods used to obtain information on fisheries interactions (e.g. on-board observers or remote electronic monitoring systems (REMS); Bartholomew & Shine, Reference Bartholomew and Shine2008; Moore et al., Reference Moore, Cox, Lewison, Read, Bjorkland, Mcdonald, Crowder, Aruna, Ayissi, Espeut, Joynson-hicks, Pilcher, Poonian, Solarin and Kiszka2010; Bender et al., Reference Bender, Machado, De Azevedo Silva, Floeter, Monteiro-Netto, Luiz and Ferreira2014; Doherty et al., Reference Doherty, Alfaro-Shigueto, Hodgson, Mangel, Witt and Godley2014; Goetz et al., Reference Goetz, Read, Ferreira, Portela, Santos, Vingada, Siebert, Marçalo, Santos, Araújo, Monteiro, Caldas, Riera and Pierce2015; Gonzalvo et al., Reference Gonzalvo, Giovos and Moutopoulos2015; Marcalo et al., Reference Marcalo, Katara, Feijo, Araujo, Oliveira, Santos, Ferreira, Monteiro, Pierce, Silva and Vingada2015; Revuelta et al., Reference Revuelta, Domènech, Fraija-Fernández, Gozalbes, Novillo, Penadés-Suay and Tomás2018) creates the need for an alternative approach.
Here, we tested a low-cost, off-the-shelf alternative to traditional vessel tracking methods in order to obtain spatial data on SSF activities. These data were then combined with systematic marine mammal observations originating mainly from low-cost, land-based surveys, to assess the probability of SSF–marine mammal co-occurrence. Specifically, the objectives of this pilot study were (i) to determine and quantify the extent of spatial overlap between fishing activities and marine mammal presence; and (ii) to estimate the probability of co-occurrence. Our study was based on the hypothesis that areas with SSF–marine mammal co-occurrence may entail higher risk of fishery-related impacts on threatened marine mammal species (Fossa et al., Reference Fossa, Lammers and Orsi Relini2011; Di Tullio et al., Reference Di Tullio, Fruet and Secchi2016; Zappes et al., Reference Zappes, Simões-Lopes, Andriolo and Di Beneditto2016). By identifying these zones of co-occurrence and potential interactions, we were able to provide essential baseline information that future studies can build upon. Such information will facilitate future coastal zone management and conservation actions to quantify and reduce the pressure on threatened populations, as well as contribute to the designation of Marine Protected Areas (MPAs) and Fisheries Restricted Areas (FRAs).
Materials and methods
Study sites
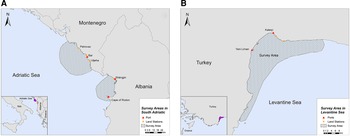
The study was conducted in two locations of the southern Adriatic Sea and one in the Turkish Levantine Sea (Figure 1). The Adriatic Sea is a semi-enclosed water mass, with asymmetrical bathymetry (Blake & Topalović, Reference Blake and Topalović1996), extending to ~138,000 km2 of surface area (Cushman-Roisin et al., Reference Cushman-Roisin, Gacic, Poulain and Artegiani2001), and can be separated into two sub-regions: the north and the south (Geographical Sub-Areas 17 and 18, respectively) (The General Fisheries Commission for the Mediterranean, 2009). The deep, southern sub-basin comprises 55% of the surface area, but ~80% of the total volume of the Adriatic Sea, which is considered a pelagic ocean habitat (Fonda-Umani, Reference Fonda-Umani1996) with high salinity (Cushman-Roisin et al., Reference Cushman-Roisin, Gacic, Poulain and Artegiani2001) and oligotrophic waters (Morand & Briand, Reference Morand and Briand1996). The first selected site was the area around the central and southern Montenegrin coastline, while the second site was the Gulf of Drin in the northern Albanian coastline (Figure 1A). Although the marine fishery has a relatively small contribution to the economy of Montenegro and Albania (FAO – AdriaMed, 2006, 2009), it constitutes a sector of major socio-economic value, as it generates employment opportunities in small coastal communities. Thus, our sampling efforts were focused on (i) the port of Bar in Montenegro and (ii) the ports of Shëngjin and Cape of Rodon in Albania (Supplementary Table S1).
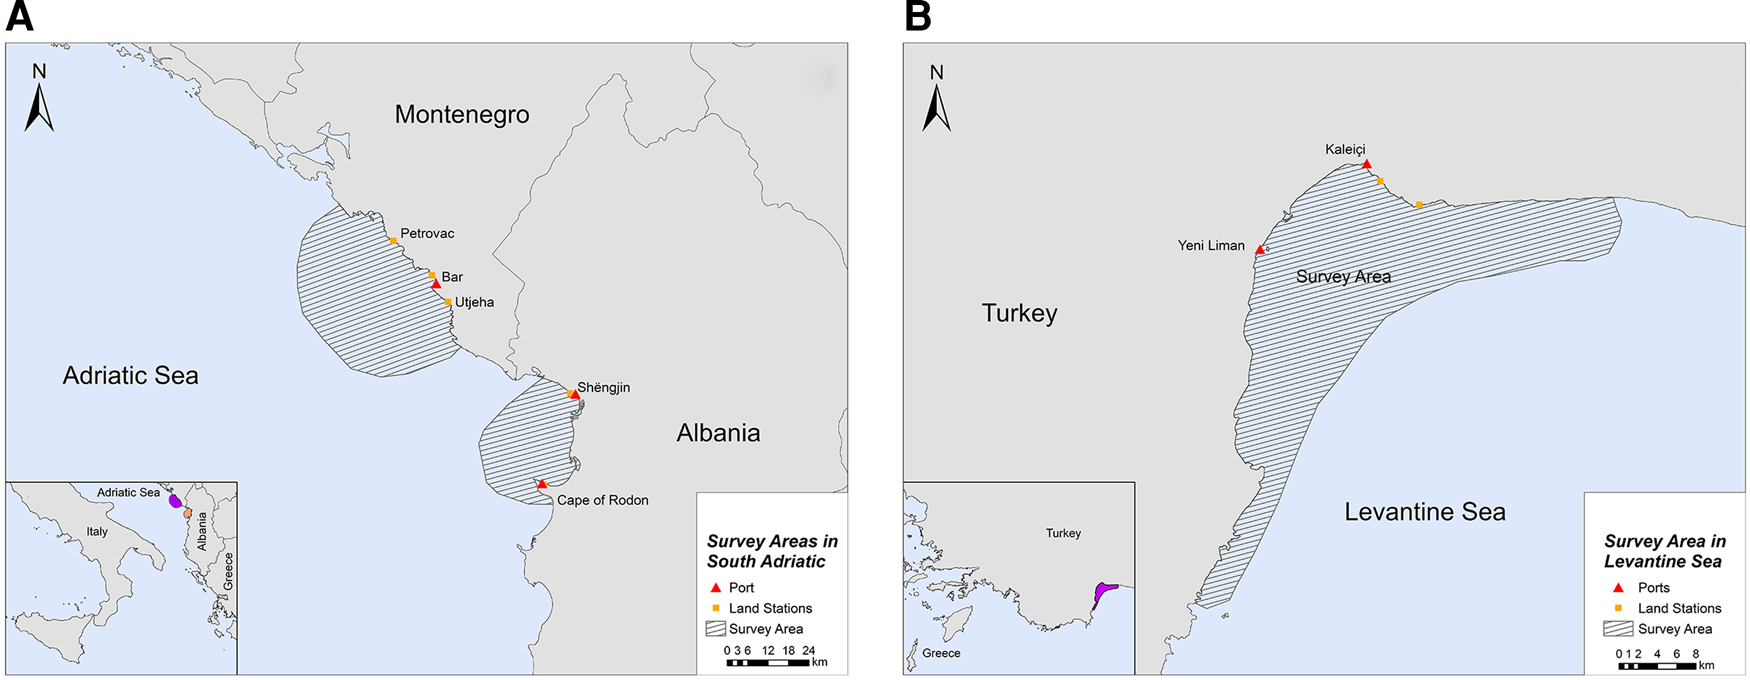
Fig. 1. Study sites in (A) South Adriatic (Montenegro and Albania) and (B) Levantine Sea (Turkey).
The Levantine Sea is the easternmost and warmest part of the Mediterranean Sea, and it is described as one of the most oligotrophic oceanic water bodies in the world both in primary production and in chlorophyll-a concentrations. Antalya Bay is situated in the north-eastern Levantine Sea in the southern Turkish coastline covering an area of ~6500 km2 with a maximum depth of 2600 m and is characterized by high seawater temperature and salinity (Catani et al., Reference Catani, Lenardon, Marchetti, Tunis and Vinci1983). A submarine canyon, known as the Antalya canyon, is the most notable feature of the seafloor topography and stretches from the north-west to the south-east (Tezcan & Okyar, Reference Tezcan and Okyar2006; Özbek et al., Reference Özbek, Kebapç and Çardak2015). Marine fishery plays an important role in the Turkish economy (Yılmaz et al., Reference Yılmaz, Akay and Gumus2008) with the Mediterranean coastline being a major component thereof (FAO, 2008). The northern part of Antalya Bay was chosen as the survey site for this region, where the main hub of fishing activities is located (ports of Yeni Liman and Kaleiçi) (Figure 1B; Supplementary Table S1).
Data collection
To assess the co-occurrence between SSF and marine mammals, we obtained spatial data via two different approaches: (i) installing off-the-shelf GPS loggers onto fishing vessels to track SSF operations; and (ii) collecting land-based and vessel-based observations to obtain marine mammal presence data.
Spatial data on small-scale fishing activity
To collect spatial data on SSF operations, we selected a low-cost, off-the-shelf alternative to traditional vessel tracking methods, based on the methodology of Snape (Reference Snape2019). GPS loggers (iGotU GT600; Mobile Technology; €69 each) were placed on a set sample of fishing boats, after securing permission by the owner of each vessel. Upon this verbal briefing, we were communicated that both fishing grounds and gear type did not change during the year. This held true for the majority of fishers operating in the selected ports, even for those that did not agree to participate in the present study (DMAD – Marine Mammals Research Association, unpublished data). Therefore, a sample size of at least 15% of the total small-scale fishing fleet of each port was deemed representative of fishing habits (Lauriano et al., Reference Lauriano, Caramanna, Scarnó and Andaloro2009). Only vessels that used gillnets were selected, since gillnets are the gear type which is most commonly implicated in marine mammal bycatch (Read et al., Reference Read, Drinker and Northridge2006; Geijer & Read, Reference Geijer and Read2013). This study followed the gillnet definition used by Reeves et al. (Reference Reeves, McClellan and Werner2013) and adopted by the FAO and the International Whaling Commission (IWC), in which the term ‘gillnets’ includes set and fixed gillnets, trammel nets, drift nets and any other unspecified gill or ‘entangling’ net. GPS loggers were sealed in a small waterproof plastic bag with insulation tape and were placed in open areas of the vessel to ensure high quality satellite signal reception. The loggers were pre-programmed to record the position and velocity of the vessel every 5 minutes. When the vessel was idle (e.g. stationed in port), a detector sensitive to motion was activated, so that data logging would switch off. This way data collection could last up to 4 weeks (Snape, Reference Snape2019). Bimonthly trips to the ports were scheduled to extract the data, restore, and recharge the loggers.
Spatial data on marine mammal distribution
Data on marine mammal distribution were amassed via land- and vessel-based observations. Marine mammal individuals were classified in situ to species level. Land surveys were systematically conducted in all study locations, whilst vessel surveys were only conducted in Montenegro and Turkey due to logistical limitations. Surveys were carried out between 2016–2019 in Montenegro, between 2018–2019 in Albania and 2015–2017 in Turkey.
The selection of the inland observation stations was based on optimized field of view in order to increase the sighting events of the marine mammals (Supplementary Table S1). During land-based observations the geographic position of marine mammals was determined via a theodolite (Model: SOKKIA DT5A). The vertical and horizontal angles of target objects were recorded by the observers and, based on the predetermined reference point and azimuth, the theodolite readings were then converted into geographic positions, using the tracking software Pythagoras (version 1.2) (for further details see Awbery et al. Reference Awbery, Nikpaljevic, Clarkson, Abbiss, van der Pouw Kraan, Liebig, Todorovic and Bas2019).
Vessel surveys were carried out along transect lines and took place only when the visibility was >1 nautical mile and the sea state was between 0 and 3 on the Beaufort scale. During surveys, the research vessel maintained a steady speed, averaging at 4 knots. The geographic position of the vessel was recorded every 2 minutes using a GNSS (Global Navigational Satellite System) tracking device and was then transferred into the software Logger 2010 (Marine Conservation Research, 2019). In the occurrence of a sighting, the research vessel approached the focal group slowly to minimize disturbance, with the vessel remaining idle whenever possible. The focal group was observed from a minimum distance of 50 m and maximum distance 400 m. The true coordinates of any observed focal group were calculated using the angle and the distance of the focal group from the vessel (for further details see Awbery et al. Reference Awbery, Nikpaljevic, Clarkson, Abbiss, van der Pouw Kraan, Liebig, Todorovic and Bas2019).
The extent of all survey areas was determined based on the field of view from land stations and vessel transects (Figure 1). Therefore, the range of each survey area represents the total extent of survey effort for each location.
Data analysis
Spatial data on small-scale fishing activity
To select only data points representative of true fishing activity (i.e. deployment and retrieval of gillnets), a criterion of vessel velocity between 0.8 and 4.9 km h−1 was set during post-processing (Burgos et al., Reference Burgos, Gil and Del Olmo2013; Russo et al., Reference Russo, D'Andrea, Parisi and Cataudella2014; De Souza et al., Reference De Souza, Boerder, Matwin and Worm2016). Lower speeds may indicate periods of offshore or in-port inactivity, whilst speeds above this range indicate travelling in-between fishing grounds or to/from port. Filtered fishing activity data were interpolated in ArcGIS v10.7.1 using a Universal Transverse Mercator (UTM) projection. The point data were then converted to line data, with each line representing a fishing event of a specific vessel. Fishing events were defined based on three criteria (adjusted from Snape Reference Snape2019): (a) time between consecutive data points being > 10 min, (b) distance between consecutive data points being > 1 km and (c) time and distance between consecutive data points being <30 min and > 300 m, respectively. Kernel Density Estimation (KDE) was then applied, with a cell size of 200 m and a search radius of 1500 m, to predict hotspots of fishing activity. Additionally, the probability P of fishing activity (P fa) taking place in a grid-cell i relative to other cells in a grid of n cells was calculated following Vanderlaan et al. (Reference Vanderlaan, Taggart, Serdynska, Kenney and Brown2008):
Spatial data on marine mammal distribution
KDE was applied on the marine mammal presence data to predict the density distribution of the sighted species in each survey site. Data points were weighted using group size to avoid the underestimation of marine mammal distribution, while a cell size of 200 m and a search radius of 1500 m was used. For every marine mammal species, the probability P of an individual (P mm) occupying a grid-cell i, relative to other cells in a grid of n cells, was calculated following Vanderlaan et al. (Reference Vanderlaan, Taggart, Serdynska, Kenney and Brown2008):
Spatial overlap and probability of co-occurrence between small-scale fisheries and marine mammals
Spatial overlap between the SSF and marine mammals was illustrated by multiplying the fishing activity raster files with marine mammal distribution, which indicated presence/absence in each grid cell. Per cent area overlap (PAO) was then calculated, using equation (3) (Atwood & Weeks, Reference Atwood and Weeks2003; Di Tullio et al., Reference Di Tullio, Fruet and Secchi2016), where A mm,fa is the overlap area between marine mammals and fishing activities, A mm is the area of marine mammal distribution, and A fa is the area of fishing activities.
Lastly, to estimate the relative probability of co-occurrence in the overlapping areas, we used the following equation (Vanderlaan et al., Reference Vanderlaan, Taggart, Serdynska, Kenney and Brown2008):
where P is the probability of a fishing event and a marine mammal individual, both occupying a grid-cell i relative to other cells in a grid of n cells. This equation has been proven to be effective in estimating the probability of fishery-related interactions with sea turtles (Roe et al., Reference Roe, Morreale, Paladino, Shillinger, Benson, Eckert, Bailey, Tomillo, Bograd, Eguchi, Dutton, Seminoff, Block and Spotila2014).
Results
Spatial data on small-scale fishing activity
Overview of fishing habits
From April to October 2019, spatial data on fisheries operations were collected in all locations. Overall, 8, 11 and 20 fishing vessels were tracked in Montenegro, Albania and Turkey, respectively. The mean number (± SD) of sampling days was 88.6 (± 26.2) in Montenegro, 19.5 (± 2.7) in Albania and 16.9 (± 5.4) in Turkey. Sampling took place between June and October in Montenegro, between May and June in Albania, and between April and May in Turkey. Vessels were tracked 24 h per day. To normalize the uneven survey duration, the frequencies of certain fishing behaviours were calculated (Table 1). The highest fishing activity was recorded in Albania, where a single fishing boat completed 1.01 ‘fishing trips’ per ‘days attached’. This index was equal to 0.65 for Montenegro and 0.33 for Turkey. In both Montenegro and Albania, there were more than one ‘fishing trips’ per ‘days at sea’ (1.3 and 1.35, respectively), while in Turkey this frequency was equal to 0.98, indicating a slight preference for multi-day fishing trips (Table 1). Fishing intensity was expressed as ‘days at sea’ per ‘days attached’, and was highest in Albania (0.75), followed by Montenegro (0.5) and Turkey (0.34) (Table 1). Using this ratio, and assuming that the fishing habits remain relatively stable throughout the year (DMAD, unpublished data), the annual fishing intensity was extrapolated for each site (Table 1).
Table 1. Comparison of fishing activity in all locations
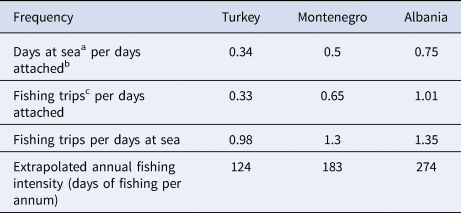
a Day at sea: every calendar day that the fishing boat performed at least one fishing trip.
b Day attached: every calendar day that a GPS logger was attached on a given fishing boat.
c Fishing trip: the departure and subsequent return of a fishing boat, from and to the port in any given location, where there was at least one fishing event present.
Mapping of fishing activities
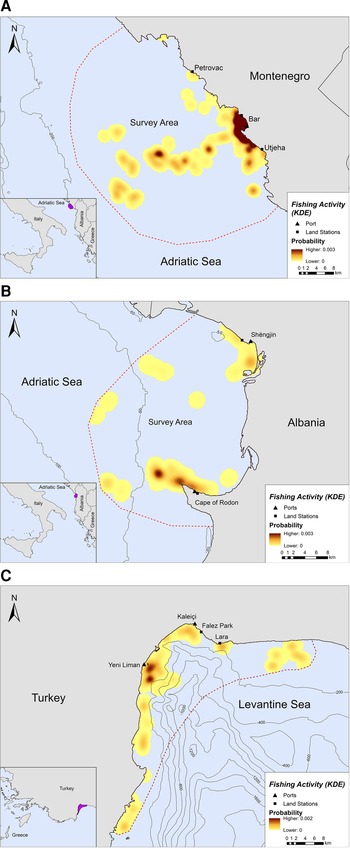
Fishing occurred exclusively within the 200 m bathymetric contour close to the shore, in both Montenegro and Albania (Figure 2A, B). In Montenegro, the main fishing hotspot was located near and around the port of Bar, while high intensity fishing areas were also located further offshore, up to ~21 km from the nearest coast (Figure 2A). Other fishing hotspots were located towards the southern part of the study area, closer to Utjeha (Figure 2A). In Albania, SSF operations rarely extended beyond 6.5 km from the nearest coast (Figure 2B). Certain fishing areas, however, existed further offshore, up to ~19 km from the nearest coast. Three main hotspots of fishing activity were revealed in the Gulf of Drin: (a) in front of the Cape of Rodon cove, which also serves as the landing spot and anchorage for the fishing boats, (b) ~4 km on the west of this cove and (c) on the south of Shengjin port, ~3 km from the Delta of Drin River (Figure 2B).
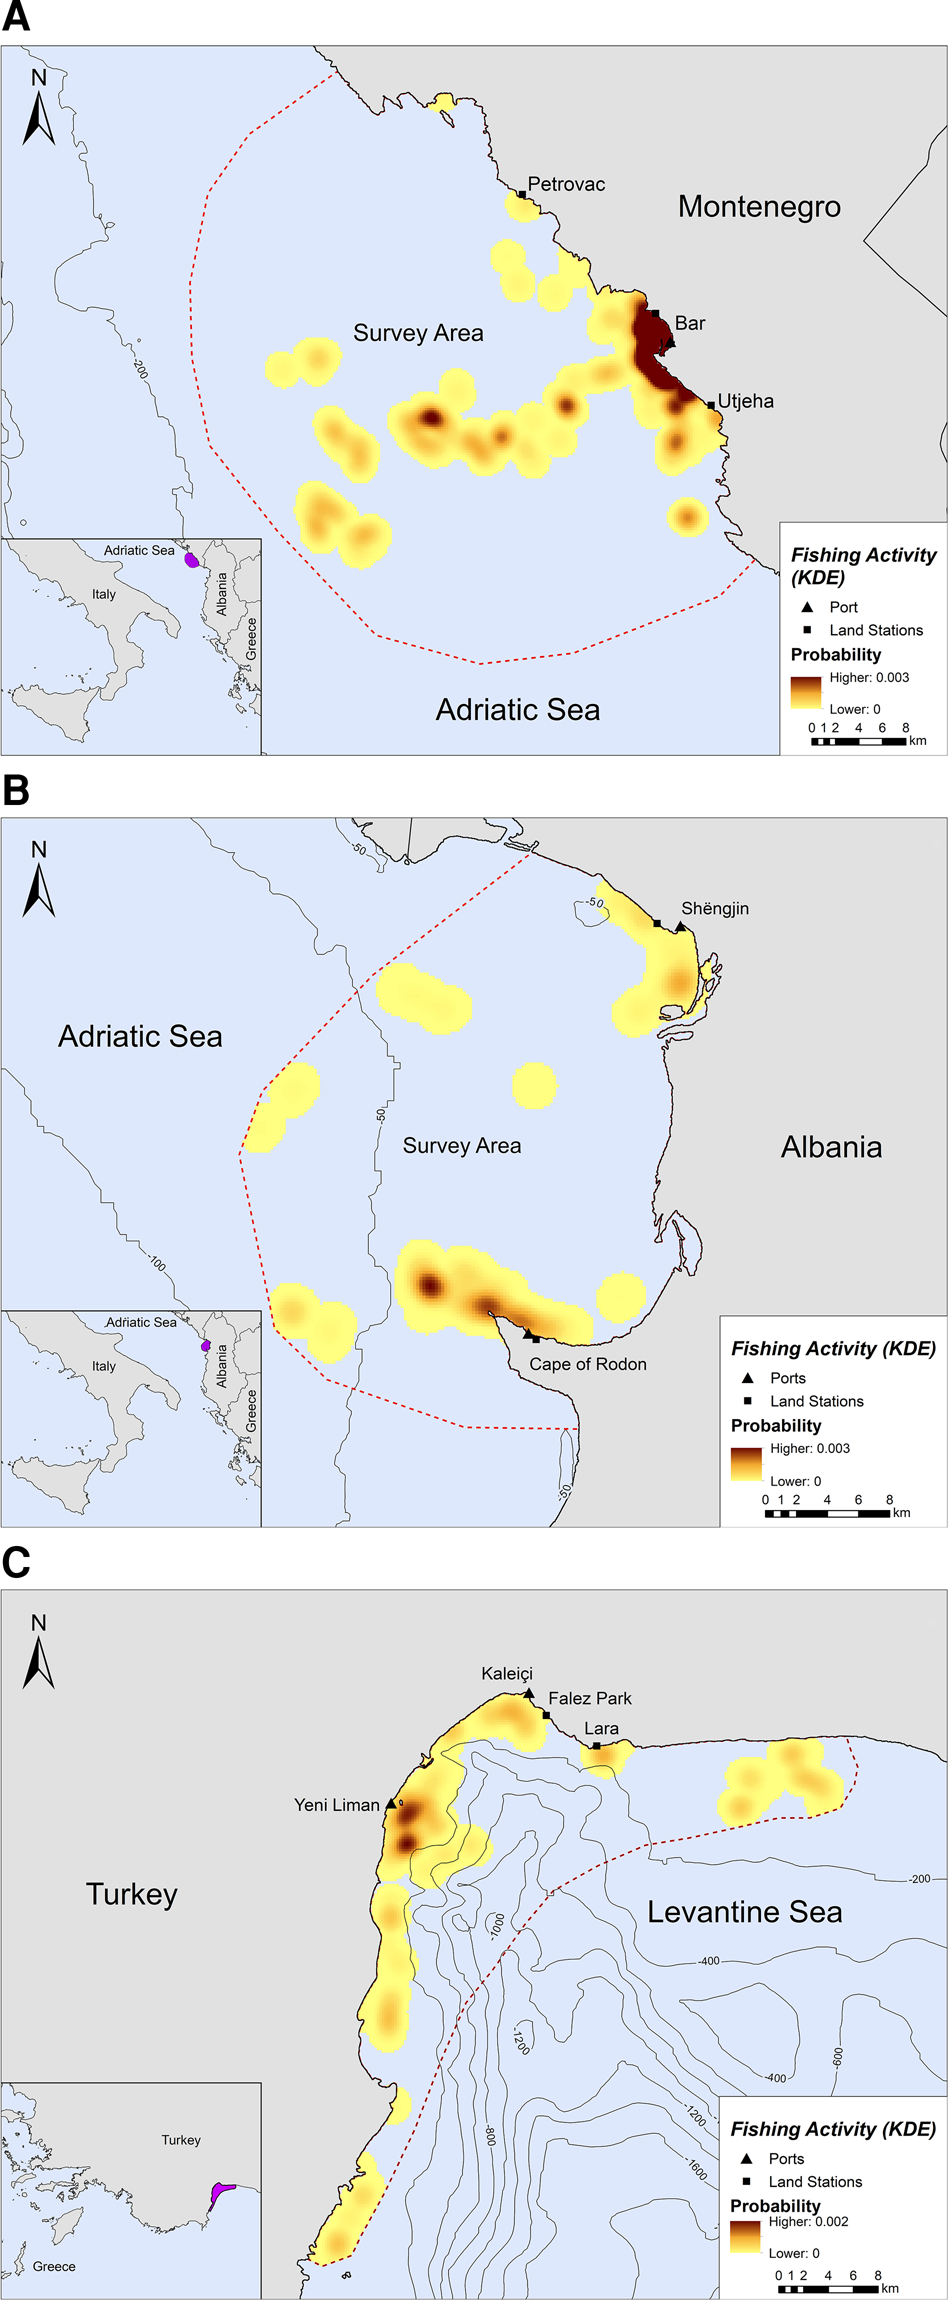
Fig. 2. Kernel density heatmap illustrating the intensity of fishing activities in (A) Montenegro, (B) Albania and (C) Turkey.
Likewise, SSF in Turkey showed a strong preference for coastal waters since they tended to operate mostly along the coastline and were almost never recorded further than ~7 km from the nearest shore (Figure 2C). Most fishing activity occurred within the 200 m bathymetric contour and not more than 5 km away from the nearest shore in Antalya Bay (Figure 2C). Four main fishing hotspots were revealed in Antalya Bay, all within 1–2 km away from the nearest shore: two around Yeni Liman, one close to Kaleiçi and one near Lara beach (Figure 2C).
Spatial data on marine mammal distribution
In total, 422 vessel and land surveys (1427 h 46 m) were carried out in Montenegro (Petrovac, Bar and Utjeha; Supplementary Table S1) over a period of 3 years, between 15 September 2016 and 15 September 2019, with the dominant survey type being land surveys (Supplementary Table S2). In Albania, 20 land surveys (82 h 14 m) were carried out in Cape of Rodon and Shëngjin (Supplementary Table S1) between November 2018 and November 2019 (Supplementary Table S3). Lastly, 133 vessel and land surveys (618 h 26 m) were carried out in Turkey (Antalya Bay; Supplementary Table S1), from March to December of 2015, and between winter, spring and summer of 2016 and 2017 (Supplementary Table S4). Surveys covered daylight hours from all four seasons in all study sites, in an effort to obtain representative samples of marine mammal presence.
Overall, we encountered four marine mammal species during land- and vessel-based surveys year-round: (a) bottlenose dolphins in all locations; (b) striped dolphins (Stenella coeruleoalba Meyen, 1833) in Montenegro and Turkey; (c) Cuvier's beaked whales (Ziphius cavirostris Cuvier, 1823) in Turkey; and (d) monk seals in Turkey. All the observations regarding striped dolphins and Cuvier's beaked whales in Turkey were located in deep waters (> 200 m depth), while in Montenegro there was only one sighting of striped dolphin below 200 m which is atypical for this species (Carwardine, Reference Carwardine2019) (Supplementary Figures S1 and S2). Since SSF activity occurred almost exclusively within the 200 m bathymetric contour, we assumed that neither of these species interact directly with SSF. Therefore, for the purpose of this study, striped dolphins and Cuvier's beaked whales were excluded from further analyses.
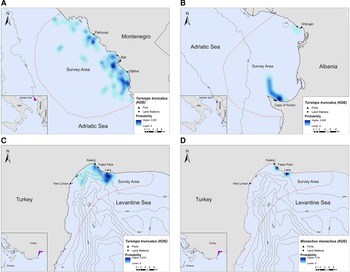
In Montenegro and Albania, the core distribution zones of bottlenose dolphins were located within the 200 m bathymetric contour and within ~16 km and ~6 km from the nearest shore, respectively (Figure 3A, B). In Turkey, bottlenose dolphins had the highest density in the central-north part of Antalya Bay near Lara beach resulting in two different core distribution areas, at ~1.2 and 4 km off the coast, respectively (Figure 3C). Monk seals were observed in shallow waters near the coast, mainly in close proximity to the land stations (Figure 3D).
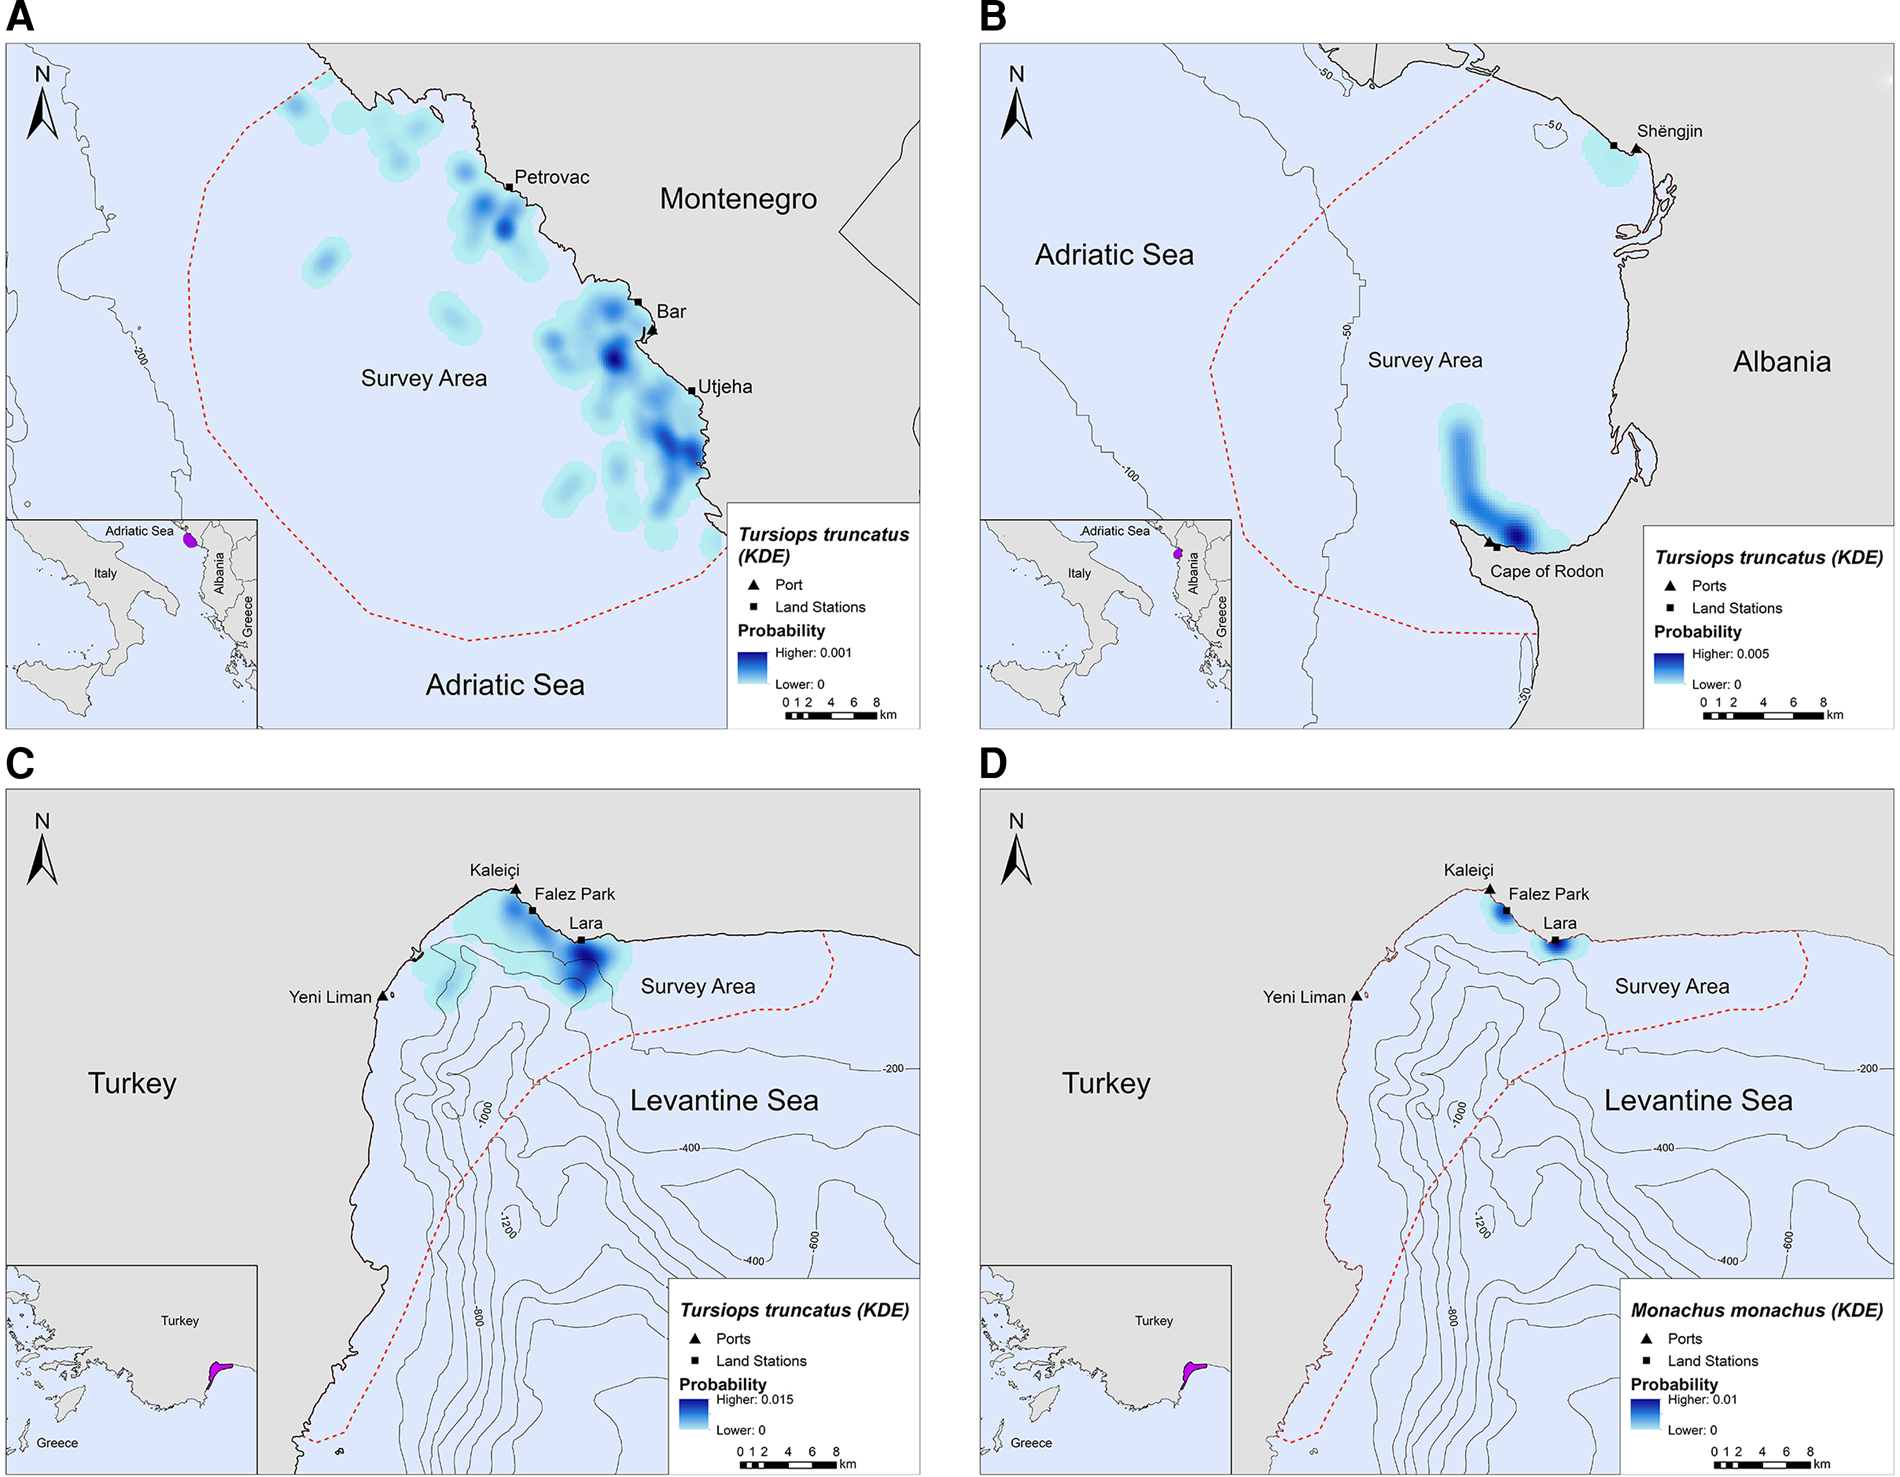
Fig. 3. Kernel density heatmap depicting the distribution of (A) bottlenose dolphins in Montenegro, (B) bottlenose dolphins in Albania, (C) bottlenose dolphins in Turkey and (D) monk seals in Turkey.
Marine mammals and small-scale fishing activity co-occurrence
Per cent spatial overlap (PAO)
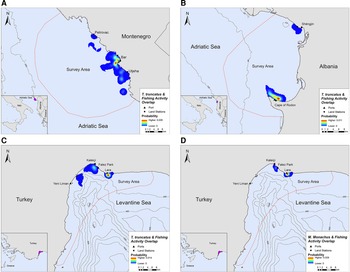
Overlap between SSF and marine mammal distribution was observed in all three locations. The highest PAO values between bottlenose dolphins and fishing SSF were recorded in Montenegro (35.4%), followed by Albania (33.9%) and Turkey (30.3%, Table 2). In Turkey, the PAO value for monk seals and SSF was equal to 21.9% (Table 2). The overlapping areas constitute a visual representation of the critical zones where potential fishery-related interactions may occur, such as bycatch, food depredation and prey depletion (see Figure 4 in the following section).
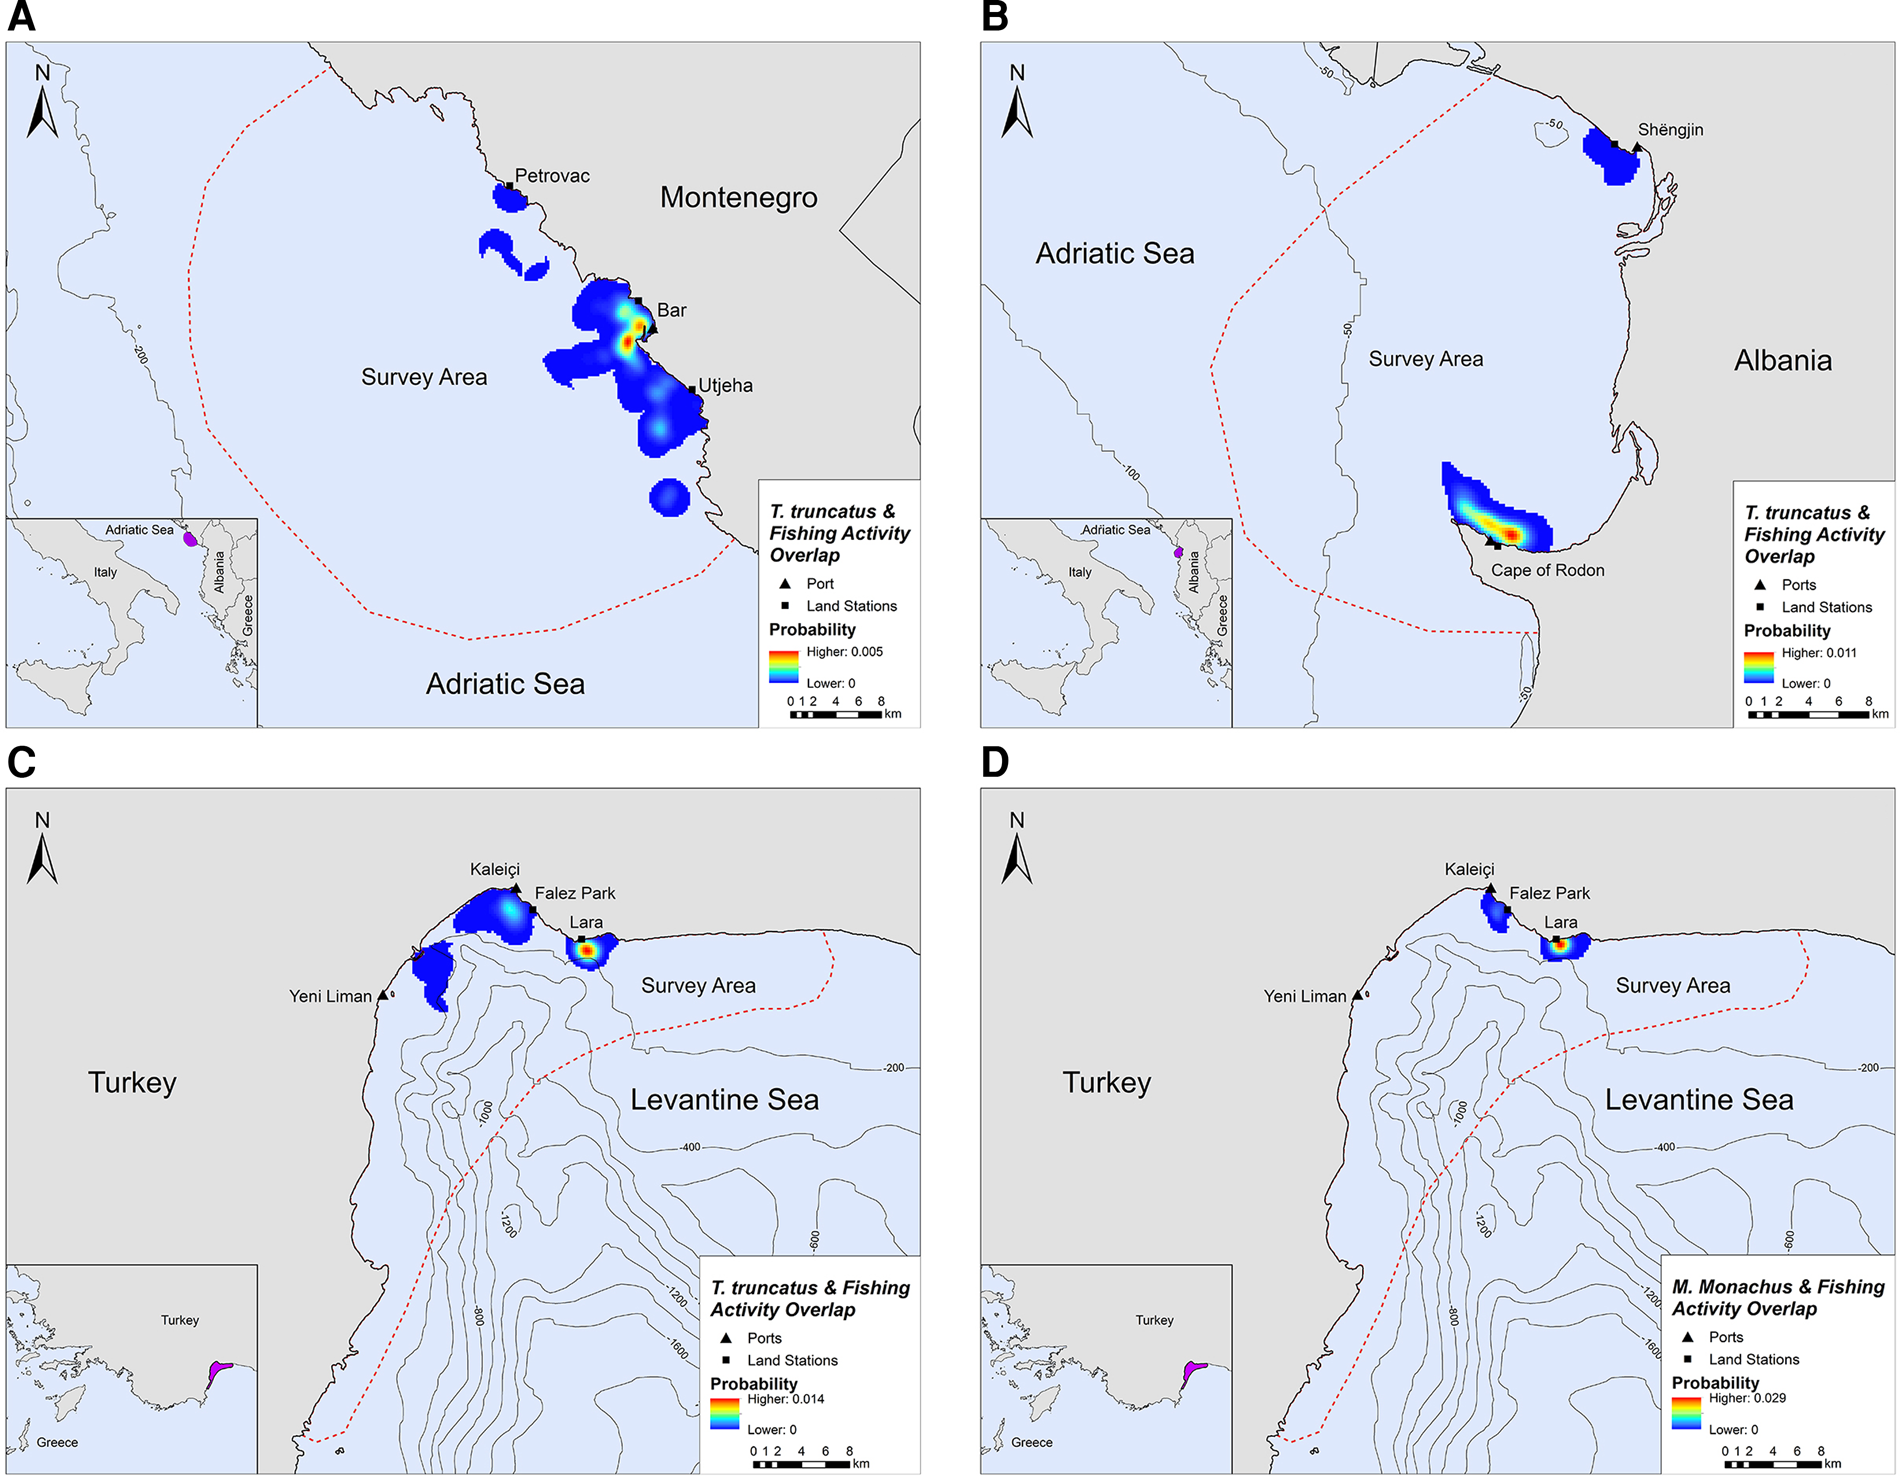
Fig. 4. Areas of spatial overlap between small-scale fishing activity and (A) bottlenose dolphin presence in Montenegro, (B) bottlenose dolphin presence in Albania, (C) bottlenose dolphin presence in Turkey and (D) monk seal presence in Turkey.
Table 2. Percentage of spatial overlap (PAO) between marine mammals and fishing activity, in all locations

Spatial overlap and probability of co-occurrence
Bottlenose dolphins and fishing activity occurred in the same areas along the central Montenegrin coastline, especially in the waters around Bar and Utjeha (Figure 4A). The highest probability of co-occurrence was 0.5% at the two main overlap hotspots close to the port of Bar. In the Gulf of Drin, T. truncatus and fishing activity overlapped around Cape of Rodon and Shëngjin, with the highest presence and activity recorded close to the former (Figure 4B). The peak probability of co-occurrence was 1.1% for this study site. In Turkey, the relative probability of co-occurrence between bottlenose dolphins and fishing activities was higher in two coastal areas in the north of Antalya Bay, reaching a maximum value of 1.4% per 200 × 200 m cell. These areas represent the main co-occurrence hotspots and are located close to Kaleiçi and Lara beach (Figure 4C). For monk seals, the highest relative probability of co-occurrence was 2.9%. The main overlap hotspot was located in front of Lara beach, at the north part of Antalya Bay (Figure 4D). Overall, areas with higher probability of marine mammal–fishery co-occurrence reflect high densities of fishing vessels, marine mammals, or both combined.
Discussion
This study demonstrates how off-the-shelf GPS loggers can be used together with marine mammal distribution data to predict potential interaction areas between SSF and marine mammals. Our approach highlighted spatial overlap between SSF and marine mammals in all three study areas of the central and eastern Mediterranean Sea. Only a handful of studies, so far, have been able to determine spatial overlap between marine fauna and fisheries using similar concepts (Hamer et al., Reference Hamer, Goldsworthy, Costa, Fowler, Page and Sumner2013; Tew Kai et al., Reference Tew Kai, Benhamou, van der Lingen, Coetzee, Pichegru, Ryan and Grémillet2013; Breen et al., Reference Breen, Brown, Reid and Rogan2016; Lucchetti et al., Reference Lucchetti, Pulcinella, Angelini, Pari, Russo and Cataudella2016). To date, no other study has combined marine mammal distribution data with off-the shelf GPS loggers to calculate the spatial overlap and probability of co-occurrence between SSF and marine mammals. Such knowledge is crucial for data-limited regions and may be used to inform future conservation strategies and, ultimately, strengthen current policies regarding coastal zone management, as well as MPAs and FRAs designation.
The GPS methodology in this study demonstrated the feasibility of off-the-shelf technology for tracking SSF and is in line with similar efforts around the world (Alvard et al., Reference Alvard, Carlson and McGaffey2015; Metcalfe et al., Reference Metcalfe, Collins, Abernethy, Boumba, Dengui, Miyalou, Parnell, Plummer, Russell, Safou, Tilley, Turner, VanLeeuwe, Witt and Godley2017; Snape, Reference Snape2019). A strong asset of this cost-effective approach is the greater spatiotemporal resolution of tracking data compared with AIS or VMS used in large-scale fisheries (Snape, Reference Snape2019). Despite recent advancements in the development of low-budget monitoring systems for SSF, the available options still remain too costly (Burgos et al., Reference Burgos, Gil and Del Olmo2013; Chang & Yuan, Reference Chang and Yuan2014). This technique could be deployed in many places with artisanal fisheries to monitor these data-poor communities and develop management and policy strategies. Mean location error (LE) for this GPS model (iGotU GT600) is estimated to be 19.6 m (Morris & Conner, Reference Morris and Conner2017), which is sufficient considering that some GPS devices may show inaccuracy of up to 60 m (Frair et al. Reference Frair, Fieberg, Hebblewhite, Cagnacci, DeCesare and Pedrotti2010). The fine time resolution (< 5 min) used in this study is in line with Snape (Reference Snape2019) and confirms that these loggers can be broadly used for long-term studies of SSF. Despite the manual labour involved in the monthly check-up of the devices and the lack of real-time tracking, their use in future studies is highly recommended, particularly in financially limited regions.
Indeed, the GPS loggers were able to accurately describe the habits of the tracked fishing vessels and provide an insight about the fishing intensity in these areas, as corroborated by personal statements provided by the fishers in Montenegro (DMAD, unpublished data). Montenegrin fishers stated that they fish on average 190.9 days per calendar year, which equals to an annual fishing frequency of ~0.52 (DMAD, unpublished data), similar to the one extrapolated from the GPS loggers (0.50), which adds credibility to our methodology. Based on the observed spatial patterns, fishers tended to operate mainly in coastal shallow waters in all locations, a typical characteristic of SSF (Sini et al., Reference Sini, Vatikiotis, Thanopoulou, Katsoupis, Maina, Kavadas, Karachle and Katsanevakis2019; Snape, Reference Snape2019), which might have negative consequences for marine mammals that occupy this habitat. Indeed, high aggregations of bottlenose dolphins and monk seals were also observed in coastal shallow waters, which is consistent with the ecology of both species (Kiraç et al., Reference Kiraç, Savas, Güçlüsoy and Veryeri2002; Díaz López, Reference Díaz López2006; Bearzi et al., Reference Bearzi, Fortuna and Reeves2012). Yet, the extent of the observed spatial overlap differed among locations and marine mammal species. Specifically, the highest overlap between SSF activities and bottlenose dolphins was calculated in Montenegro and the lowest in Turkey. The different fishing habits observed in each location may explain this variation; in Turkey, the fishing intensity (expressed as ‘days at sea’ per ‘days attached’) was much lower (0.34) than in the other two sites (>0.5). However, the seafloor topography in this area limits SSF to a narrow corridor close to the coast leaving fishers with a smaller area to exploit. In more structured environments, fishing effort is more likely to be concentrated in specific zones where targeted species are found (Medley et al., Reference Medley, Gaudian and Wells1993). This, in turn, may increase the conflict between SSF and marine mammals since both compete for the same resources, as shown by the increased probability of co-occurrence in Antalya Bay. Conversely, in Montenegro and Albania, fishing boats could spread out further offshore, covering a larger part of the survey area, which may explain the higher spatial overlap with bottlenose dolphins in these locations.
The spatial extent of overlap was not always analogous with the estimated probability of co-occurrence. For instance, bottlenose dolphins in Montenegro exhibited the highest area of spatial overlap with SSF, but only the lowest probability of co-occurrence. Therefore, even though the area where interactions may occur was larger, these interactions were overall less likely to take place. This result highlights the importance of quantifying the presumed interactions. In the current study, depending on the location and the marine mammal species, the highest probabilities of co-occurrence, which indicated potential interactions, were seemingly low, ranging from 0.5–2.9%. Other studies with similar methodology found maximal interaction probabilities of 7.5% (Vanderlaan et al., Reference Vanderlaan, Taggart, Serdynska, Kenney and Brown2008) and 5.4% (Roe et al., Reference Roe, Morreale, Paladino, Shillinger, Benson, Eckert, Bailey, Tomillo, Bograd, Eguchi, Dutton, Seminoff, Block and Spotila2014). Both studies though had higher survey effort and used a lower spatial resolution for the analysis. Consequently, the lower values in the present study may be linked to the high spatial resolution (200 × 200 m), as the examined study area was significantly smaller than those of Roe et al. (Reference Roe, Morreale, Paladino, Shillinger, Benson, Eckert, Bailey, Tomillo, Bograd, Eguchi, Dutton, Seminoff, Block and Spotila2014) and Vanderlaan et al. (Reference Vanderlaan, Taggart, Serdynska, Kenney and Brown2008). Analyses with a higher resolution allow for maintaining fine-scale information, while significantly reducing the risk of overestimation (Amoroso et al., Reference Amoroso, Pitcher, Rijnsdorp, Mcconnaughey, Parma, Jenkins, Jonsson, Kainge, Kangas, Kathena, Kavadas, Leslie, Lewis, Lundy, Makin, Martin, Mazor, Gonzalez-Mirelis, Newman, Papadopoulou, Posen, Rochester, Russo, Sala, Semmens, Silva, Tsolos, Vanelslander, Wakefield, Wood, Hilborn, Kaiser and Jennings2018).
Overall, low probabilities of co-occurrence should theoretically indicate a low risk of negative interactions between SSF and marine mammals; however, such probabilities need to be interpreted in the context of variables related to each species or population (i.e. population size, life-history parameters) and the existence of synergetic threats. The case studies in this work represent populations that may be affected differently when considering the biology and ecology of each subpopulation (Wallace et al., Reference Wallace, Heppell, Lewison, Kelez and Crowder2008). The Mediterranean subpopulation of the bottlenose dolphin is listed as ‘Vulnerable’ in the IUCN Red List with a declining population trend, while the population of the Mediterranean monk seal falls under the ‘Endangered’ category (Karamanlidis et al., Reference Karamanlidis, Androukaki, Adamantopoulou, Chatzispyrou, Johnson, Kotomatas, Papadopoulos, Paravas, Paximadis, Pires, Tounta and Dendrinos2008; Bearzi et al., Reference Bearzi, Fortuna and Reeves2012). Given their threatened status, it is likely that even low probabilities of co-occurrence may have a significant impact on local populations and in no case should they be considered negligible and reassuring (Heppell et al., Reference Heppell, Caswell and Crowder2000). Prey depletion and incidental catches are currently the primary threats to bottlenose dolphins in the Mediterranean Sea (Bearzi et al., Reference Bearzi, Fortuna and Reeves2012). Bycatch in set nets has been previously documented close to coastal areas (Palka & Rossman, Reference Palka and Rossman2001; Díaz López, Reference Díaz López2006; Brotons et al., Reference Brotons, Grau and Rendell2008), and in at least some locations, bycatch mortality is unsustainable (Brotons et al., Reference Brotons, Grau and Rendell2008). Moreover, prey depletion due to overexploited fishing stocks has been argued as one possible cause for low abundances of bottlenose dolphins in the Adriatic and Ionian Seas (Bearzi et al., Reference Bearzi, Fortuna and Reeves2012). Another severe threat to bottlenose dolphins is depredation, which, despite its potential benefits to the animals, may ultimately have devastating consequences, such as larynx strangulation due to parts ingested from fishing gear (Gomerčić et al., Reference Gomerčić, Galov, Gomerčić, Škrtić, Ćurković, Lucić, Vuković, Arbanasić and Gomerčić2009). Similarly, incidental catches of monk seals in gillnets constitute a major threat for the species and have been reported from various locations throughout its distribution range (Karamanlidis et al., Reference Karamanlidis, Androukaki, Adamantopoulou, Chatzispyrou, Johnson, Kotomatas, Papadopoulos, Paravas, Paximadis, Pires, Tounta and Dendrinos2008; González & De Larrinoa, Reference González and De Larrinoa2013). Depredation has also been documented as a considerable indirect threat to monk seals (Ríos et al., Reference Ríos, Drakulic, Paradinas, Milliou and Cox2017). Considering their fragmented population, which numbers ~350 individuals in the eastern Mediterranean Sea (Karamanlidis et al., Reference Karamanlidis, Dendrinos, de Larrinoa, Gücü, Johnson, Kiraç and Pires2016), it is highly likely that even limited interactions with SSF may exert significant pressure on the species. However, fishers may equally suffer moderate to severe economic losses due to their gear being damaged by depredation (Lauriano et al., Reference Lauriano, Fortuna, Moltedo and Notarbartolo di Sciara2004; Read, Reference Read2008; Ríos et al., Reference Ríos, Drakulic, Paradinas, Milliou and Cox2017). This conflict has historically led fishers to shoot or harass animals as a form of retaliation (Notarbartolo di Sciara & Bearzi, Reference Notarbartolo di Sciara and Bearzi2002).
Limitations
With incidental catches being a major threat for both bottlenose dolphins and monk seals in the Mediterranean, developing a protocol to calculate bycatch risk is of central importance in the mitigation of this issue (Güçlüsoy, Reference Güçlüsoy2008b; Bearzi et al., Reference Bearzi, Fortuna and Reeves2012). In our study, quantitative data regarding actual bycatch rates were absent in all sites, thereby the depicted overlapping areas are only indicative. To properly estimate bycatch risk, data on the number of set gillnets that are deployed during fishing activity and the capture rates (animals per set net) are also needed (Roe et al., Reference Roe, Morreale, Paladino, Shillinger, Benson, Eckert, Bailey, Tomillo, Bograd, Eguchi, Dutton, Seminoff, Block and Spotila2014). Nonetheless, using our methodology, we were able to complete the first step of this process by identifying areas with spatial overlap, which may represent potential interaction zones. The lack of equal survey effort among the different study areas, as well as the unbalanced sampling strategy for SFF, also inhibits to some extent the possibility of an accurate comparison among them, since there is uncertainty as to what are the true reasons behind a given difference. Further limitations stem from the short duration of monitoring SSF activities, as there was a temporal offset between SSF tracking and marine mammal surveys. Nevertheless, the majority of fishers in all ports (both those who accepted to participate and those that did not), stated that their fishing habits (i.e. fishing grounds and gear) remained unchanged throughout the year (DMAD, unpublished data). Therefore, considering the year-round presence and site-fidelity of both marine mammal species (Boulva, Reference Boulva1979; Forcada et al., Reference Forcada, Hammond and Aguilar1999; Gonzalvo et al., Reference Gonzalvo, Forcada, Grau and Aguilar2014; Akkaya et al., Reference Akkaya, Lyne, Schulz, Awbery, Capitain, Rosell, Yıldırım, İlkılınç, Relva and Clark2020), we may infer that the absence of temporal overlap between survey efforts did not affect our results. This, in combination with the opportunistic nature of their diet (Bearzi et al., Reference Bearzi, Fortuna and Reeves2008; Güçlüsoy, Reference Güçlüsoy2008a), may still lead to depredation and other forms of interaction throughout the year, even though the target species of SSF may shift.
Implications
Considering the paucity of information on SSF and marine mammal interactions globally, the development of a standardized method for assessing spatial overlap is of central importance to marine mammal and fisheries science. Apart from being replicable on a larger spatiotemporal scale, a standardized methodology will also allow for direct comparisons between different studies and regions. The application of our methodology on a local scale may also contribute to new regulations being proposed regarding the intensity of SSF activities in heavily exploited areas. Conversely, by implementing our methodology on a regional scale, temporal or spatial restrictions of fishing activities may be proposed in an ultimate effort to designate MPAs and FRAs, as well as reduce the pressure on threatened species. Besides that, and irrespective of the extent of the study, it is vital that a mutually beneficial relationship will be established between fishers and marine mammals by providing financial aid to the fishers in cases of gear damage, as well as raising awareness about marine mammals to recognize their central ecological role. In this context, a collaborative approach with the fishers should be developed, increasing their willingness to report bycatch events, getting them involved in reporting on occurrences of interactions, and ultimately establishing a reporting system.
Conclusions
This study demonstrated that off-the shelf GPS loggers offer an efficient and inexpensive way to monitor SSF activity and, when combined with marine mammal distribution data, to identify areas of marine mammal–fisheries overlap. Data from both these loggers and marine mammal surveys provided baseline information on the probability of co-occurrence of SSF and two threatened marine mammal species in the data-deficient regions of the South Adriatic and Levantine Seas. What is equally important is that our approach can be used to obtain valuable and often missing information on SSF activities, particularly in data-poor areas. Numerous constraints narrow the conclusions that can be drawn from the present analyses, and further research is needed to refine the methodology and create a replicable protocol that can be applied at a larger spatiotemporal scale. The proposed methodology is strongly recommended for future studies, although attention should be paid to the selection of a reliable GPS model. Our approach provides a solid alternative to traditional observation methods, such as on-board observers, which can often be costly and hard to implement on a large scale, particularly in developing countries. By incorporating the proposed suggestions, researchers will possess a useful tool for acquiring insight into SSF co-occurrence with species of concern, in data-deficient and financially constrained regions, with the overarching aim of setting the ground for strengthening management strategies.
Supplementary material
The supplementary material for this article can be found at https://doi.org/10.1017/S0025315422000522.
Acknowledgements
All data used in this study belong to DMAD – Marine Mammals Research Association. We thank all the volunteers and interns at DMAD and the Montenegro Dolphin Research for assisting with data collection. We also thank all fishers who agreed to cooperate with us and specifically the Fishery Cooperative of Yeni Liman in Antalya Bay, Turkey. Lastly, we would like to thank the two anonymous reviewers and Ilias Foskolos for their valuable input during manuscript revision.
Author contributions
Conceptualization: MG, GK, AA and CG; Methodology: MG, GK, AA and CG; Validation: MG, GK, AA and CG; Formal analysis: MG and GK; Investigation: MG, GK, AA, KB, NN and TA; Resources: MG, GK, AA, NN and TA; Data curation: MG, GK, AA, NN and TA; Writing – original draft preparation: MG and GK; Writing – review and editing: MG, GK, AA, KB, NN, TA, RB and CG; Visualization: MG and GK; Supervision: AA, RB and CG; Project administration: CG; Funding acquisition: MG, GK, AA and NN. All authors have read and agreed to the submitted version of the manuscript.
Financial support
MG received funding from the Department of Ecology, Environment and Plant Sciences, Stockholm University. GK was funded by the Erasmus + Programme of the European Union. DMAD – Marine Mammals Research Association was funded by WWF-Turkey, the MAVA Foundation and the Rufford Foundation. The APC was funded by Stockholm University.
Conflict of interest
The authors declare no conflict of interest. The funders had no role in the design of the study, in the collection, analyses, or interpretation of data, in the writing of the manuscript, or in the decision to publish the results.


