The common mental health problems of anxiety and depression are leading causes of disability (Reference ÜstünÜstün, 1999). Compared with pharmacotherapy, cognitive–behavioural therapy is as effective in the short term and, in the long term, sometimes superior (Reference Watkins, Williams and CheckleyWatkins & Williams, 1998). Even in severe depression, cognitive–behavioural therapy matches medication in terms of efficacy (Reference DeRubeis, Gelfand and TangDeRubeis et al, 1999). Patients prefer psychological treatments (Reference TyleeTylee, 2001); however, therapist shortages engender unacceptable waiting times (Clinical Standards Advisory Group, 1999), necessitating alternatives to one-to-one treatment delivery (Reference Lovell and RichardsLovell & Richards, 2000) beyond the existing adjunctive use of self-help materials (Reference Keeley, Williams and ShapiroKeeley et al, 2002). In a previous study (Reference Proudfoot, Goldberg and MannProudfoot et al, 2003) we established the efficacy of an eight-session interactive, multimedia computerised cognitive–behavioural therapy package, Beating the Blues. In an expanded data-set we now investigate interactions of this therapy with clinical, demographic and setting variables, and again demonstrate its efficacy. An economic analysis is reported in a companion paper (Reference McCrone, Knapp and ProudfootMcCrone et al, 2004, this issue).
METHOD
Study sample
The study population consisted of general practice patients aged 18–75 years suffering from depression, mixed anxiety and depression or anxiety disorder (including phobias or panic), not currently receiving any form of psychological treatment or counselling, who scored 4 or more on the 12-item General Health Questionnaire (GHQ–12; Reference GoldbergGoldberg, 1972) and 12 or more on the computerised version of the Clinical Interview Schedule – Revised (CIS–R), developed by Lewis (Reference Lewis1994) as the Programmable Questionnaire System (PROQSY). Patients were excluded if they had active suicidal ideas; a current or lifetime diagnosis of psychosis or organic mental disorder, or alcohol and/or drug dependence; had been taking medication for anxiety and/or depression continuously for 6 months or more immediately prior to entry; were unable to attend eight sessions at the surgery; or were unable to read or write English. Recruitment took place in general practices in London and south-east England. Patients were identified by their general practitioner or by screening with the GHQ. Patients were approached for screening while they sat in the waiting room, or if the medical records indicated that they had a current prescription of antidepressant medication that was less than 6 months old. Patients who scored above the cut-off of 4 on the GHQ were seen by the general practitioner, who administered the inclusion and exclusion criteria, decided whether medication was to be prescribed, and indicated the treatment the patient was to receive if randomly allocated to treatment as usual. A total of 502 patients were assessed by their general practitioners as meeting the inclusion criteria and were invited to complete the computerised CIS–R, with a view to participating in the study. (The number of patients assessed for eligibility was unknown for two practices.) Of these, 96 scored below the CIS–R threshold of 12. Of the remaining 406 patients, 132 declined to participate, leaving 274 who commenced the trial. These patients were referred to the practice nurse for randomisation. The method of randomisation has been fully described by Proudfoot et al (Reference Proudfoot, Goldberg and Mann2003). The study was approved by the ethics committee of the Institute of Psychiatry and the South Thames multicentre and local research ethics committees.
Treatment
Beating the Blues (Ultrasis; http://www.ultrasis.com) is an interactive, multimedia, computerised cognitive–behavioural therapy package consisting of a 15 min introductory videotape, followed by eight therapy sessions (Fig. 1). Each weekly session lasts about 50 min, with ‘homework’ projects between the sessions. Sessions and homework projects are customised to the patient's specific needs and each session builds on the one before. A report of the patient's progress, including whether the patient has expressed any suicidal intent, is printed out for the patient and the general practitioner at the end of each session. As part of the research protocol, a practice nurse checked that the patient had logged on successfully at the beginning of each session. The nurse then left the room, having indicated where she was to be found if something went wrong (for example, if the patient had difficulties with the program, or the printer ran out of paper). At the end of the session, the nurse checked that the patient had the necessary print-outs (session summary, homework tasks and progress report) and booked the next session. Nurses were instructed to spend no more than 5 min with each patient at the start and at the end of each session (i.e. up to a total of 80 min over the eight sessions). Patients randomised to the computerised therapy could also receive pharmacotherapy if the general practitioner wished to prescribe it, and/or general support and practical or social help, but not face-to-face counselling or psychological intervention. Patients allocated to usual treatment received whatever therapy the general practitioner prescribed. In order to replicate natural conditions in primary care, we did not randomise drug treatments, nor did we constrain the interventions received by patients allocated to usual treatment. The latter included (besides any medication, discussion of problems with the doctor, provision of practical and social help and further physical investigation available also to the intervention group) referral to a counsellor, practice nurse or mental health professional (psychologist, psychiatrist, community psychiatric nurse or counsellor).
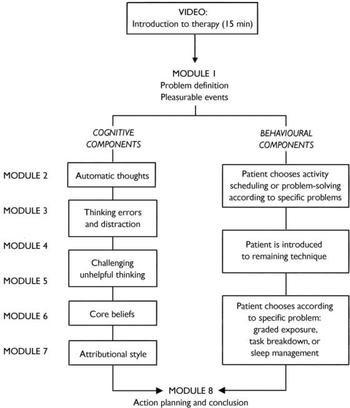
Fig. 1 Structure of the Beating the Blues cognitive –behavioural therapy program.
Response variables
Each of the following four instruments was administered on five occasions throughout the trial: pre-treatment, 2 months later (following completion of the 9-week therapy program) and at three follow-up assessments, 1 month, 3 months and 6 months later.
The primary outcome measure was the Beck Depression Inventory II (BDI; Reference Beck, Steer and BrownBeck et al, 1996). This is an established 21-item measure of depression. The internal consistency, measured by Cronbach's α at pre-treatment in our data-set, was 0.88.
The Beck Anxiety Inventory (BAI; Reference Beck and SteerBeck & Steer, 1990) is a 21-item symptom checklist rated on a four-point scale (0–3). The internal consistency of the scale at intake in this study was 0.88.
The Work and Social Adjustment Scale (WSA; Reference Mundt, Marks and ShearMundt et al, 2002) measures the degree to which the patient's problems interfere with ability to work, home management, social life, private leisure and relationships. Each of the five indices is measured by a single-item Likert scale of 0 to 8 with 8 indicating severe impairment. The overall scale had an internal consistency of 0.85 in this study.
The Attributional Style Questionnaire (ASQ; Reference Peterson, Semmel and Von BaeyerPeterson et al, 1982) presents six negative and six positive hypothetical situations, for which respondents are asked to supply a cause and then rate their cause along three attributional dimensions. Scoring of the questionnaire yields a composite index for the negative situations (CoNeg) and one for the positive situations (CoPos). In this study, α=0.77 for CoNeg and α=0.66 for CoPos.
A fifth measure, satisfaction with treatment, was administered 2 months after randomisation. It was measured with a single item, ‘How satisfied are you with the treatment you have had for your anxiety/depression in this study?’, which was rated on a nine-point scale ranging from 0 (not at all) to 8 (totally satisfied).
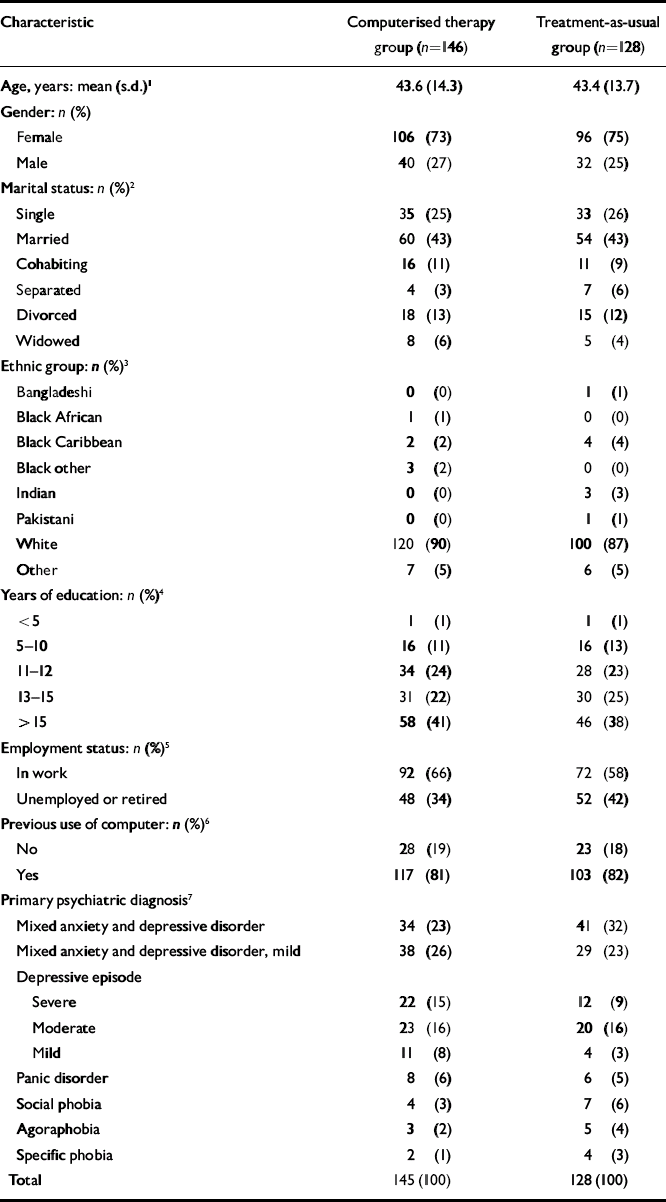
Since the ASQ yields two response variables (CoNeg and CoPos), there were therefore six variables in all. Missing or incomplete data for the BDI and BAI were imputed with the average score of the completed items when no more than four items were missing. The same procedure was applied to missing items in the WSA, but here only one missing item was permitted for imputation owing to the smaller size of the scale. In addition, demographic information (Table 1) was collected from all participants prior to randomisation.
Table 1 Demographic data
| Characteristic | Computerised therapy group (n=146) | Treatment-as-usual group (n=128) |
|---|---|---|
| Age, years: mean (s.d.)1 | 43.6 (14.3) | 43.4 (13.7) |
| Gender: n (%) | ||
| Female | 106 (73) | 96 (75) |
| Male | 40 (27) | 32 (25) |
| Marital status: n (%)2 | ||
| Single | 35 (25) | 33 (26) |
| Married | 60 (43) | 54 (43) |
| Cohabiting | 16 (11) | 11 (9) |
| Separated | 4 (3) | 7 (6) |
| Divorced | 18 (13) | 15 (12) |
| Widowed | 8 (6) | 5 (4) |
| Ethnic group: n (%)3 | ||
| Bangladeshi | 0 (0) | 1 (1) |
| Black African | 1 (1) | 0 (0) |
| Black Caribbean | 2 (2) | 4 (4) |
| Black other | 3 (2) | 0 (0) |
| Indian | 0 (0) | 3 (3) |
| Pakistani | 0 (0) | 1 (1) |
| White | 120 (90) | 100 (87) |
| Other | 7 (5) | 6 (5) |
| Years of education: n (%)4 | ||
| <5 | 1 (1) | 1 (1) |
| 5–10 | 16 (11) | 16 (13) |
| 11–12 | 34 (24) | 28 (23) |
| 13–15 | 31 (22) | 30 (25) |
| > 15 | 58 (41) | 46 (38) |
| Employment status: n (%)5 | ||
| In work | 92 (66) | 72 (58) |
| Unemployed or retired | 48 (34) | 52 (42) |
| Previous use of computer: n (%)6 | ||
| No | 28 (19) | 23 (18) |
| Yes | 117 (81) | 103 (82) |
| Primary psychiatric diagnosis7 | ||
| Mixed anxiety and depressive disorder | 34 (23) | 41 (32) |
| Mixed anxiety and depressive disorder, mild | 38 (26) | 29 (23) |
| Depressive episode | ||
| Severe | 22 (15) | 12 (9) |
| Moderate | 23 (16) | 20 (16) |
| Mild | 11 (8) | 4 (3) |
| Panic disorder | 8 (6) | 6 (5) |
| Social phobia | 4 (3) | 7 (6) |
| Agoraphobia | 3 (2) | 5 (4) |
| Specific phobia | 2 (1) | 4 (3) |
| Total | 145 (100) | 128 (100) |
Design and statistical methods
Scores on the primary outcome measure (the BDI) and the BAI, WSA, CoNeg and CoPos were individually submitted to two analyses. A summary measure analysis was first applied to the four post-random values on each measure, using the mean of available values as the summary measure for each participant. This approach to the analysis of longitudinal data from a clinical trial is described by Everitt & Pickles (Reference Everitt and Pickles2000). The summary measure approach, however, tells us nothing about how an outcome measure changes over time in each treatment group, or how the response is related to other variables of interest. Consequently, a further analysis was performed, which involved fitting linear mixed effects models. These are essentially regression models in which random effects are included to model possible subject heterogeneity in intercepts and slopes of the outcome measures over time, thus allowing the probable lack of independence of the repeated measurements to be taken into account. Full details of such models are given by (for example) Pinheiro & Bates (Reference Pinheiro and Bates2000) and Everitt (Reference Everitt2002). The lme function in S-PLUS (Reference Everitt and Rabe-HeskethEveritt & Rabe-Hesketh, 2001) was used to fit the models.
For each outcome variable a random intercept and slope model (see Reference EverittEveritt, 2002) was fitted using the following covariates (preliminary analyses showed that age and gender were not needed in these models):
-
(a) pre-randomisation value of outcome measure
-
(b) treatment × pre-randomisation value
-
(c) time (coded 2, 3, 5 and 8 for month of visit)
-
(d) time squared to allow for some curvature of the response over time
-
(e) treatment (coded 0 for treatment as usual and 1 for computerised therapy)
-
(f) drugs (coded 0 for no drugs and 1 for drugs)
-
(g) length of pre-existing illness (coded 0 for <6 months and 1 for >6 months)
-
(h) phase (coded 0 for phase 1 and 1 for phase 2)
-
(i) treatment × drug interaction
-
(k) treatment × length interaction
-
(l) treatment × time.
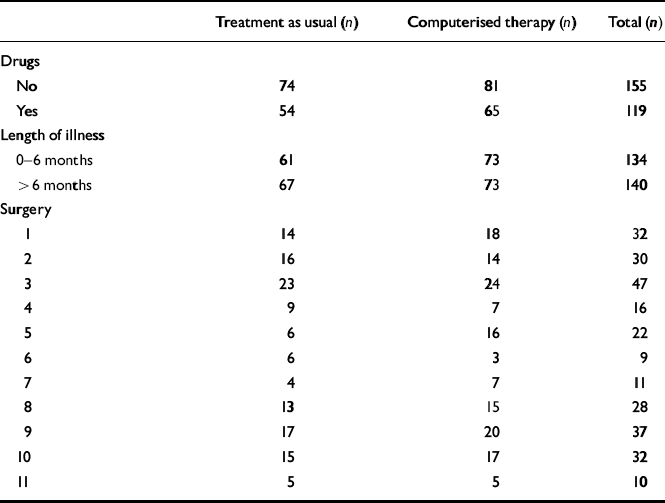
Patient recruitment took place in two phases (Fig. 2): in seven surgeries in phase 1 and in four surgeries in phase 2. The results of phase 1 assessed by the BDI, BAI and WSA have already been reported (Reference Proudfoot, Goldberg and MannProudfoot et al, 2003). Since a secondary aim of our study was to determine the replicability of these results, these three variables were first analysed with the inclusion of phase as a further fixed effect factor. A series of fitted models allowing for possible phase or phase × treatment effects disclosed none that approached conventional significance levels. Consequently it was considered appropriate to undertake more detailed analyses of the combined data-set. All response variables were therefore analysed with the patients from all 11 surgeries combined. Power calculations, based on independent t-tests of the change scores (pre-treatment to post-treatment) between groups in two previous studies (Reference Selmi, Klein and GreistSelmi et al, 1990; Reference Mynors-Wallis, Gath and Lloyd-ThomasMynors-Wallis et al, 1995), showed that to detect a difference of 1 standard deviation in change scores at 80% power and with α=0.05, a total sample size of 200 would be needed. All analyses were intention-to-treat, by which we mean that patients were analysed as randomised rather than by treatment actually received. Within each intention-to-treat group, patients were not included in the model-fitting process described above if they had missing values on any of the covariates used (pre-treatment value, drugs, duration of episode) or if all four post-randomisation values of the response being analysed were missing. Consequently, all the available post-randomisation values of the response were included, rather than only those obtained from patients with all four values recorded. Table 2 presents a breakdown of the patient groups according to drug treatment, length of pre-existing illness and the surgery in which they were treated.
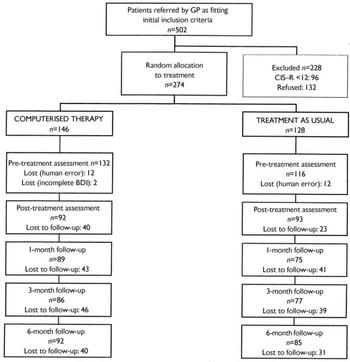
Fig. 2 Study profile. BDI, Beck Depression Inventory; CIS–R, Clinical Interview Schedule – Revised; GP, general practitioner.
Table 2 Comparison of treatment groups
| Treatment as usual (n) | Computerised therapy (n) | Total (n) | |
|---|---|---|---|
| Drugs | |||
| No | 74 | 81 | 155 |
| Yes | 54 | 65 | 119 |
| Length of illness | |||
| 0–6 months | 61 | 73 | 134 |
| > 6 months | 67 | 73 | 140 |
| Surgery | |||
| 1 | 14 | 18 | 32 |
| 2 | 16 | 14 | 30 |
| 3 | 23 | 24 | 47 |
| 4 | 9 | 7 | 16 |
| 5 | 6 | 16 | 22 |
| 6 | 6 | 3 | 9 |
| 7 | 4 | 7 | 11 |
| 8 | 13 | 15 | 28 |
| 9 | 17 | 20 | 37 |
| 10 | 15 | 17 | 32 |
| 11 | 5 | 5 | 10 |
RESULTS
Summary measures analysis
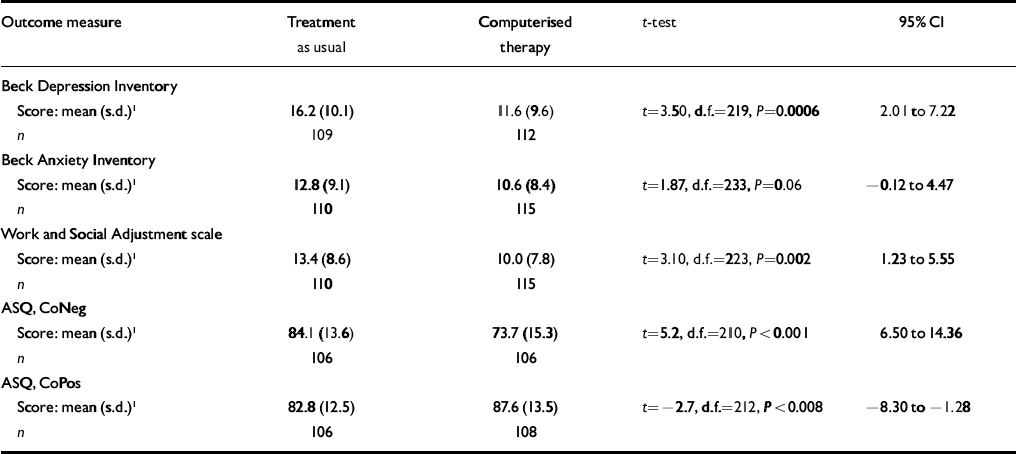
Table 3 presents the results of applying t-tests to the chosen summary measures and the associated 95% confidence intervals. For the primary outcome measure, the BDI, there were 221 patients who each had at least one post-randomisation BDI value and so contributed to the analysis; the 48 patients not in the analysis are those for whom all four post-randomisation BDI values were missing (Fig. 2). A number of cases were lost at each time point because participants failed to attend the surgery to complete the questionnaires. For about a third of the cases the reasons for non-participation are unknown. The reported reasons for non-participation included difficulties in attending the surgery due to a change in circumstances (15%), physical ill-health (15%), moving out of the catchment area (10%), not wanting to continue because the patient no longer suffered from depression/anxiety (10%) and not wanting to continue because of unhappiness with treatment (10%). The numbers of included patients and missing data were similar for the other outcome measures.
Table 3 Summary measures analysis of post-randomisation values
| Outcome measure | Treatment as usual | Computerised therapy | t-test | 95% CI |
|---|---|---|---|---|
| Beck Depression Inventory | ||||
| Score: mean (s.d.)1 | 16.2 (10.1) | 11.6 (9.6) | t=3.50, d.f.=219, P=0.0006 | 2.01 to 7.22 |
| n | 109 | 112 | ||
| Beck Anxiety Inventory | ||||
| Score: mean (s.d.)1 | 12.8 (9.1) | 10.6 (8.4) | t=1.87, d.f.=233, P=0.06 | -0.12 to 4.47 |
| n | 110 | 115 | ||
| Work and Social Adjustment scale | ||||
| Score: mean (s.d.)1 | 13.4 (8.6) | 10.0 (7.8) | t=3.10, d.f.=223, P=0.002 | 1.23 to 5.55 |
| n | 110 | 115 | ||
| ASQ, CoNeg | ||||
| Score: mean (s.d.)1 | 84.1 (13.6) | 73.7 (15.3) | t=5.2, d.f.=210, P<0.001 | 6.50 to 14.36 |
| n | 106 | 106 | ||
| ASQ, CoPos | ||||
| Score: mean (s.d.)1 | 82.8 (12.5) | 87.6 (13.5) | t=-2.7, d.f.=212, P<0.008 | -8.30 to -1.28 |
| n | 106 | 108 |
There was a clear difference between the two treatments on the BDI: patients given computerised therapy scored on average 2–7 points lower than those given treatment as usual. A clear effect was also seen on the WSA, with scores on average between just above 1 and just below 6 points lower in the computerised therapy group than in the usual treatment group. The effect of computerised therapy on the BAI was in the same direction but just failed to reach the conventional 5% significance level (P=0.06). The two measures from the ASQ confirmed this picture: the effect of the intervention was to decrease CoNeg by about 6–14 points and to increase CoPos by about 1–8 points.
Linear mixed effects models
One of the assumptions of the random effects models described in this section is that missing values are missing at random (see Reference EverittEveritt, 2002). If this assumption is invalid, scores at a particular visit for patients who missed a subsequent visit would differ from the scores of patients who attended the subsequent visit. There was little difference in the BDI scores of those attending and those not attending their next scheduled visit; consequently, the ‘missing at random’ assumption seems to be justified.
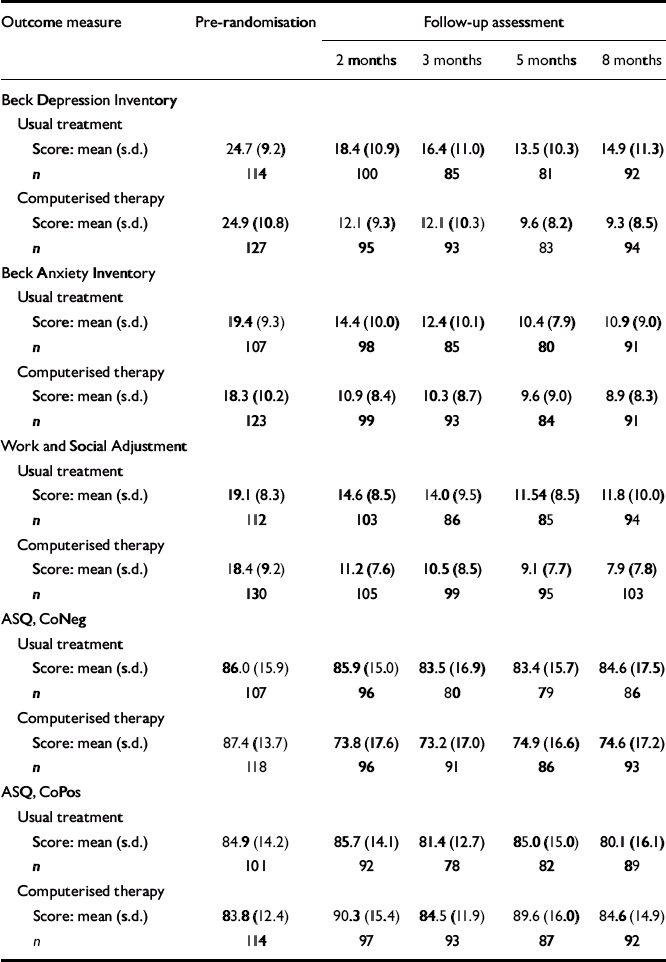
The means and standard deviations for all response variables in each treatment group at each time of measurement are shown in Table 4; for the primary outcome measure, the BDI, the means and standard errors are also shown in Fig. 3. We present full details of the analysis only for the BDI; results for the other variables are summarised below (further information available from the authors upon request).
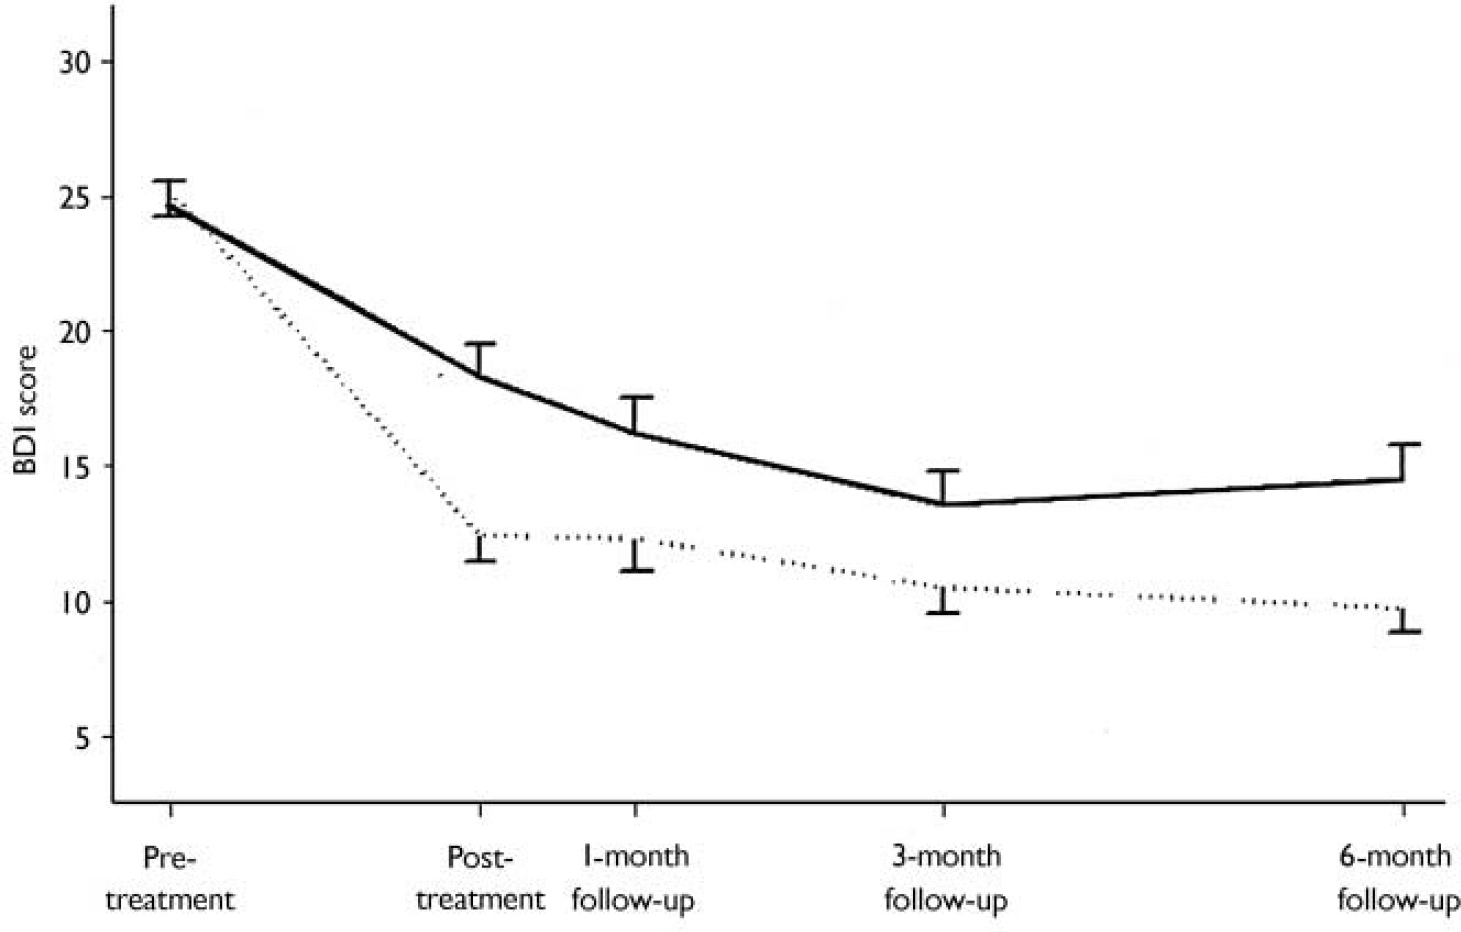
Fig. 3 Treatment mean profiles and standard errors for scores on the Beck Depression Inventory (BDI) for the treatment-as-usual group (solid line) and the computerised therapy group (dotted line). The sample sizes at each assessment point can be seen in Fig. 2. The graph is based on the patients who contributed to the estimates given in Table 5 (i.e. those with a recorded pre-treatment value on the particular outcome and with at least one post-treatment value). For clarity the error bars are unidirectional, displaying 1 standard error of the mean to which they are attached.
Table 4 Mean scores on five outcome measures over the study period
| Outcome measure | Pre-randomisation | Follow-up assessment | |||
|---|---|---|---|---|---|
| 2 months | 3 months | 5 months | 8 months | ||
| Beck Depression Inventory | |||||
| Usual treatment | |||||
| Score: mean (s.d.) | 24.7 (9.2) | 18.4 (10.9) | 16.4 (11.0) | 13.5 (10.3) | 14.9 (11.3) |
| n | 114 | 100 | 85 | 81 | 92 |
| Computerised therapy | |||||
| Score: mean (s.d.) | 24.9 (10.8) | 12.1 (9.3) | 12.1 (10.3) | 9.6 (8.2) | 9.3 (8.5) |
| n | 127 | 95 | 93 | 83 | 94 |
| Beck Anxiety Inventory | |||||
| Usual treatment | |||||
| Score: mean (s.d.) | 19.4 (9.3) | 14.4 (10.0) | 12.4 (10.1) | 10.4 (7.9) | 10.9 (9.0) |
| n | 107 | 98 | 85 | 80 | 91 |
| Computerised therapy | |||||
| Score: mean (s.d.) | 18.3 (10.2) | 10.9 (8.4) | 10.3 (8.7) | 9.6 (9.0) | 8.9 (8.3) |
| n | 123 | 99 | 93 | 84 | 91 |
| Work and Social Adjustment | |||||
| Usual treatment | |||||
| Score: mean (s.d.) | 19.1 (8.3) | 14.6 (8.5) | 14.0 (9.5) | 11.54 (8.5) | 11.8 (10.0) |
| n | 112 | 103 | 86 | 85 | 94 |
| Computerised therapy | |||||
| Score: mean (s.d.) | 18.4 (9.2) | 11.2 (7.6) | 10.5 (8.5) | 9.1 (7.7) | 7.9 (7.8) |
| n | 130 | 105 | 99 | 95 | 103 |
| ASQ, CoNeg | |||||
| Usual treatment | |||||
| Score: mean (s.d.) | 86.0 (15.9) | 85.9 (15.0) | 83.5 (16.9) | 83.4 (15.7) | 84.6 (17.5) |
| n | 107 | 96 | 80 | 79 | 86 |
| Computerised therapy | |||||
| Score: mean (s.d.) | 87.4 (13.7) | 73.8 (17.6) | 73.2 (17.0) | 74.9 (16.6) | 74.6 (17.2) |
| n | 118 | 96 | 91 | 86 | 93 |
| ASQ, CoPos | |||||
| Usual treatment | |||||
| Score: mean (s.d.) | 84.9 (14.2) | 85.7 (14.1) | 81.4 (12.7) | 85.0 (15.0) | 80.1 (16.1) |
| n | 101 | 92 | 78 | 82 | 89 |
| Computerised therapy | |||||
| Score: mean (s.d.) | 83.8 (12.4) | 90.3 (15.4) | 84.5 (11.9) | 89.6 (16.0) | 84.6 (14.9) |
| n | 114 | 97 | 93 | 87 | 92 |
Table 5 Estimated regression coefficients and their estimated standard errors from fitting random intercept and slope model to Beck Depression Inventory scores

| Term | Estimated regression coefficient | s.e.m. | P |
|---|---|---|---|
| Intercept | -1.06 | 1.59 | 0.50 |
| BDI pre1 | 0.57 | 0.06 | <0.0001 |
| Treatment | -4.62 | 1.12 | 0.0001 |
| Time | -0.64 | 0.12 | <0.0001 |
| Time squared | 0.14 | 0.05 | 0.0050 |
| Length | 3.68 | 1.14 | 0.0015 |
| Drugs | -2.44 | 1.18 | 0.04 |
| Phase | 0.04 | 1.14 | 0.97 |
Beck Depression Inventory score
There was a decline over time in BDI scores in both groups, with lower scores in the computerised therapy group at each post-randomisation point (Fig. 3). Fitting a random intercept and slope model, including all the effects listed above, showed that phase (P=0.85) and the four interaction terms (pre-randomisation BDI score × treatment, P=0.56; drugs × treatment, P=0.12; length of pre-existing illness × treatment, P=0.98; treatment × time, P=0.35) were not needed. Refitting the model excluding these terms gives the results shown in Table 5. (These results are based on 689 observations of post-treatment BDI from 204 participants. Similar sample sizes apply also to the other response variables summarised below.) The findings of most interest are the following.
-
(a) There are significant linear and quadratic effects of time that are the same in both treatment groups.
-
(b) The pre-randomisation BDI score is highly predictive of the post-randomisation score.
-
(c) There is a significant treatment effect that is the same for people taking or not taking drugs, and for people whose previous length of illness was less or more than 6 months.
-
(d) The treatment effect is the same for all levels of pre-randomisation BDI.
-
(e) There is a significant effect of drugs: people receiving medication are less depressed on average.
-
(f) There is a significant length effect: people who have been ill for more than 6 months are more depressed than those who have been ill for less than 6 months.
(A further model considered was one in which random effects were included to model possible differences between surgeries, and surgery × treatment interactions; the model provided no improvement in fit over that reported.) In the refitted model the estimated regression coefficient for computerised treatment is -4.62 with a standard error of 1.12, giving a 95% CI for the treatment effect adjusted for the remaining covariates of 2.43–6.82, which is similar to the confidence interval calculated from the summary measure approach.
Other response variables
Fitting the same initial model as for the BDI, the results for the BAI are similar, with again no significant interaction of treatment with time (P=0.17), drugs (P=0.68) or length of illness (P=0.43), but in this case a significant treatment×pre-randomisation BAI score interaction (P=0.005). A relatively informal investigation of this interaction suggested that, below a pre-randomisation value of approximately 18 on the BAI, there was no difference between the intervention and treatment as usual, but above this value the intervention resulted in an estimated average decrease of 4.04 (95% CI 0.44–7.64). For the WSA the four interaction effects were again totally non-significant (treatment×pre-randomisation WSA score, P=0.81; treatment × time, P=0.88; treatment×length, P=0.98; treatment×drugs; P=0.69). The adjusted treatment effect confidence interval of 1.08–4.68 found from fitting the model with phase and the interaction terms removed is again very similar to that calculated from the simpler summary measure method. For CoNeg all the interaction terms were non-significant (treatment×time, P=0.30; treatment×pre-randomisation CoNeg score, P=0.58; treatment×drugs, P=0.44; treatment×length, P=0.44). The estimated treatment effect from the refitted model excluding these terms was 11.16 (95% CI 7.75–14.57), similar to that given by the summary measure approach. For CoPos the model-fitting procedure revealed a significant treatment×pre-randomisation score interaction (P=0.02). Informal investigation of the reasons for this interaction suggested that above a value of approximately 100 on pre-randomisation CoPos there was no treatment effect, but below 100 the intervention therapy increased average CoPos by an estimated 5.22 (95% CI 1.38–9.06) points relative to treatment as usual.
Satisfaction with treatment
Finally, a multiple regression model fitted to satisfaction with treatment (151 completed responses) showed that treatment, drug and age were predictive of this variable. Average satisfaction in the computerised therapy group was 1.68 (95% CI 0.82–2.54) points higher than in the treatment-as-usual group; for those given drugs compared with those not given drugs, the corresponding figure was 1.28 (95% CI 0.63–1.94). For age, the estimated regression coefficient was 0.028 (95% CI 0.0045–0.052).
DISCUSSION
Our results confirm with an enlarged sample that treatment of patients in general practice suffering from anxiety and/or depression with a computerised cognitive-behavioural therapy program led to significant improvement on all response variables measured: depression and anxiety decreased, work and social adjustment improved, negative attributions decreased, positive attributions increased and satisfaction with treatment was enhanced. These effects were substantial as well as statistically significant. As measured by the Beck scales, the average starting levels of depression and anxiety in our patient group were moderate to severe (and similar to those observed in other studies in general practice: Reference Miranda and MunozMiranda & Munoz, 1994; Reference Mynors-Wallis, Gath and Lloyd-ThomasMynors-Wallis et al, 1995), yet the finishing levels were close to the normal range.
Applicability of computerised therapy
Our unusually large sample for a randomised controlled trial of psychological treatment enabled robust estimation of the extent to which the use of a computerised cognitive-behavioural therapy program gives rise to clinical improvement irrespective of other treatments and of patient characteristics. The overall conclusion is clear: computerised cognitive-behavioural therapy is a generally suitable treatment across the range of patients presenting with anxiety and depression in primary care, including those with mild depression or mixed anxiety and depression: mild (representing 34% of our computerised therapy group at intake: Table 1) as well as those with moderate and severe depression. The observed effects of the program did not interact with prescribed drug treatment, which itself appeared effective in reducing depression and negative attributions and in increasing satisfaction with treatment; nor did they interact with duration of pre-randomisation illness, although this was independently associated with increased depression and anxiety, decreased work and social adjustment, and decreased positive attributions; nor with time-clinical improvement was manifested by the end of treatment with computerised therapy and persisted undiminished until the end of follow-up 6 months later. As an exception to the general trend, however, the effects of the intervention were moderated by two measures of pre-randomisation clinical state: first, anxiety was reduced only in patients whose starting BAI score was above about 18 (this is an approximate threshold value, simply judged graphically from an appropriate plot); and second, positive attributions were increased only in patients whose starting CoPos score was below about 100 (again an approximate value). In respect of both variables, therefore, the efficacy of the intervention therapy was greater in patients whose initial clinical state was worse. Given that there was no interaction between treatment with computerised therapy and pre-randomisation clinical state on the other outcome measures, this therapy appears to be appropriate to patients across the whole range of clinical severity encountered in general practice, and irrespective of duration of pre-existing illness.
This inference is confirmed by the findings that, over the entire duration of the trial, depression was worse, the higher the levels of pre-randomisation BDI and BAI scores, and work and social adjustment was poorer, the higher the level of the pre-randomisation WSA score (data not shown), yet these factors did not influence the efficacy of the intervention as measured by either the BDI or the WSA. On the ASQ, the CoNeg (which measures negative attribution style) showed the same pattern. For both groups of patients, negative attributions were greater with higher pre-randomisation levels of CoNeg or BAI scores (data not shown); yet the reduction in CoNeg produced by computerised therapy was independent of these factors. As further evidence of the wide range of applicability of this type of therapy, the additive effects of the intervention and drug treatment on some measures (BDI, CoNeg and overall satisfaction with treatment), as well as their lack of interaction with one another in their effects on any measure, indicate that this form of treatment can provide clinical benefit whether administered on its own or in conjunction with pharmacotherapy. In all these respects, our findings confirm the earlier report by Proudfoot et al (Reference Proudfoot, Goldberg and Mann2003), limited to 167 phase 1 patients and to only three of the response measures (BDI, BAI and WSA). The analyses allowing effects of study phase on these three measures further demonstrated the robustness of our results, in that no significant effect of this variable, either alone or in interaction with others, was found.
Acceptability of computerised therapy
Familiarity with computers was not an inclusion criterion for entry into the trial. Yet, in phase 1 of this study (Reference Proudfoot, Goldberg and MannProudfoot et al, 2003), the rate of withdrawal from this therapy was only 35%, similar to rates reported for face-to-face cognitive–behavioural therapy (Reference Watkins, Williams and CheckleyWatkins & Williams, 1998). In phase 2 of our study the rate of withdrawal was reduced to 12 out of 55 patients randomised to computerised therapy (22%), of whom only slightly over half (7 of 12) quit for reasons of dissatisfaction with treatment. This reduction probably reflects the considerable improvements in program reliability made since the inception of phase 1. Satisfaction with treatment was, in fact, significantly higher among computerised therapy than treatment-asusual patients. Thus, computer-delivered cognitive–behavioural therapy is acceptable to patients, clinically effective, of wide suitability in general practice and, as we report in a companion paper (Reference McCrone, Knapp and ProudfootMcCrone et al, 2004, this issue), cost-effective. It is well suited, therefore, to help supply the unmet need arising from the limited and geographically inequitable availability in the National Health Service of cognitive–behavioural therapists (Reference Shapiro, Cavanagh and LomasShapiro et al, 2003). Thus, our results warrant further research to compare the clinical efficacy of computerised and face-to-face cognitive–behavioural therapy (see report of the National Institute for Clinical Excellence, 2002).
Role of attributional change
Attributional style correlates with susceptibility to clinical depression and physical illness, risk of relapse in depression, low motivation and poor achievement (Reference SeligmanSeligman, 1991). Individuals who typically attribute their failures to internal, stable and global factors (high CoNeg) and their successes to external, temporary and specific causes (low CoPos) are most vulnerable to problems of depression and its cognitive, behavioural and motivational correlates. Face-to-face cognitive–behavioural therapy has been shown to modify attributional style (Reference Seligman, Castellon and CacciolaSeligman et al, 1988) and produce enduring therapeutic benefit in depression and other psychiatric conditions (Reference Hawton, Salkovskis and KirkHawton et al, 1989). Our results here demonstrate that computerised cognitive–behavioural therapy brings about attributional change commensurate with that achieved by face-to-face therapy (Reference Proudfoot, Guest and CarsonProudfoot et al, 1997), along with concomitant improvement in clinical symptoms, as well as in work and social functioning.
Clinical Implications and Limitations
CLINICAL IMPLICATIONS
-
▪ Computerised cognitive behavioural therapy is clinically effective in the treatment of anxiety, depression and mixed anxiety/depression in general practice.
-
▪ The specific program studied, Beating the Blues, is widely applicable in general practice, and its efficacy over a 6-month follow-up period was unaffected by age, gender, concomitant drug treatment or duration of pre-existing illness.
-
▪ Computerised therapy is acceptable to patients in general practice.
LIMITATIONS
-
▪ Outcomes were measured by self-report.
-
▪ Patients were not masked to treatment (necessarily so, given its nature).
-
▪ Some data were missing (a frequent hazard in naturalistic research).
Acknowledgements
Phase 1 of the study was funded by the NHS Executive London (NHSE–LRO) Research and Development, Responsive Funding Programme, and phase 2 by Ultrasis UK Ltd. The views and opinions expressed do not necessarily reflect those of the NHSE–LRO or the Department of Health. J.P. held the Kraupl-Taylor Fellowship under the auspices of the Psychiatry. Research Trust during both phases of the study. We are grateful for permission to use the program Beating the Blues and for technical support from Ultrasis UK Ltd, which funded the development of this program. Above all, we express our gratitude to the patients who took part in the study and to all the medical and nursing staff at the practices where it was conducted: Cannon Hill Lane Medical Practice, West Wimbledon; Morden Hall Medical Practice, Morden; Queen's Road Surgery, Wimbledon; Stonecot Surgery, Sutton; Longrove Surgery, Barnet; Torrington Speedwell Practice, North Finchley; Elm Lodge Surgery, Herne Hill; Sandgate Road Surgery, Folkestone; Paxton Green Health Centre, Dulwich; Mawbey Brough Health Centre, Vauxhall; and Moatfield Surgery, East Grinstead.


eLetters
No eLetters have been published for this article.