1 Introduction
According to many handbooks and textbooks on English phonology (e.g. Kreidler Reference Kreidler1989: 237, Harris Reference Harris1994: 72, Roca & Johnson Reference Roca and Johnson1999: 94, McMahon Reference McMahon2002: 45, Shockey Reference Shockey2003: 18–19), word-final alveolar consonants (i.e. /t d n s z/) – and notably only alveolar consonants – vary their place of articulation to match the consonant with which the next word begins, as in (1).
-
(1)

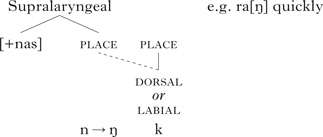
Some phonologists have tried to explain the readiness of alveolar consonants to assimilate (vs. the resistance of velar and labial articulations to assimilation) by proposing that alveolar consonants are underspecified for (i.e. they lack) place of articulation features (e.g. Avery & Rice Reference Avery and Rice1989). Labial and dorsal places of articulation, in contrast, are specified by overt features, which, following Kiparsky (Reference Kiparsky1985: 99), may spread backwards into a preceding empty (i.e. alveolar) place node, according to a rule or constraintFootnote 1 like (2).
-
(2)

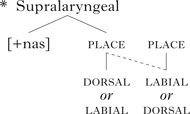
On this proposal, labial (e.g. bilabial) or dorsal (e.g. velar) nasals do not undergo such assimilation, because their place nodes already contain features. This can be formalised with a constraint such as (3), prohibiting a labial or dorsal place feature from spreading backwards into a place node that already bears a place feature.
-
(3)

According to (3), labial or velar consonants should not undergo assimilation; pronunciations such as ki[m]pin for kingpin or alar[ŋ] clock for alarm clock should not occur. Nevertheless there are in fact reports that velar and labial final consonants sometimes assimilate in English, as in (4).
-
(4)

However, these are anecdotal observations, with no context, no audio available for detailed study and no statistics on their frequency of occurrence. It is conceivable that such sporadic counterexamples could be speech errors, dysfluencies or other kinds of pathological forms that do not reflect normal phonological competence and do not warrant radical revision to phonological theory. Alternatively, such examples could be well-formed in some varieties of English but not others, or they could be optional but relatively uncommon. It is crucial to study the systematicity of potential counterexamples in order to understand the nature of phonological specification.
The increasing number and size of speech corpora and advances in speech technology now provide unprecedented opportunities to study large quantities of real-life speech, in order to answer linguistic questions which it has not previously been possible to address in smaller-scale studies. Large corpora allow the investigation of phenomena which are systematic, and may therefore be relevant for modelling phonological processes, but which are also rare, and thus have previously lacked adequate empirical investigation. Assimilation of word-final alveolars to following consonants has been studied in an American English corpus by Dilley & Pitt (Reference Dilley and Pitt2007), but that paper did not look for instances of bilabial or velar assimilation. We suspect that assimilation in non-alveolar nasals has been previously overlooked in the literature precisely because it is relatively rare. Therefore, a large-scale analysis is called for, based on thousands of tokens from spontaneous speech, to demonstrate that assimilation of word-final labial and velar consonants does indeed occur.
In this paper, we take advantage of the spontaneity and size of the Audio BNC (British National Corpus), one of the largest archives of fully transcribed ‘language in the wild’ ever collected, containing almost 1500 hours of recorded speech, to assess the occurrence of labial and velar nasal assimilations, focusing on pairs of words where the first ends in a nasal consonant and the second begins with a non-nasal consonant. Spontaneity is important because velar or labial assimilations may be far less likely to occur in careful laboratory speech. Large size is needed because of the rarity of non-canonical assimilation, and because of the extremely unbalanced distributions of linguistic units (phonemes, syntactic constructions, words) in natural language – by Zipf's Law (e.g. Zipf Reference Zipf1935, Mandelbrot Reference Mandelbrot and Jakobson1961, Miller & Chomsky Reference Miller, Chomsky, Luce, Bush and Galanter1963), some sounds, words, pairs of words, etc. are vastly more frequent than others.
In addition to their unbalanced nature, recordings of spontaneous speech are often noisy. To show the presence of multiple phonetic realisations within a dataset, such as a mixture of assimilated and unassimilated nasals, subsets of the data must be demonstrably different from one another, with statistically significant differences along some phonetic parameter(s). The number of tokens needed to attain statistical significance is primarily a function of the amount of variation in the data.Footnote 2 For speech recorded from a single speaker in good conditions, the variance may be relatively low, and therefore a small number of tokens might be adequate; for speech recorded from many speakers and varieties, as in a naturalistic corpus, a much larger number of tokens may be needed in order to make statistically valid inferences. To illustrate this, consider the histograms of F2 frequency measurements in Fig. 1, which show relative proportions of subsets of our data falling into 100 Hz frequency bins. For the rather ‘noisy’ /ŋ/ data presented in (a) to be a statistically representative sample, with a confidence level of p<0.05, a measurement error E of up to 100 Hz (the size of the histogram bins), and an empirically estimated standard deviation σ = 371 Hz, the number of tokens, N, needs to be at least 53. Even in such a large dataset as the Audio BNC, we find only 33 tokens of /ŋ/ in this context from female speakers, which is statistically insufficient. For the /m/ data in (b), to attain a higher confidence level of p<0.01, with a standard deviation estimate of 250 Hz and a measurement error of only 50 Hz, N must be at least 167. The 736 tokens available are in this case sufficient, because the variance is lower. Figure 1 thus illustrates the need to have a sufficient number of tokens in order to obtain a statistically well-behaved distribution, i.e. one with a clearly defined central tendency. As a rule of thumb, therefore, we aim to find hundreds rather than tens of tokens of items of interest. The size of the Audio BNC is thus crucial in allowing us to overcome variation.
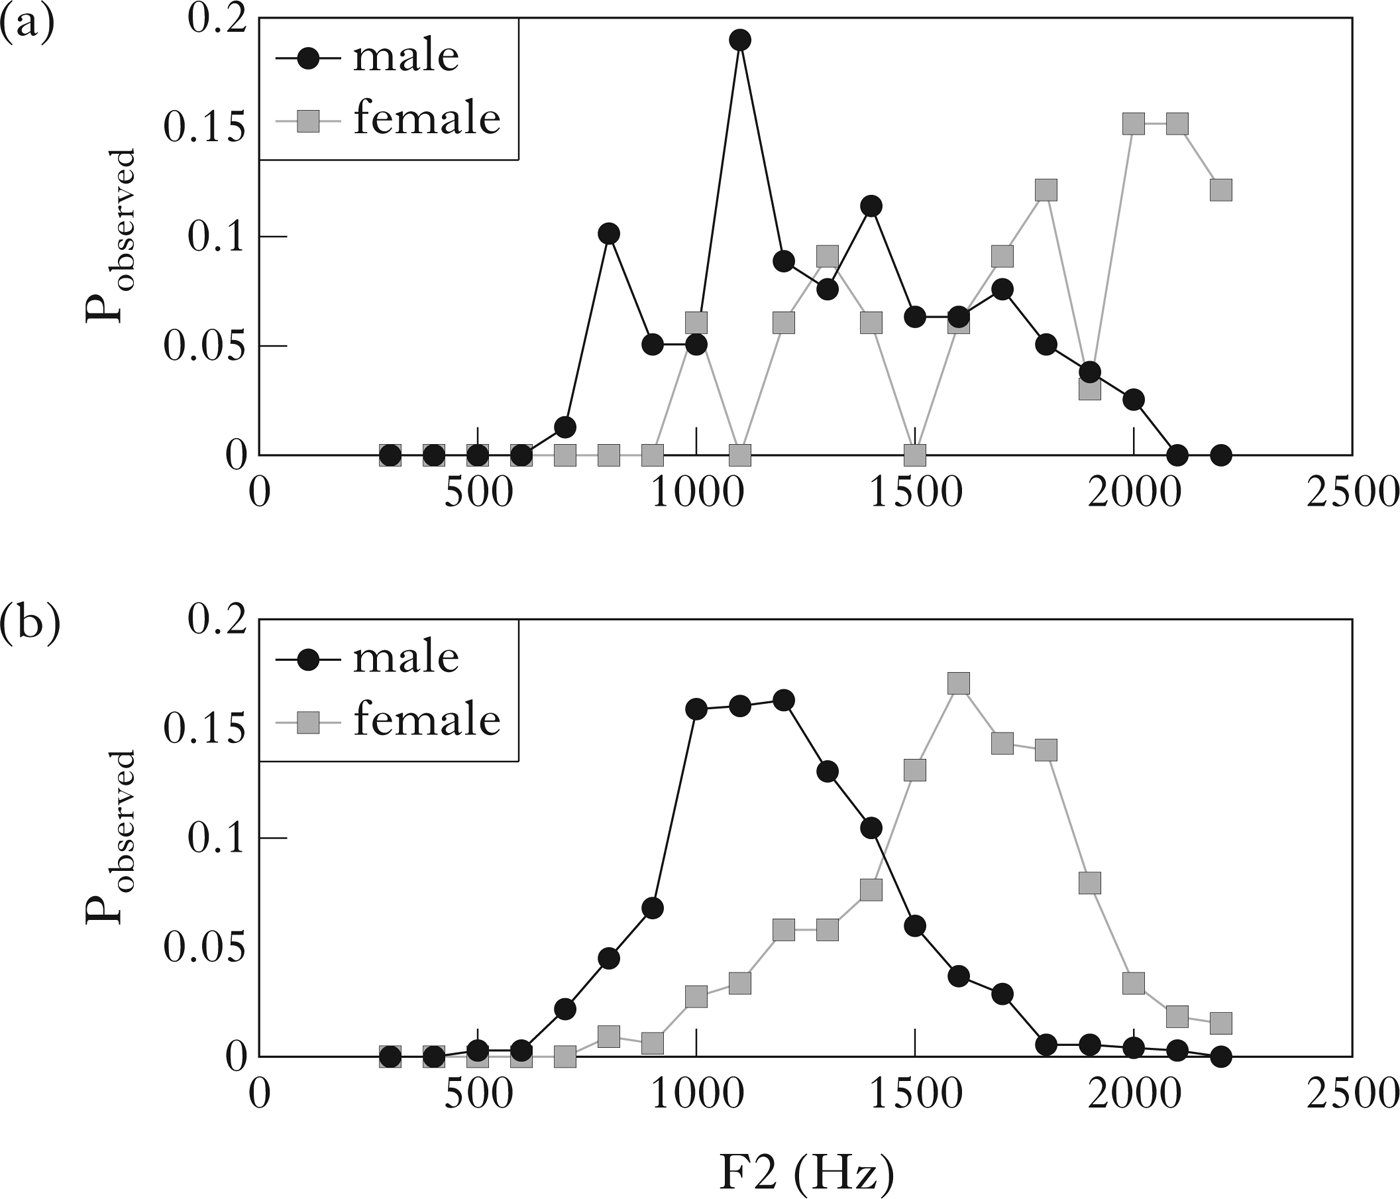
Figure 1 Illustration of how larger sample sizes can yield smoother, single-peaked, distributions. (a) Histograms of F2 of /ŋ/ before /k/ or /g/ (male speakers: N=79, mean F2 (μ)=1299 Hz, standard deviation (σ)=336 Hz; female speakers: N=33, μ=1752 Hz, σ=371 Hz); (b) histograms of F2 of /m/ in from the (male speakers: N=736, μ=1214 Hz, σ=218 Hz; female speakers: N=328, μ=1554 Hz, σ=302 Hz). The vertical axis is relative incidence in the corpus sample (count/N).
In the rest of this paper we lay out evidence for labial and velar nasal assimilations in British English, and present an alternative model of assimilation. We restrict the study to nasals, so that we can measure formant frequencies during their closure portion, which is not possible with oral stops. §2 describes how we prepared the corpus and harvested the relevant word-pairs before outlining our methods. In §3 we present both qualitative and quantitative data to show that non-alveolar nasal assimilation does in fact occur in English, albeit not as frequently as with coronals. Since this means that nasals at all places of articulation may assimilate, a new approach to the phonology of nasal place of articulation variation is required; we present in §4 a new, probabilistic framework for modelling phonological variation – a quantitative underspecification theory – and show how data on assimilated and unassimilated forms can be modelled in that framework. This new approach demonstrates how probabilistic gradience, categories and underspecification may be reconciled.
2 Methods and procedures
2.1 Preparing the Audio British National Corpus
Collected in 1991–92, the 10-million-word Audio British National Corpus was designed to include speech from across the United Kingdom (Crowdy Reference Crowdy1993, Coleman et al. Reference Coleman, Baghai-Ravary, Pybus and Grau2012). Roughly half the corpus consists of unstructured, informal speech collected by volunteers, while the other half is largely unscripted speech collected in more formal settings, such as interviews and religious services. This spoken material was originally recorded on 1213 cassette tapes, which were transcribed orthographically by professional audio typists. The corpus was originally published only as linguistically annotated orthographic transcriptions, together with speaker-specific metadata about age, sex, occupation and location, and other details of sociolinguistic relevance such as the relationship of the speaker to the volunteer who made the recordings (Crowdy Reference Crowdy, Leech, Myers and Thomas1995), as part of the British National Corpus (BNC Consortium 2007). In 2009–10, the British Library Sound Archive digitised most of the original audio recordings (6.9 million words of spoken audio) to stereo PCM audio (.wav files) at 96 kHz with 24-bit resolution.
The first major challenge in mining an audio corpus for a sufficient number of examples of the phenomenon being studied is the task of simply locating the relevant tokens. The almost 1500 hours (or two months) of continuous audio contains tens of thousands of instances of word-final nasals before word-initial consonants. It is hardly feasible to locate examples just by listening to the recordings and manually marking or editing the relevant instances; an automatic method of aligning a transcription with the audio is necessary.
We downsampled the high-resolution recordings to 16-bit, 16 kHz monophonic audio files. Alignment of the transcriptions to the audio files was performed automatically, using the HTK speech-recognition toolkit (Young et al. Reference Young, Evermann, Gales, Hain, Kershaw, Liu, Moore, Odell, Ollason, Povey, Valtchev and Woodland2009), with an HMM topology to match the Penn Phonetics Laboratory Forced Aligner (P2FA; Yuan & Liberman Reference Yuan and Liberman2008). Our alignment system used acoustic models that combined the P2FA American English models with our own British English models, to provide acoustic matching with a wide range of possible pronunciations (Baghai-Ravary et al. Reference Baghai-Ravary, Kochanski, Coleman and Vetulani2011). In accordance with the recording agreements and publication principles of the BNC transcriptions (Crowdy Reference Crowdy1994), personal names and some other speaker-specific information in the recordings were silenced to respect speaker anonymity. The alignment output includes Praat TextGrids (Boersma & Weenink Reference Boersma and Weenink2012), whose tiers contain segment- and word-level transcriptions, as in Fig. 2 below.

Figure 2 Wide-band spectrograms of (a) come down, with final nasal in come pronounced [n] (cf. [n] in down); (b) seem to, with final nasal in seem pronounced [n] (cf. [n] in down); (c) some cream, with final nasal in some pronounced [ŋ] (cf. [m] in cream); (d) coming back, with final nasal in coming pronounced [m] (cf. [m] in some-); (e) something but, with final nasal in something pronounced [m] (cf. [m] in some-). The transcriptions were added manually, not automatically. Arrows indicate the F2 of nasals.
As this study examines word-final nasals in various following contexts, we first surveyed all pairwise combinations of words occurring in the corpus where the first word ends with a nasal, for example some cream. From the Praat TextGrids generated by forced alignment, we compiled an index of word-pair locations (filename, word-pair start and end times) for the entire corpus. Speaker metadata are available with varying level of detail for 64.8% of the 6.9 million word-pairs in the corpus. These were merged with acoustic alignment information to create a single index of lexical, segmental, timing and socio-indexical data. Although the automatic alignment system was highly trained, it was not error-free. Thus, once word-pairs of interest (see §2.2) had been found in the index, every token was listened to in order to exclude from further analysis all tokens that had been grossly misaligned. Approximately 37,000 tokens were checked in this way, with transcription and audio audibly aligned in 67% of cases; in one-third of entries identified by the index, the complete word-pair was not audible in the corresponding audio clip. Misaligned audio clips were removed from the dataset. From the verified word-pairs, the analysis was further restricted to tokens for which the speaker's sex was noted in the corpus metadata, so that we could employ different settings for female and male voices when measuring formant frequencies (see §2.3 below).
Word-pairs selected for analysis were then extracted from the original audio files and realigned automatically, using a modified dictionary that listed all potential assimilated pronunciations. The purpose of this realignment was to improve segment-boundary locations by allowing for shorter segment durations and the possibility of alternative segment labels: an automatic aligner performs best on small portions of speech for which the orthographic transcription is known precisely, while longer stretches of audio (such as the original tape-recordings) require more processing time and are prone to greater error.
The recordings in this corpus are quite challenging for forced alignment and formant-frequency tracking. Due to the informal recording methods (Sony Walkman cassette recorders with built-in condenser microphones, used by volunteer members of the public in a wide variety of recording environments), the signal-to-noise ratio in many of the recordings is so poor that it can be extremely difficult even for an expert to discern formants or cues to segment boundaries using visual examination of their spectrograms. Therefore, we evaluated the accuracy of word and segment boundaries assigned by the forced aligner against two reference sets of hand-corrected boundaries. For the word-boundary evaluation, the absolute differences between automatic and manually corrected times at three data points (the start and end of word 1, and the end of word 2) were calculated for 549 tokens of the highest-frequency word-pairs. 60% of the automatically assigned boundaries fell within 50 ms of the corresponding manual boundaries and 80% within 100 ms; the root mean square (RMS) difference was 70 ms. For the segment-boundary evaluation, the start and end times of the word-final nasals in 374 tokens of come back, 126 tokens of coming back and 99 tokens of coming down were examined. 50% of the automatically assigned boundaries were within 50 ms of the corresponding manual boundaries, 65% within 70 ms and 80% within 100 ms; the RMS difference was 80 ms. Crucially, these differences had no material effect on statistical analyses presented in §3 below, giving us confidence in the validity of using automatically aligned data. Consequently, the measurements and statistics reported below are based on tokens that were located using the automatic alignments.
2.2 Materials: word-pair selection
To identify environments for potential non-canonical assimilation, we searched the word-pair index for word-pairs in which the first word ends in a nasal consonant, and the second begins in an oral consonant. We searched for bilabial nasal /m/ before a velar stop (e.g. I'm getting), and before an alveolar (e.g. I'm trying), as well as in non-assimilation control contexts (before another bilabial, e.g. I'm putting). Likewise, we searched for velar nasal /ŋ/ before an alveolar stop (e.g. long time, trying to) or a bilabial (e.g. young people, coming back), and in a velar–velar control context (e.g. something called, dressing gown). Gerunds such as coming may also have regular [n] variants (i.e. comin’), as reported in the sociolinguistics literature (e.g. Trudgill Reference Trudgill1974, Labov Reference Labov1989). Because bilabial tokens might thus be regarded as assimilated forms of these alveolar variants (Yuan & Liberman Reference Yuan and Liberman2011), the interpretation of evidence of assimilation in these verb forms is somewhat problematic. That is, any assimilation of -ing that we may observe could be assimilation of the coronal nasal allomorph to the following consonant, rather than a counterexample to coronal underspecification. Therefore, we were careful to select a number of non-gerunds with final /ŋ/, in which such ‘g-dropping’ is not expected. We also located pairs in which the first word ends in an alveolar /n/, before a labial or velar stop – canonical assimilation contexts – as controls. Examples with at least ten instances are listed in Table I, together with some relevant word-pairs which occur less frequently, but which we shall discuss further below, e.g. some cream.
Table I Selection of the word-pairs analysed in this study, with the number of tokens that are well aligned and for which the speaker sex is recorded. Shaded cells contain non-assimilation control conditions, and cells with heavy borders are cases in which assimilation of /m/ or /ŋ/ to a following consonant might occur. Items discussed in detail below are italicised.

2.3 Formant-frequency analysis
We analysed formant frequencies in the word-final nasals and (to begin with) the vowels immediately preceding them in order to see whether there were any acoustic differences of the kind that are characteristic of place-of-articulation differences.Footnote 3 It is far from easy to analyse place of articulation of nasals from acoustic spectral data alone. Prior work (Fujimura Reference Fujimura1962, Kurowski & Blumstein Reference Kurowski and Blumstein1987, Stevens Reference Stevens1998) has shown that in nasal stops, the first formant of flanking vowels divides into two nasal resonances plus an antiresonance, a reduction in spectral energy corresponding to the resonance of the closed mouth cavity. The frequency of this antiresonance correlates well with place of articulation, being low for [m] (ca. 750–1250 Hz), higher for [n] (ca. 1450–2200 Hz) and highest, but more variable, for [ŋ]. However, automatic analysis tools typically only provide measurements of resonances (formants), not antiresonances, so we focused on measurements of formant frequencies during the nasal murmur.
Dilley & Pitt (Reference Dilley and Pitt2007) measured formant frequencies during the transition from the vowel into following consonants, in order to assess place of articulation. Since they were examining /t/ and /d/ as well as /n/, this method is appropriate for their study; however, measuring such vowel–nasal transitions is neither necessary nor very suitable for our study. Dilley & Pitt used the smaller Buckeye Corpus, which contains high-quality recordings of unscripted interviews that were manually labelled. The poorer audio quality of recordings in the BNC makes it more difficult to be confident about measurements of formant frequencies in a vowel-to-consonant transition than in the nasal consonant: identifying the correct time interval for measuring transitions requires accurate timing information about the segment boundaries; since the speech rate is very variable across the corpus, the duration of transition portions is very variable from one token to another. However, it is not necessary to look at vowel transitions in order to examine place differences, because it is possible and sufficient to examine the formant frequencies of the nasals themselves; we can examine the segment of interest directly. This is consistent with how listeners perceive place of articulation of postvocalic nasals: Repp & Svastikula (Reference Repp and Svastikula1988) found that listeners made use of the spectrum of the nasal murmur itself (in addition to the quality of the preceding vowels), whereas formant movements in the vowel–nasal transition were not perceptually salient, unlike the case with nasal–vowel transitions. From our previous experience of measuring acoustic cues to place of articulation (e.g. Olive et al. Reference Olive, Greenwood and Coleman1993), we expected that F1 would not be very different for [m], [n] and [ŋ]. We expected that [m] would have the lowest F2 and F3, and that [ŋ] would have a higher F2, possibly rising in the direction of a falling F3, especially after front vowels (the ‘velar/palatal pinch’). In front vowel contexts especially, F2 of [ŋ] could be very high, and possibly even higher than F2 of [n]. In general, however, we expected that F2 and F3 for [n] would be highest of all, modulo the variation due to assimilation that has been well documented for [n]. These patterns are also evident in the qualitative descriptions and figures in Potter et al. (Reference Potter, Kopp and Kopp1966: 189).
Using Praat, we automatically measured formant frequencies in the aligned word-pairs. Each token was downsampled to 8 kHz, and formant frequencies were measured via a short-term spectral analysis with a window length of 25 ms and 50 Hz pre-emphasis. Data from male and female speakers were measured and analysed separately. For male speakers, five formants were measured, with a maximum range of 4500 Hz, while for female speakers, four formants were measured, with a maximum range of 5500 Hz. In order to normalise over segments of different durations, the formant frequencies were measured at 10% fractions of each segment in a word-pair (from 0% to 100% of the segment's duration). As the formant frequencies are quite stable during the nasals examined in this paper, we averaged across all deciles to obtain a single mean frequency for each formant, for each nasal token.
3 Results
We looked for evidence of assimilation of word-final /m/ or /ŋ/ to following consonants in four complementary ways. First, we examined relevant audio portions impressionistically, i.e. by listening to many such word-pairs and inspecting their spectrograms (§3.1). This part of the study includes some word-pairs for which only a few tokens are available, and which are therefore not amenable to statistical analysis. However, they may be considered as ‘existence proofs’ of non-coronal assimilation. Then, using linear mixed-effects models (Baayen et al. Reference Baayen, Davidson and Bates2008), we tested whether the place of articulation of following consonants has a statistically significant effect on the F2 frequency of final nasals (§3.2). Finally, we examined the statistical distributions of F2 frequency variation using histograms (§3.3), and making planned comparisons to see how word-final nasals in certain, similar contexts were or were not differentiated (§3.4). As few significant differences in formant frequencies were found for F1 or F3, the analyses and results given here focus on F2.Footnote 4
3.1 Impressionistic evidence of non-coronal assimilation
In the impressionistic part of this study, one of the authors, an experienced ear-trained phonetician, listened to 668 tokens that were candidate cases of bilabial or dorsal assimilation. A number of clear cases of assimilated non-alveolar nasals were identified and then examined in more detail in spectrograms. Figure 2 presents spectrograms of five examples of these audibly assimilated non-alveolar nasals at word boundaries. In Fig. 2a, the F2 of /m/ in come down does not drop, as it does in the /m/ of cream (Fig. 2c) and coming (Fig. 2d), but remains high, similar to the /n/ in down. Likewise, in Fig. 2b, the word-final /m/ in seem to has a high F2 that remains high during the short [t] closure that follows. In Fig. 2c, the F2 of /m/ in some clearly rises towards F3, forming a ‘velar pinch’ before the /k/ of cream, an unmistakable characteristic of [ŋ] (Olive et al. Reference Olive, Greenwood and Coleman1993: 97). In Fig. 2d, the /ŋ/ in coming back has a low F2, similar to that of the medial /m/ of coming and the final /m/ of cream in Fig. 2c. Again, in Fig. 2e, the final /ŋ/ in something but has a low F2, similar to the [m] tokens in Fig. 2d, but quite unlike the ‘velar pinch’ evident in Fig. 2c.
As expected, such clearly audible assimilations are relatively uncommon: whereas 20% of alveolar nasals were judged to be assimilated in Dilley & Pitt (Reference Dilley and Pitt2007), in this data 8.3% (18/216) of lexically velar nasals and 4% (37/976) of bilabial nasals were judged to be assimilated.Footnote 5 However, the subjective listening test has limitations, such as listener biases and difficulties with unclear or ambiguous stimuli. Although phonetic listening and the inspection of spectrograms were useful for revealing the existence of a non-negligible number of examples of non-coronal assimilation, including word-pairs such as alar[ŋ] clock, where the number of tokens is small, statistical tests are required to assess the systematicity of non-coronal assimilation.
3.2 Linear mixed-effects models of F2 frequency in nasals
If nasals in word-final position assimilate systematically to following consonants, we should find acoustic variation in those nasals consistent with variation in place of articulation: nasals before labials should show a reduction in mean F2 frequency, nasals before alveolars should show relatively high F2 frequency and nasals before velars should have F2 frequencies intermediate between pre-labial and pre-alveolar nasals. To test this, we first computed the average F2 frequency of each word-final nasal in 14,402 tokens of 444 word-pairs in control and assimilation contexts. There are many sources of noise in the data, especially speaker-to-speaker variation (1227 speakers) and the quality of the pre-nasal vowel. We control for these confounds by fitting linear mixed-effects models to the data. This type of model allows us to test the fixed factors expected to have a constant effect on nasal formant frequencies, while simultaneously accounting for variation across speakers and word-pairs, and maintaining robustness in the presence of unequal numbers of observations. The analysis was run in R using the lme4 package (Bates & Maechler Reference Bates and Maechler2009). Linear mixed-effects models were fitted by hand, using model comparison, and p-values were obtained using the lmerTest package (Kuznetsova et al. Reference Kuznetsova, Brockhoff and Christensen2013). A model was fitted for each lexical nasal place of articulation; the dependent variable was F2 frequency, with one (average) measurement for each token. A random intercept was fitted for speaker. We included fixed effects for sex, following place of articulation and preceding vowel quality.
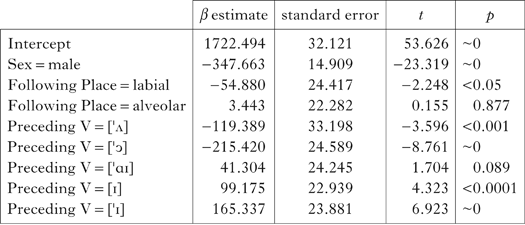
Summaries of the best-fitting models for /m, n, ŋ/ are shown in Tables II–IV, where the β-value estimates may be interpreted as the amount (in Hz) by which the average F2 frequency of the nasal is raised or lowered by a given factor level. In all three models, the fixed effects were significant predictors of nasal F2 frequency. Unsurprisingly, speaker sex and preceding vowel have an effect on F2: F2 frequencies are lower for male than for female speakers, and front vowels induce higher nasal F2 frequencies than non-front vowels. In each of the three models we also find significant effects of following consonant place of articulation. In each model the F2 frequency is significantly higher before alveolars or velars than before labials. Although there is little difference between the effect of following alveolars and velars, the fact that all three nasals vary significantly according to the following consonant place confirms that assimilation is not limited to coronals.
Table II Summary of best mixed-effects model for /m/ (N=4441, 870 speakers). The reference level for this model is the control condition, i.e. /m/ followed by another labial consonant, with Sex=female and Preceding V=[ǝ]. Random factor=(1|Speaker).
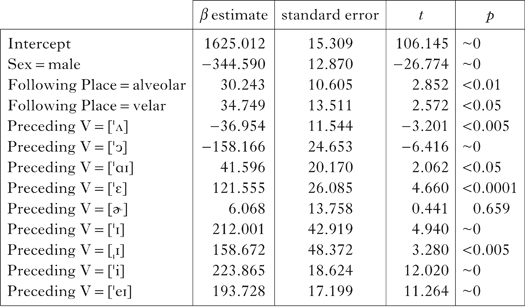
Table III Summary of best mixed-effects model for /n/ (N=6991, 987 speakers). The reference level for this model is the control condition, i.e. /n/ followed by another alveolar consonant, with Sex=female and Preceding V=[ˈɑ]. Random factor=(1|Speaker).
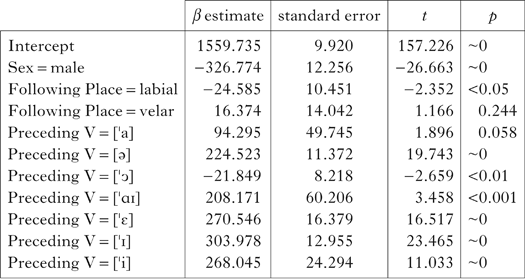
Table IV Summary of best mixed-effects model for /ŋ/ (N=2970, 768 speakers). The reference level for this model is the control condition, i.e. /ŋ/ followed by another velar consonant, with Sex=female and Preceding V=[ǝ]. Random factor=(1|Speaker).
To further explore the implications of these findings, we now examine the distributional patterns of the F2 frequency variation more closely, and carry out planned comparisons between selected word-pairs.
3.3 Controls: distributions of F2 variation in unassimilated nasals
There is surprisingly little published data on the acoustics of nasal consonants: earlier studies (e.g. Fujimura Reference Fujimura1962, Kurowski & Blumstein Reference Kurowski and Blumstein1987) typically report measurements of one or a few speakers. We therefore begin by examining the F2 frequency differences between /m, n, ŋ/ in non-assimilating environments (the shaded cells in Table I) in 11,669 tokens of 74 word-pairs spoken by 1181 speakers drawn from across the corpus. Figures 3a and 4a plot histograms of F2 variation in /m, n, ŋ/ produced by female and male speakers. While the data for /m/ and /n/ are drawn from pre-labial and pre-alveolar contexts respectively, there are too few data for /ŋ/ before /k/ or /g/ to generate smooth histograms, as demonstrated in Fig. 1 above. The F2 frequencies for [ŋ] are thus pooled across all following consonantal contexts, including a small proportion of potential assimilation contexts. As the actual incidence of assimilated tokens is very small (see below), this does not affect the overall F2 distribution a great deal.

Figure 3 (a) Histograms of F2 of nasals (female speakers). Labial: /m/ before /p, b/ (N=365); velar: /ŋ/ in all contexts (N=933); alveolar: /n/ before /t, d/ (N=135). (b) Gaussian standard normal distributions (probability density functions) fitted to those histograms. Labial: model of /m/ (a=36,088, μ=1554 Hz, σ=302 Hz); velar: model of /ŋ/ (a=86,742, μ=1694 Hz, σ=293 Hz); alveolar: model of /n/ (a=10,067, μ=1838 Hz, σ=271 Hz).

Figure 4 (a) Histograms of F2 of nasals (male speakers). Labial: /m/ before /p, b/ (N=364); velar: /ŋ/ in all contexts (N=1211); alveolar: /n/ before /t, d/ (N=203). (b) Gaussian standard normal distributions (probability density functions) fitted to those histograms. Labial: model of /m/ (a=39,967, μ=1214 Hz, σ=218 Hz); velar: model of /ŋ/ (a=12,231, μ=1349 Hz, σ=283 Hz); alveolar: model of /n/, a=20,367, μ=1404 Hz, σ=287 Hz).
In Table V, the means and standard deviations of F2 frequency are given for each category. These values were used to fit standard normal distributions (Gaussian probability density functions) to the histograms using the Matlab normpdf function,Footnote 6 with observed mean F2 frequency μ, the standard deviation from the mean σ and a scale constant a derived as a linguistically irrelevant by-product of the data-fitting procedure. These normal distributions are plotted in the lower panel of Figs 3b and 4b.
Table V Means and standard deviations (in Hz) of F2 frequencies of canonical (unassimilated) /m, n, ŋ/ in non-assimilating environments across a wide range of speakers.
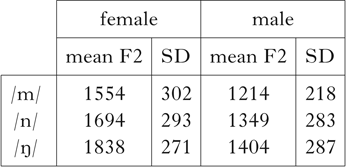
In the observed distributions of F2 frequency seen in Figs 3a and 4a, a wide range of variation is evident within each category. This is because of the very wide range of speakers in the corpus. Even so, it can be seen for both males and females that the mode of F2 for /m/ is generally lowest, that of /n/ is highest and /ŋ/ in between.
Having established the population means and statistical distributions of F2 frequencies in unassimilated controls, we now examine whether nasals vary systematically according to the place of articulation of the following consonant.
3.4 Distributions of F2 variation in /n/-assimilation
Since /n/ is known to assimilate systematically to the place of articulation of following consonants, we here present histograms of F2 frequency in tokens of word-final /n/ in our corpus which are followed by bilabial and velar consonants. As can be seen in Fig. 5, assimilation gives rise to statistical distributions that are multimodal. Sometimes the second mode is clearly visible as a second peak, and sometimes it is not so clearly differentiated from the primary peak, appearing more as an elbow on the tail of the primary peak than as a separate peak. In all the histograms, the peak representing unassimilated [n] tokens falls at roughly the same frequency as in Figs 3 and 4 above (around 1800 to 2000 Hz for females and around 1400 to 1600 Hz for males). The secondary peaks representing tokens assimilated to following bilabials (labelled [m]) fall close to the F2 frequency peaks for word-final /m/ in non-assimilation contexts in Figs 3 and 4 (around 1450 Hz and 1200 Hz). In the same way, the peaks representing tokens assimilated to velars (labelled /ŋ/) fall at F2 frequencies in between, at around 1700 Hz and 1300 Hz for female and male speakers respectively. Thus in canonical assimilation contexts we find a hierarchy of distributional peaks at F2 frequencies parallel to the /n/ > /ŋ/ > /m/ hierarchy found in our unassimilated control tokens. Therefore, if word-final bilabials and velars also assimilate systematically to following consonants, we expect to find similar patterns, albeit with lower-probability secondary peaks, given the lower rates of assimilation found in our auditory study (§3.1 above). To further explore the implications of these findings, we now analyse the distributional patterns of F2 frequencies in assimilation contexts, and carry out planned comparisons to examine the magnitude and significance of F2 differences between selected word-pairs.
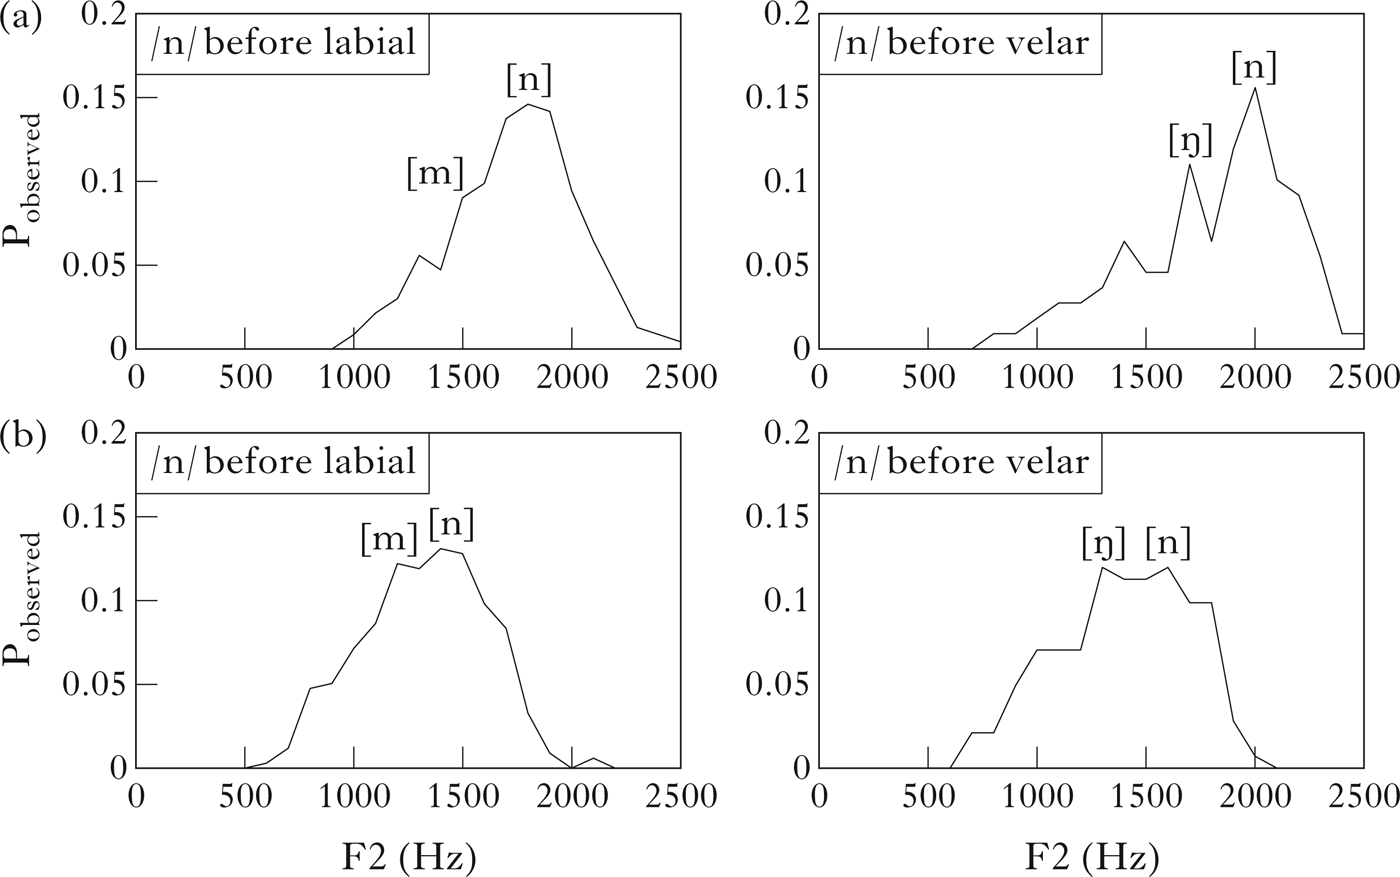
Figure 5 Histograms of F2 of word-final /n/ followed by bilabials and velars. (a) Female speakers (N=233 and 109); (b) male speakers (N=336 and 142).
3.5 Assimilation in /m/ and /ŋ/: planned comparisons
The distributions of word-pairs in the corpus are extremely lopsided, as illustrated in Table I. Moreover, the most frequent word-pairs (e.g. on the) are also the most likely to be spoken more quickly and reduced in casual speech, and are hardest for the aligner to delimit accurately. On the other hand, the formant frequencies of less frequent word-pairs (e.g. young girl) are highly variable across tokens, making statistical comparisons difficult. The clearest data come from word-pairs that are frequent enough for statistically useful results, but not so frequent as to be prone to extreme phonetic shortening. We therefore focus on a selection of such pairs in our planned comparisons.
3.5.1 Variation in bilabial nasals
Table VI displays the means and standard deviations of nasal formant frequencies in seem to and been doing.Footnote 7
Table VI Means and standard deviations (in Hz) of F2 frequencies of nasals. ‘A~B’ indicates ‘A tending towards B’.
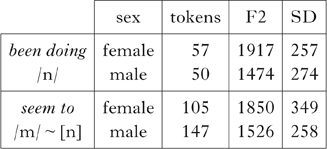
If the /m/ in seem to sometimes assimilates to the following /t/, it will have higher mean F2 frequency than before a labial consonant. Unfortunately, the corpus has too few controls of the form /iːm # {p, b}/, so we are unable to assess this comparison directly. If, however, the /m/ in seem to retains its canonical pronunciation, and never assimilates to the following /t/, we expect it to have a lower mean F2 than the /n/ in been doing, consistent with their labial vs. alveolar articulations (Figs 3 and 4 above). Comparisons between the mean frequencies using t-tests found no significant differences (p>0.05) in the F2 frequencies of the final nasals in seem to vs. been doing. While we should be cautious about drawing inferences from an absence of difference, the data are sufficient in number to suggest strongly that /m/ in seem to assimilates to a high degree to the alveolar place of the following /t/. Figure 6 illustrates how F2 frequency of /m/ in seem to has a very similar distribution to that of F2 of /n/ in the control condition (before /t/ or /d/). This indicates a high rate of /m/-to-[n] assimilation in this word-pair.
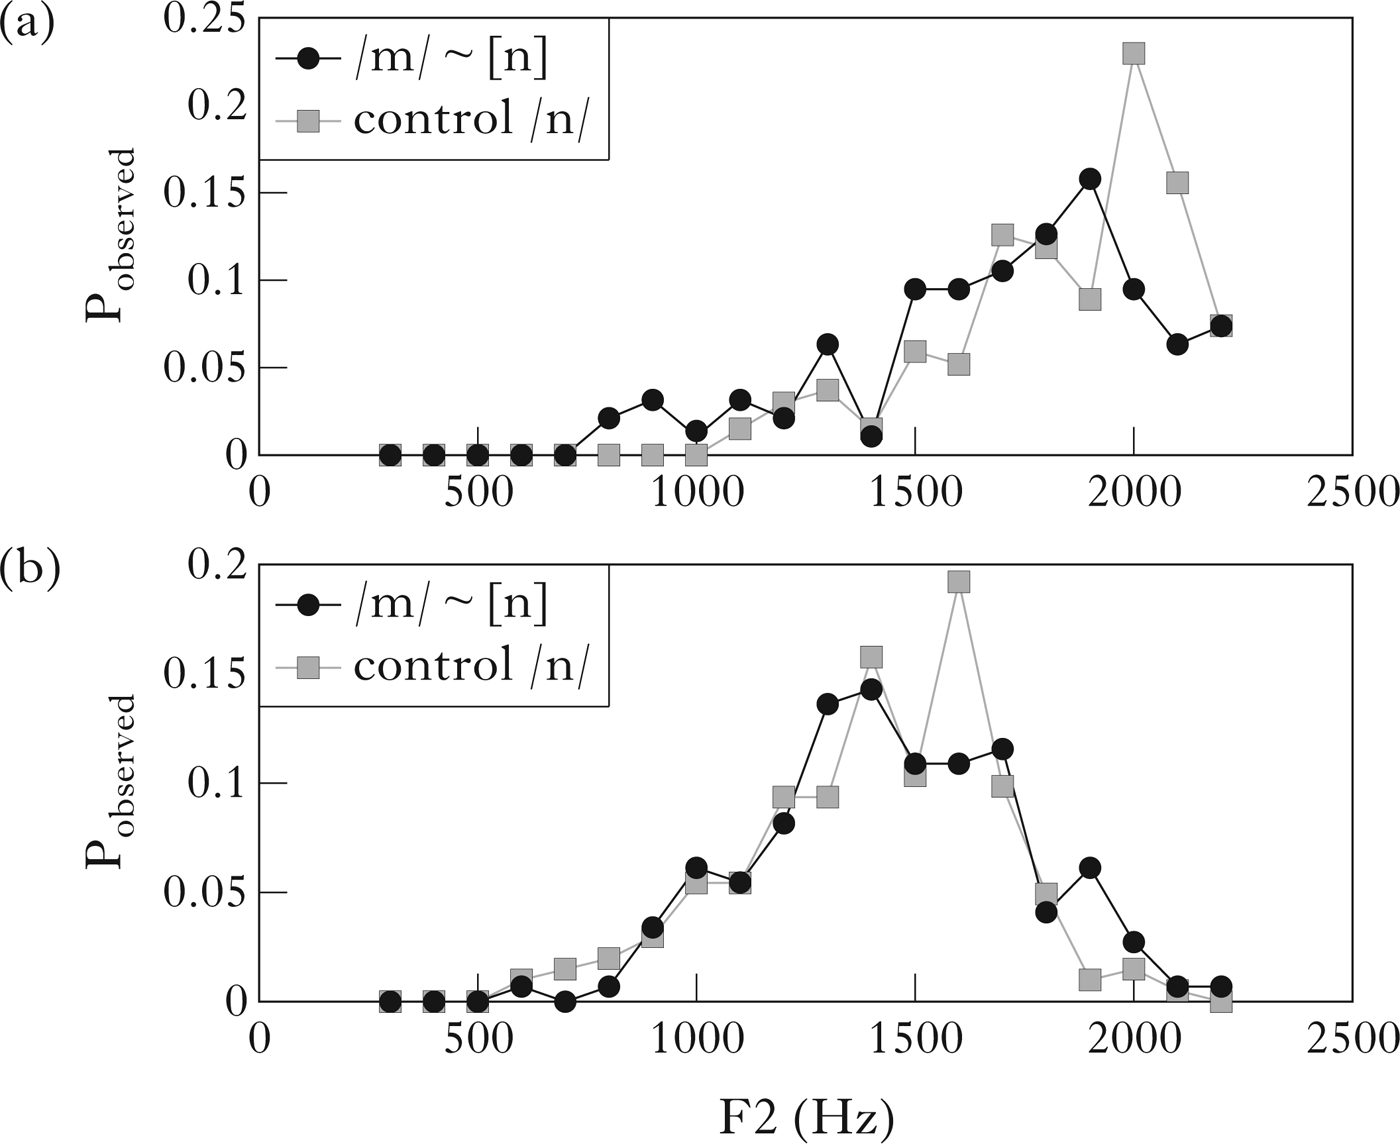
Figure 6 F2 variation in /m/ of seem to vs. control /n/. (a) Female speakers; (b) male speakers.
In cases of assimilation like seem to, we might expect a bimodal distribution in the F2 patterns, with, for example, a large peak for the unassimilated tokens, and a distinct, smaller peak for assimilated tokens. However, we tend to observe rather broad, single-peaked distributions; this could be because the samples we have examined are from a diverse range of speakers. To test whether such evidence of assimilation might also be found in the speech of an individual and are not an accidental emergent property of combining data from many speakers, Fig. 7 plots variation in the F2 frequency of all /m/ tokens within the speech of one selected speaker from the BNC, ‘Fred’, a 78-year-old man from the Northwest Midlands. This subject was chosen for in-depth analysis because he is heard to say see[n] to for seem to several times, even when repeating himself. In this figure, circles plot the F2 frequency distribution of 1435 unambiguously bilabial tokens, that is, /m/ tokens occurring prevocalically, utterance-finally or before labial consonants. In this control condition, there is a well-defined modal peak in the 1200–1300 Hz region. Squares indicate the F2 frequency distribution of 235 tokens of /m/ before coronal consonants. Again, a modal peak occurs in the 1200–1300 Hz region, showing that the /m/ tokens in this environment are also typically bilabial. However, additional smaller peaks are also evident at higher frequencies, due to a smaller proportion of /m/ tokens that have assimilated to their coronal context. Consistent with this interpretation, this speaker's tokens of seem to with an audible [n]-like consonant typically had a second mode of F2 frequencies between 1808 Hz and 2368 Hz. Nasals in the two contexts depicted have different mean F2s (/m/ control: 1473 Hz; /m/ before coronals: 1593 Hz). We compared the two distributions using a Kolmogorov-Smirnov test and found that they were significantly different from each other (D=0.238, p<0.0005). We also find statistical support for bimodality in the possible assimilation context: Hartigans' dip test for unimodality confirms that Fred's nasals before coronals are not unimodal (D=0.0565, p<0.05), while those in control contexts are unimodal (D=0.0067, p~0.99).
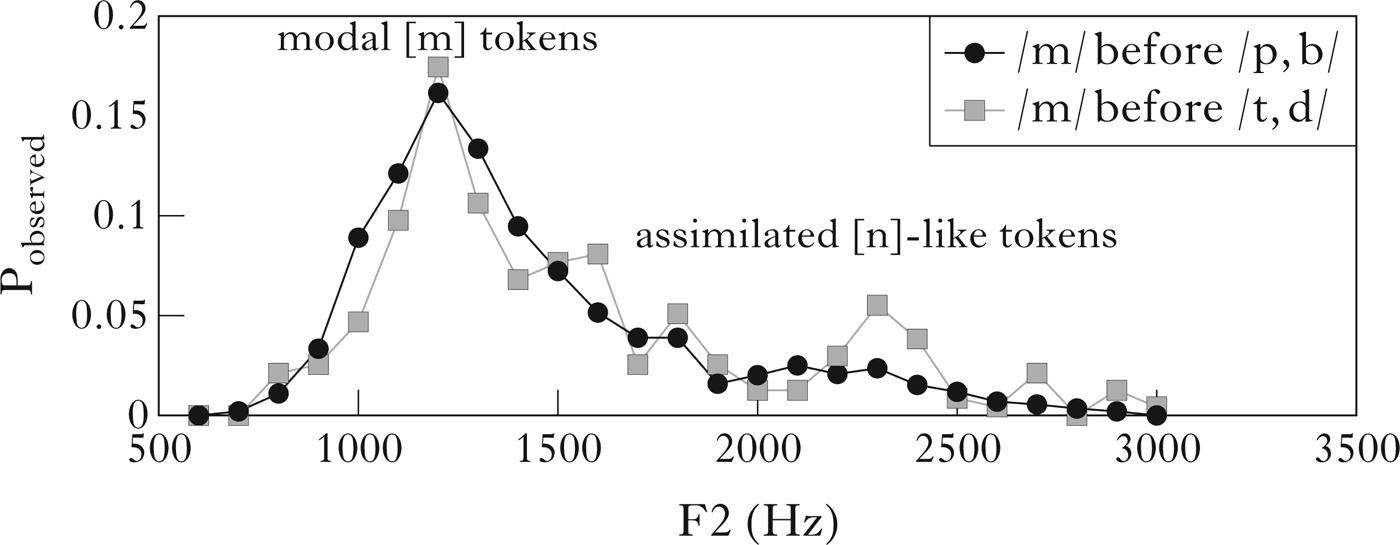
Figure 7 Histograms of F2 frequency of /m/ in all 1670 tokens produced by speaker ‘Fred’. There were 235 tokens of /m/ before coronal consonants.
3.5.2 Variation in velar nasals
In the second planned comparison we examined whether the final /ŋ/ of coming varies according to (and in the direction of) a following /b/ or /d/. We compared the F2 frequency of the /ŋ/ in coming back with coming down. The nasal in come back is a control, as this is a context in which only bilabial variants are expected. As explained above, there are insufficient data even in this large dataset to make a further planned comparison with a word-pair containing unassimilated /ŋ/. The means and standard deviations of the F2 measurements are given in Table VII.
Table VII Means and standard deviations (in Hz) of F2 frequencies of nasals.
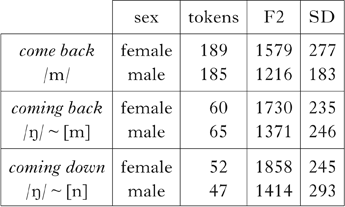
Differences in mean F2 frequencies for come back vs. coming back, come back vs. coming down and coming back vs. coming down were compared using t-tests, with a Bonferroni correction for multiple comparisons. One-tailed significant differences in F2 frequency are summarised in Table VIII.
Table VIII Size and significance of mean F2 differences (δ, in Hz) for male and female speakers.
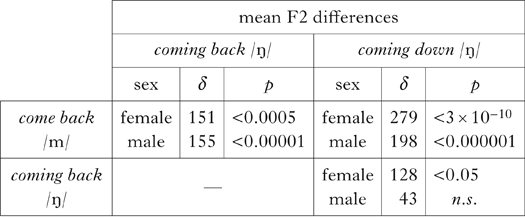
The differences between the F2 frequency distributions of /ŋ/ in these three word-pairs can also be seen in Fig. 8: in general, for both male and female speakers, the F2 of /ŋ/ before /b/ (coming back) is lower than before /d/ in (coming down), while the F2 of /m/ in come back (the control), as expected, is lower still. This is consistent with the pattern observed for word-final canonical /m/ vs. /n/ above (Figs 3 and 4), and indicates that a proportion of the tokens in each test context is assimilated to the following consonant. The differences between mean F2 of the word-final nasals was significant in all pairwise comparisons, with the exception of coming back vs. coming down in the data of the male speakers. Taken together, these comparisons indicate that /ŋ/ does assimilate to some degree: along the F2 frequency scale there is a gradient of variation from canonical [m] in come back to variation between [ŋ] and [m] in coming back and to variation between [ŋ] and [n] in coming down.
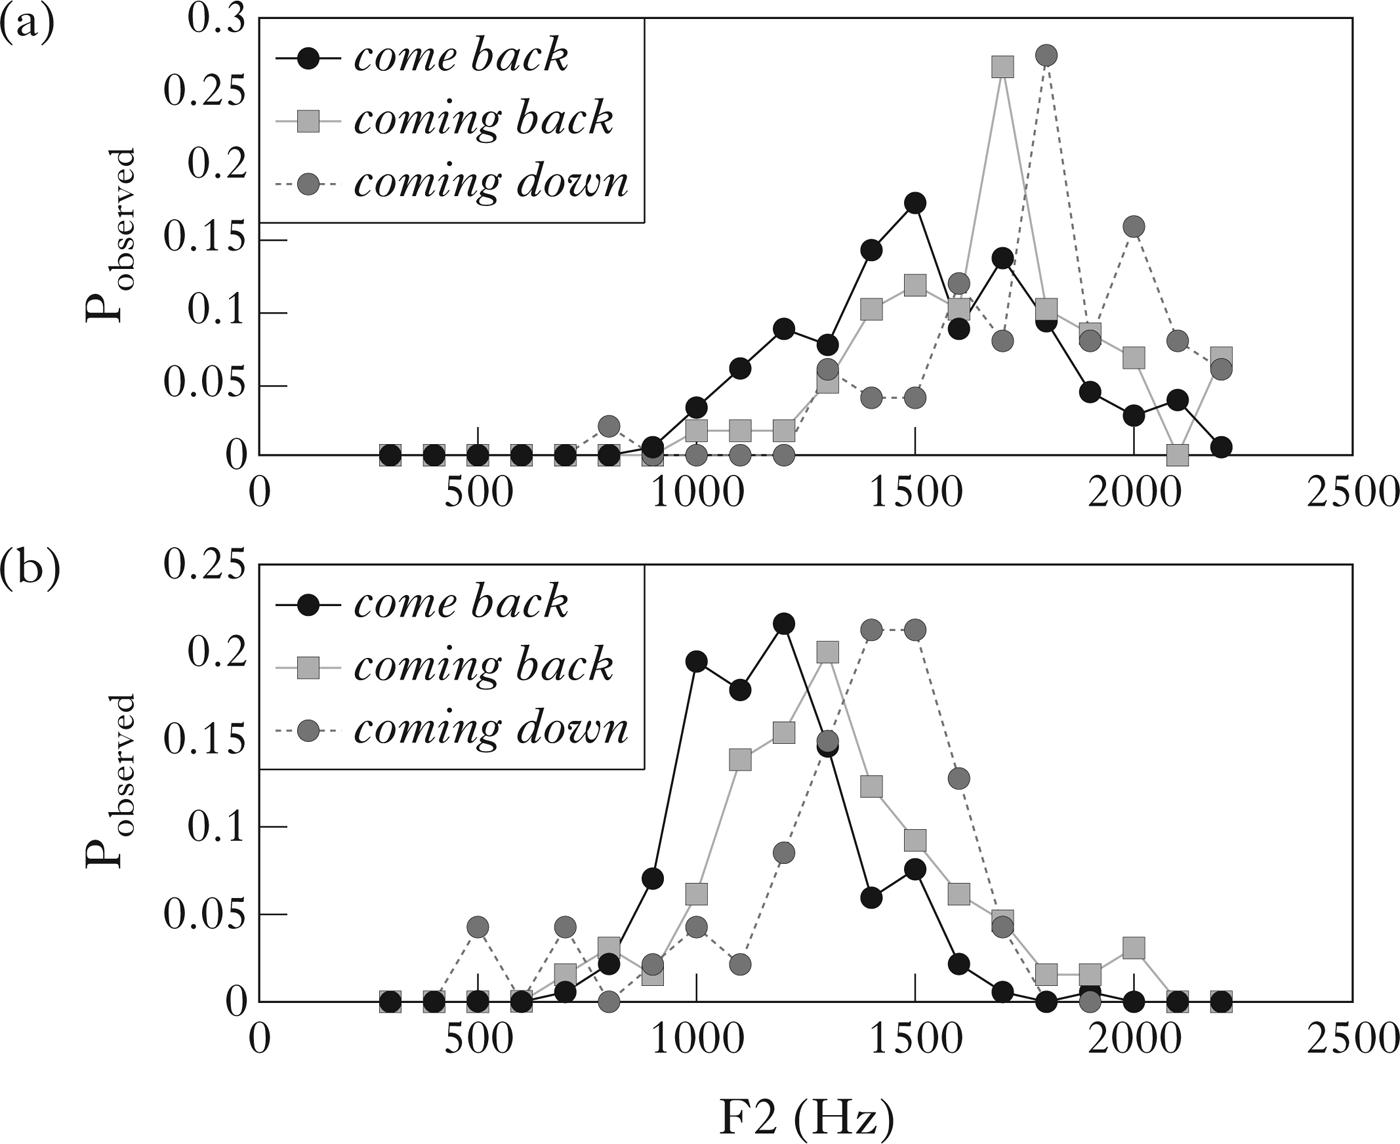
Figure 8 F2 variation in /m/ of come back and /ŋ/ of coming back and coming down. (a) Female speakers; (b) male speakers.
As mentioned above, it is conceivable that assimilation in coming is coronal assimilation of the /-ɪn/ allomorph. Therefore, we also examined 89 tokens of something but and 92 tokens of nothing but, since these words are not affected by -ing allomorphy. In a listening test supported by visual examination of spectrograms, 6/89 (6.75%) of tokens of something but and 6/92 (6.5%) of tokens of nothing but were found to have unambiguous [m] at the end of thing. Since there is anecdotal evidence that some speakers have lexical alveolar nasals in these words too,Footnote 8 we identified all remaining tokens of something and nothing produced by the speakers of these twelve assimilated tokens. Figure 9 presents a selection of tokens of something and nothing produced by three of these speakers in both assimilation and non-assimilation contexts. The velar nasal evident in non-assimilation contexts shows that, for these speakers at least, the assimilation is from a velar to a bilabial place of articulation.

Figure 9 Unassimilated (left) and assimilated (right) forms of nothing and something in the speech of three male speakers: (a) speaker PS0S4; (b) speaker PS3KY; (c) speaker PS0LU. Arrows indicate the F2 of word-final nasals; tracks superimposed on the spectrograms show the lowest four formant frequencies, as estimated by Praat.
4 Accounting for variation in the place of articulation of nasals
‘Coronal underspecification’ (Avery & Rice Reference Avery and Rice1989) offers an unambiguous prediction about word-final labials and velars: their place of articulation should not assimilate to that of following consonants. We have tested this prediction against over 15,000 tokens of relevant word-pairs from a corpus of natural English speech, and have found strong evidence that word-final bilabial and velar nasals do sometimes assimilate to following consonants.Footnote 9 For instance, in coming back, the mean F2 frequency of /ŋ/ is lower than in coming down, but not as low as the F2 frequency of /m/ in come back; in something but and nothing but, the F2 of /ŋ/ is similar to that of an [m]; and in seem to, the F2 of /m/ is as high as the F2 of /n/ in been doing, despite the fact that such an assimilation could lead to lexical confusion with seen to (and contrary to the theory that such distinctive contrasts should restrict phonetic variation; e.g. Lavoie Reference Lavoie2002). Such examples conclusively demonstrate that word-final /m/ and /ŋ/ in English regularly assimilate to the place of articulation of the following consonant; nasal place assimilation is not restricted to coronals.
These counterexamples to the predictions of ‘coronal underspecification’ mean that phonological theory needs to be revised. In this section, we first consider how a rule- or constraint-based analysis of assimilation could be extended to include non-coronal assimilation. We then present an alternative probabilistic model, in which alveolars, bilabials and velars can all assimilate, but with different ranges of variation.
4.1 Rules vs. exceptions to coronal underspecification
As we have demonstrated, the constraint in (3) is contradicted by the fact that it is possible for /m/ and /ŋ/ to assimilate to following consonants. However, our data pose a more fundamental problem for underspecification in a standard rule- or constraint-based phonological framework: assimilation of non-coronal nasals to following coronals, as in seem to → see[n] to, cannot be expressed in the notation of coronal underspecification. For ‘assimilation by backward spreading’ to work in this case, the coronal consonant with which the second word begins must have some place of articulation content to spread backwards and thereby overwrite the word-final labial place feature(s). But if coronals have unspecified place, there will be no feature such as coronal to spread backwards onto the preceding nasal.
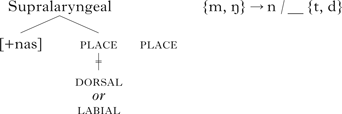
A possible way out of this difficulty is to establish a second – exceptional – rule to allow for deletion of word-final dorsal or labial place before a following coronal, as in (5).
-
(5)

Having such an additional ‘exception’ rule has certain attractions. First, it could allow us to retain (2) and the generalisation that it captures, namely that assimilation is common in coronals. Second, it allows us to treat coronal and non-coronal assimilation as quantitatively different. For example, if we wish to associate probabilities or weights to the rules, as in the Variable Rule formalism of Cedergren & Sankoff (Reference Cedergren and Sankoff1974), there is no difficulty: (2) could be given a much higher weight or probability than (5). However, (5) still suffers from a severe problem, endemic to underspecification theory: here, ‘empty place’ means ‘specifically, invariably coronal’, whereas in (2), empty place means ‘coronal, but may be filled by some other place specification’, i.e. not invariably coronal. The problem, at root, is that underspecification theory overworks the use of empty nodes (Broe Reference Broe1993: 203–206): ‘empty’ can mean ‘the unmarked value of some contrast’ – the emptiness is significant, as in (5) – or it can mean ‘unspecified and thus susceptible to change by spreading’, as in (2).Footnote 10
A further weakness is that (5) only applies to following coronal contexts. To permit labials or velars to assimilate to following velars or labials respectively, additional rules complementary to (5) are needed, such as (6).
-
(6)

Now we have at least three rules: a main or default rule, (2), and two exceptions, (5) and (6). The addition of exceptions to deal with the new facts we have presented complicates the analysis.
(2), (5) and (6) miss the most important generalisation revealed in our data: in English, a word-final nasal with any place of articulation (in its citation/isolation form) can assimilate to any place of articulation of a following obstruent, as in (7).
-
(7)

Though (2) is not false, and does capture the most common case, it is essentially incorrect – because it is insufficient – as a general rule of place assimilation in English. On the other hand, though (7) captures all the cases, it does not reflect the fact that coronal assimilation, bilabial assimilation and velar assimilation do not occur with equal frequency. It is time for a rethink.
4.2 Probabilistic underspecification using Gaussian mixtures
Figures 3 and 4 above plot variation within a population, the set of Audio BNC speakers who happen to have uttered relevant word-pairs in our dataset. While the continuum of (acoustic) variation in the population is self-evident, we have no evidence that the articulation of /m/, /n/ or /ŋ/ in the speech of any individual varies continuously (apart from the usual variation due to coarticulation, which is small in comparison with the wide variations seen in our histograms). However, we have seen evidence of a bimodal distribution in the F2 data from one individual (Fig. 7). Furthermore, though variation in place of articulation between /n/ and /ŋ/ (i.e. via [ṉ], [ɲ], etc.) is potentially continuous, the choice between the coronal and dorsal articulators is discrete. Moreover, articulatory continua between /ŋ/ and /m/ or between /n/ and /m/ are not physiologically conceivable. Thus, in producing, say, word-final /m/, a speaker alternates between distinct variants, which determine whether to make the oral closure using the lips, the tongue tip or the tongue dorsum, the choice being conditioned by the following context. The continuous but bimodal distribution of seem to and see[n] to shown in Fig. 6 above suggests that a probabilistic analysis is called for, for modelling assimilation within individual speakers as well as in a population sample.
Keating (Reference Keating, Kingston and Beckman1990) proposes an approach to modelling phonetic variation in which each target (on each articulatory dimension) is represented with a broader or narrower range, or window, of permitted variation. A narrow window presents a more specific, constrained articulatory target, while a broad window models underspecified, more variable articulations (Fig. 10a). Where the window of variation is very wide, quite large deviations from the typical pronunciation are possible. A model of this type supports constraints on variability such as canonically velar plosives admitting a very wide range of coarticulatory variation before following vowels (wide window or distribution = unconstrained, highly underspecified), whereas bilabial plosives have a much narrower range of variation (narrow window or distribution = more constrained, more tightly specified). This idea was implemented in a probabilistic form and used to model real articulatory data by Blackburn & Young (Reference Blackburn and Young2000), as in Fig. 10b. Their probabilistic extension to Keating's model encodes the idea of a more probable central tendency, with permitted, but less likely, variants that may be rather different from the typical pronunciation. Blackburn & Young model the phonetics of each place of articulation specification using a Gaussian probability density function which is broader for ‘underspecified’ place and narrower for more tightly specified places. In Fig. 10b these Gaussian functions are drawn on the vertical axis because the figure incorporates a time dimension; in the figures we present elsewhere in this paper, the Gaussians relate to a single interval, the nasal consonant, and are therefore drawn horizontally.Footnote 11

Figure 10 (a) Simulated articulator trajectory (solid line), using the window model of coarticulation (from Blackburn & Young Reference Blackburn and Young2000, after Keating Reference Keating, Kingston and Beckman1990). The trajectory is constrained to pass through the ‘windows’ indicated by the dashed horizontal lines. (b) Simulated articulator trajectory (dashed line) using a probabilistic coarticulation model (from Blackburn & Young Reference Blackburn and Young2000). The midpoints of successive phonemes are indicated by the dotted vertical lines, and associated with each midpoint is a probability distribution, defining the probability that the articulator will take particular positions at the midpoints.
Although Blackburn & Young's version of Keating's model was proposed to account for coarticulation, it can be extended to model variation due to assimilation, provided that it is adapted to include potentially bimodal distributions in articulatory or acoustic variation. Rather than plotting the variation in articulatory positions, we use an acoustic measure, F2 frequency, as a proxy for place of articulation, just as in the distributions in Figs 3 and 4. Thus the Gaussian F2 distributions for bilabial, velar and alveolar place given in Figs 3b and 4b are probabilistically underspecified acoustic representations of the canonical place of articulation distinctions between /m/, /n/ and /ŋ/. Where assimilation leads to a categorical change in the articulator used, the data will contain some mixture of assimilated and unassimilated nasals. For example, the nasal in seem to is canonically bilabial, but a certain proportion of instances may be alveolar, making the distribution wider and possibly bimodal, whereas the nasal in come back is specifically bilabial, modelled with a narrower (more constrained, more tightly specified) window. We model such mixtures using weighted combinations of simple Gaussians: Gaussian mixture models.Footnote 12 This is illustrated in Fig. 11, which shows the Gaussian models of /m/ and /n/ (female speakers), as in Fig. 3. Gaussian mixtures, created from weighted sums of the simple Gaussian models of /m/ and /n/ in varying proportion, are also plotted. It can be seen that the 80% /m/ + 20% /n/ mixture is quite close to the pure 100% /m/ Gaussian, the 20% /m/ + 80% /n/ mixture is close to the pure 100% /n/ Gaussian, and the other mixtures are, of course, in between. In order to find the appropriate proportion of x% /m/ + y% /n/ (or /ŋ/, as the case may be) for a given set of data, we fit a function as in (8) to the observed distribution, finding the values a1 and a2 for which the difference between the model and the observed data is minimised.
-
(8)

The means and standard deviations μ1, σ1, μ2 and σ2 are obtained from the means and standard deviations of unassimilated /m, n, ŋ/ in Figs 3 and 4. μ1 and σ1 are the mean and standard deviation of the lexical nasal, and μ2 and σ2 are the mean and standard deviation of the nasal with the place of articulation of the following obstruent. f is the F2 frequency parameter.

Figure 11 Gaussian models of /m/ and /n/, together with Gaussian mixture models (weighted sums of the Gaussian models of /m/ and /n/).
Figure 12 illustrates how this approach models the combination of unassimilated and assimilated /m/ tokens in the nasal portion of the word-pair seem to, whose distribution is shown in Fig. 6 above. Fig. 12a plots simple Gaussian models for unassimilated /m/ and /n/, and a Gaussian mixture model for /m/ + /n/, i.e. a mixture of the unassimilated [m] and assimilated [n] variants of /m/ in seem to, based on the data from female speakers; Fig. 12b plots the corresponding models based on data from male speakers.

Figure 12 Modelling a combination of unassimilated and assimilated /m/ tokens, using Gaussian mixtures: (a) female speakers; (b) male speakers. Gaussian models of /m/ and /n/ are given for reference. Squares are Gaussian mixtures of /m/ and /n/ (female speakers: a 1=1739, a 2=7453, μm=1554 Hz, σm=302 Hz, μn=1838 Hz, σn=271 Hz; male speakers: a 1=−3705, a 2=18,183, μm=1214 Hz, σm=218 Hz, μn=1404 Hz, σn=287 Hz).
In like manner, Fig. 13 illustrates how this approach models the combination of unassimilated and assimilated /ŋ/ tokens in the nasal portion of the phrases coming back and coming down in the speech of male and female speakers seen in Fig. 8. It shows Gaussian mixture models for /ŋ/ + /m/, i.e. a mixture of the unassimilated [ŋ] and assimilated [m] variants of /ŋ/ in coming back, and /ŋ/ + /n/, i.e. a mixture of unassimilated [ŋ] and assimilated [n] variants of /ŋ/ in coming down. The distributions of unassimilated and potentially assimilated tokens in these two figures illustrate how Blackburn & Young's probabilistic model of varying degrees of articulatory specification can be extended to model the assimilation of word-final nasals in different contexts: the phonological ‘rule’ is that a Gaussian mixture of the F2 distribution of lexical nasals and the F2 distribution of nasals with the place of articulation of the following consonant accurately models the variation observed in each assimilatory context, as expressed in (8) above. We discuss further in the following section why we view this as a phonological process.

Figure 13 Modelling a combination of unassimilated and assimilated /ŋ/ tokens in coming back vs. coming down; (a) female speakers; (b) male speakers. Gaussian mixture models for /ŋ/, of the form a 1 probdf(f,μ1,σ1)+a 2 probdf(f,μ2,σ2), using the means and standard deviations of /ŋ, m, n/. Black circles are Gaussian mixtures of /ŋ/ and /m/ (female speakers: a 1=3990, a 2=2979, μŋ=1751 Hz, σŋ=371 Hz, μm=1554 Hz, σm=302 Hz; male speakers: a 1=3028, a 2=3701, μŋ=1299 Hz, σŋ=336 Hz, μm=1214 Hz, σm=218 Hz). Grey squares represent a Gaussian mixture of /ŋ/ and /n/ (female speakers: a 1=−359, a 2=5695, μn=1838 Hz, σn=271 Hz; male speakers: a 1=−2916, a 2=7791, μ n =1404 Hz, σ n =287 Hz). Grey circles represent simple (unmixed) Gaussian models of /ŋ/ for reference.
4.3 Gaussian mixtures as phonological models of assimilation
The difference between (phonetic) coarticulation and (phonological) assimilation can sometimes be unclear. For example, the dentalisation of final coronal nasals before dental fricatives, e.g. [ɪn̪ðə] in the, is similar to assimilation, but is often regarded as coarticulation because (a) there is no separate phoneme /n̪/ in English, and (b) it is variation within the single place category coronal. Similarly, the coarticulatory differences between the /k/ in keep, cart and cool are phonetic variations within the place category dorsal. Assimilation of /m/ to [n], /m/ to [ŋ], /ŋ/ to [n] or /ŋ/ to [m] is of a quite different character: not variation within a place category, but involving alternation in the choice of articulator, as argued at the beginning of §4.2.Footnote 13 For example, Fig. 14 is a still image of United States President Barack Obama midway through saying I'm in I'm gonna convince; this is one of four video frames in which he articulates the medial [ŋ] of [ʌŋənə]. In all of those frames, it is quite evident that his lips never close, as they would for an [m]; there is no bilabial closure in this token – he uses a distinctly different articulator, indicating a categorical assimilatory switch, not a gradient process of coarticulation.

Figure 14 Image of President Obama midway through saying I'm in I'm gonna convince. (Source: PBS Newshour/YouTube; http://www.youtube.com/watch?v=s4OwubYrL2c#t=9m24s). An AVI file of the I'm gonna clip is available in the online version of the paper, and at http://www.phon.ox.ac.uk/jcoleman/Obama_I_m_gonna.avi.
The pronunciation of /m/ as [n] or [ŋ] and of /ŋ/ as [m] or [n] thus clearly constitutes assimilation. Moreover, we have amassed a range of empirical evidence demonstrating that such assimilation, though a little rarer than coronal assimilation, is systematic in our large corpus of natural speech data. It must therefore be a function of the phonological knowledge of our speakers, just as the possible articulation of /n/ as [m] or [ŋ] is generally accepted to be. As we have seen (§4.1), although it is possible to model it by introducing supplementary abstract rules (or constraints), this becomes excessively complicated and ends up masking the important generalisation that all word-final nasals may assimilate.
We have shown how Keating's model of coarticulation can be extended and adapted to model assimilation using Gaussian mixtures. The simple Gaussian models from which the mixtures are composed are abstractions over the phonetic data, just as a category such as [+voice] is an abstraction over a range of VOT values. While each individual F2 datum for /ŋ/ is, clearly, a phonetic event, we regard a distribution such as probdf(f,μŋ,σŋ) as a single phonological primitive (in this case, a specification of place of articulation). The Gaussian mixtures constructed from such objects encode the probability of choice between two or more such phonological possibilities in a given context.
6 Conclusion
The size of the Audio BNC has allowed us to show, contrary to numerous earlier statements, that word-final /m/ and /ŋ/ can and sometimes do assimilate in English to the place of articulation of following word-initial obstruents, a fact that is inconsistent with the phonological theory of coronal underspecification. Non-coronal assimilation is found in the speech of a large number of speakers. It is detectable auditorily, and visible in spectrograms. Moreover, F2 frequency varies according to the place of articulation of following consonants in the ways we expect it to, and these patterns are statistically robust. This is as systematic for /m/ and /ŋ/ as it is for /n/. The strength of phonetic evidence for non-coronal assimilation indicates that it is real, yet its relative rarity calls for a new kind of analytical framework, in which the different frequencies of assimilation are explicitly encoded probabilistically. We have shown how histograms of observed F2 distributions of canonical, unassimilated ‘control’ forms can be modelled using Gaussian probability density functions, and how the F2 distributions of nasals in assimilation context can be modelled using Gaussian mixtures of those canonical forms. This new, probabilistic approach extends Keating's (Reference Keating, Kingston and Beckman1990) ‘phonetic underspecification’ model to cover cases of phonological assimilation, i.e. the optional selection of a distinct place of articulation. This model is an abstraction over the data, just as phonological rules are. It is an underspecification model because it does not specify which place of articulation will be selected in any given instance, instead allowing for a range of contextually conditioned variants. It has two major advantages over the rule/constraint-based model: firstly, the same model can be applied to word-final /m, n, ŋ/, without the need for supplementary rules for exceptions. Secondly, because it is probabilistic, it captures not simply the fact that assimilation may occur in a given context (as do rules (2) and (7)), but also the likelihood of its occurring for a given nasal in a given context. It is therefore more descriptively adequate.

