Although the paper by Claassen et al Reference Claassen, Carmody, Stewart, Bossarte, Larkin and Woodward1 investigates an exciting issue, I have some concerns about the model identification. It seems that the authors identified the appropriate model of the time series only by using the Akaike Informations Criterion (AIC), which has certain limitations. For example, the selected ARMA (15,0) and ARMA (0,6) models are of high order and long memory. In general, the AIC suggests such models of high order only when a trend or seasonality is present in the analysed time series. Usually, if a time series is stationary, a model of an order below three is found.Reference Rinne and Specht2 A more complex method for model identification that avoids relying only on the AIC was introduced by Box & Jenkins.Reference Rinne and Specht2 Their algorithm includes several acquisition parameters in the process of model identification, which are:Reference Helfenstein4 0, make the series stationary, consider differencing; 1, choose a provisional model; 2, estimate the model parameters; and 3, check the adequacy of the model.
One key aspect is the requirement of stationarity. If the time series is not stationary, an ARIMA model should be considered instead of a mere ARMA model. The ARIMA model enables one to include terms for a trend or seasonality, respectively, directly in the model. The high order of the chosen model makes it likely that the time series in the paper indeed possesses a trend or seasonality. Furthermore, as the ultimate assessment of a correct model, Box & Jenkins demanded non-significant autocorrelations of the residuals, which were apparently also not checked in the paper. As these important aspects were not respected, the chosen model might not be correct.
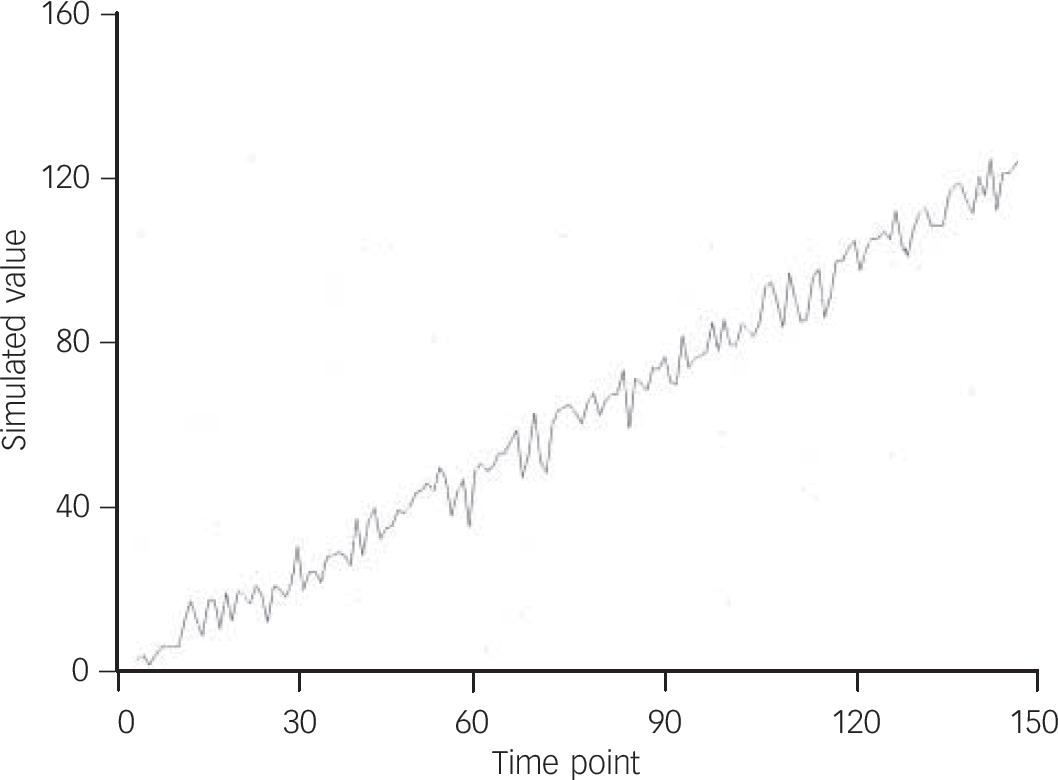
Figure 1 below displays a time series with an underlying trend. When an ARMA model is assumed, the AIC suggests an ARMA (6,0), which does not fulfil the requirement of non-significant autocorrelations of the residuals on a significance level of α = 0.05. Nevertheless, the simple differentiation of the time series leads to a straightforward ARIMA (1,1,2), which, in contrast to the previous case, meets this requirement.

Fig. 1 Exemplary time series with an underlying trend.
The consequence of a non-fitting model would be a falsely estimated standard error, which would directly lead to insufficient statistical tests and thus incorrect P-values.Reference Rinne and Specht2,Reference Helfenstein4-Reference Box and Tiao6 When the control group of suicides in 1998 was regarded, an even larger post-9/11 effect over a period of 180 days was found than in the group of interest (suicides in 2001). This effect was rejected because of non-significant statistical tests, which is, as shown above, not appropriate under the performed model identification. Therefore, it would be necessary to re-evaluate the considered time series in terms of model identification by the Box & Jenkins method and apply them again to the time series. I expect a notable change of results.


eLetters
No eLetters have been published for this article.