There is recent scientific and clinical interest in conjugated linoleic acid (CLA), for its putative role in enhanced immune function, altered substrate metabolism and body composition changes. Linoleic acid is an 18-carbon PUFA with two double-bonds in the 9 and 12 positions (cis configuration). In CLA, the double bonds reside in either the 9 and 11 positions (predominant form in food), the 10 and 12 positions or the 11 and 13 positions. The primary dietary source of CLA is found in food products from ruminant animals, such as cheese, milk and meat.
In animal and tissue studies, CLA has been associated with lower blood lipid levels, reduced body fat accumulation and increased fat oxidation, increased lean mass accretion, improved skeletal muscle insulin sensitivity and reduced food intake (Houseknecht et al. Reference Houseknecht, Vanden Heuvel, Moya-Camarena, Portocarrero, Peck, Nickel and Belury1998; Rahman et al. Reference Rahman, Wang, Yotsumoto, Cha, Han, Inoue and Yanagita2001). However, there appear to be large inter-species differences in response to CLA that may limit the interpretation or extrapolation to human studies. For example, Terpstra (Reference Terpstra2001) has estimated that the normalised, body fat-lowering effects of CLA are 7-fold higher in mice than in man. Therefore, for the purposes of this paper, only the results of human studies will be discussed. However, human studies examining the metabolic effects of CLA supplementation show equivocal results.
A series of well-controlled studies undertaken at the University of California found that 64 d of CLA administration (3·9 g/d) in seventeen healthy female volunteers did not result in changes in body composition, energy expenditure, substrate utilisation, appetite or plasma lipid profile (Medina et al. Reference Medina, Horn, Keim, Havel, Benito, Kelley, Nelson and Erickson2000; Zambell et al. Reference Zambell, Keim, Van Loan, Gale, Benito, Kelley and Nelson2000; Benito et al. Reference Benito, Nelson, Kelley, Bartolini, Schmidt and Simon2001). Failure to show an effect in these studies may be due, in part, to low statistical power, or differences in isomer-specific efficacy. The CLA used in these studies contained less than 25 % t10c12 and less than 18 % c9t11 isomers. In contrast, studies including more than fifty free-living overweight volunteers found that CLA administration of ≥ 3·4 g/d for 12 weeks was associated with significant reductions in body fat mass compared to placebo administration (Blankson et al. Reference Blankson, Stakkestad, Fargertun, Thom, Wadstein and Gudmundsen2000). In a recent study, Kamphuis et al. (Reference Kamphuis, Lejeune, Saris and Westerterp-Plantenga2003a), also found that CLA administration resulted in a significant increase in lean body mass and associated changes in resting metabolic rate, as well as reductions in appetite sensations.
Changes in body fat distribution have also been demonstrated with CLA supplementation. Risérus et al. (Reference Risérus, Berglund and Vessby2001) demonstrated a significant decrease in sagittal abdominal area in a small sample of obese, middle-aged men with signs of the metabolic syndrome when supplemented with 4·2 g/d of CLA for 4 weeks. However, they were unable to demonstrate any associated changes in blood lipids or glucose and insulin concentrations with CLA supplementation. In a follow-up study, the same group demonstrated that administration of 3·4 g/d of an enriched t10c12 CLA isomer for 12 weeks increased insulin resistance, fasting glucose and dyslipidaemia in abdominally obese men (n 19) (Risérus et al. Reference Risérus, Arner, Brismar and Vessby2002). However, these adverse metabolic effects were not found when a commercial CLA mixture (35·9 % t10c12 and 35·4 % c9t11) was administered. Further to this study, 12 weeks of supplementation with a similar dose of predominantly c9t11 isomer-enriched CLA resulted in a significant reduction in insulin sensitivity in abdominally obese men (Risérus et al. Reference Risérus, Vessby, Arnlov and Basu2004a). Therefore, these studies highlight the complex relationships between CLA isomers and dose, metabolic phenotype, and the potential underlying mechanisms of effect of CLA in influencing glucose and lipid metabolism in vivo (Risérus et al. Reference Risérus, Vessby, Arnlov and Basu2004a).
Furthermore, there are few studies in which these relationships have been interrogated in persons who are regularly exercising (Thom et al. Reference Thom, Wadstein and Gudmundsen2001). This has important implications, as changes in substrate oxidation and tissue sensitivity to insulin associated with training may interact with the effects of CLA administration on body composition, glucose and lipid metabolism. Moreover, these individuals constitute a population who may be likely to use dietary supplements for health and weight control. By relating changes in adipose tissue mass to changes in whole body substrate oxidation and metabolism, satiety and energy intake, we may begin to understand the potential mechanisms underlying these effects.
The primary aim of the present study was, therefore, to measure the effects of CLA administration versus a high-oleic acid sunflower oil control, on whole body substrate oxidation at rest and during exercise, resting energy expenditure, body composition and regional adipose tissue distribution in regularly exercising individuals. A secondary aim was to examine the effects of CLA on blood lipid profiles, glucose homeostasis and insulin sensitivity in already exercising, normal-weight persons.
Methods
Subjects
Sixty-four regularly exercising subjects (twenty-six men, thirty-eight women), between the ages of 21 and 45 were recruited from the fitness centre of the Sports Science Institute of South Africa or a similar facility. Persons were excluded on the basis of chronic illness or medication, existing lipid disorders, obesity (BMI>30 kg/m2), diabetes or hypertension. Women who were lactating or who were planning on becoming pregnant were also excluded. Individuals were also excluded if they were currently taking nutritional supplements, other than a general multi-vitamin supplement. Only subjects who were exercising three or more times per week, and who had been exercising at this level for more than 6 months, were included. Furthermore, subjects must have been weight stable ( ± 2–3 kg) for 3 months preceding the trial.
The subjects were informed of the nature of the trial, and all potential risks and benefits were explained to them. Informed written consent was obtained from all subjects before the start of the trial. The Research and Ethics Committees of the Faculty of Health Sciences, University of Cape Town, South Africa, approved the study.
Protocol
The study was a double-blind, controlled trial and the subjects were randomly assigned to one of two groups, receiving either 3·9 g CLA supplement (Formule Naturelle Ltd, Johannesburg, South Africa, containing Clarinol™ from Loders Croklaan, Lipid Nutrition, Wormerveer, The Netherlands) or control supplement (3·9 g high-oleic acid sunflower oil, HOSF), per day. The CLA capsule contained 65·9 % CLA, of which the main constituents were c9t11 isomer (29·7 %) and c10t12 isomer (30·9 %), and also contained minimal amounts of other CLA isomers (2·9 %). In addition, the capsule contained oleic acid (18: 1n-9, 24·7 %), and a small amount of palmitic acid (16: 0; 3·5 %), stearic acid (18: 0; 1·3 %) and linoleic acid (18: 2n; 9; 12; 1·9 %).
Experimental subjects and controls were tested prior to and at the end of the 12-week period of intervention. Every 2 weeks the subjects met with registered dietitians to report any adverse events (e.g. diarrhoea, bloating) or any changes in training, lifestyle or eating patterns, and to assess pill compliance. In addition, at each of these visits, subjects were asked to complete a visual analogue scale measuring hunger, fullness, satiety and prospective intake, prior to and for 3 h following the ingestion of a standardised breakfast snack.
Subjects underwent preliminary screening for cardio-respiratory fitness; body composition by skinfold measurements, dual-energy X-ray absorptiometry (DEXA) and computerised tomography (CT) scans at the level of L4/L5. Oral glucose tolerance tests (OGTT) were conducted and blood lipid profiles were measured. In addition, fasting RMR and RER, as well as RER during exercise at pre-set relative low- and high-intensity workloads (25 % and 65 % VO2max) were measured.
Eating behaviour
Prior to the intervention, the Three-Factor Eating questionnaire was administered to screen for individuals demonstrating restrained eating, or high levels of dietary disinhibition (Stunkard & Messick, Reference Stunkard and Messick1985).
Dietary assessment
Subjects completed three 4 d dietary records (three weekdays and one weekend day) during the trial, in weeks 1 (baseline), 6 and 12. These dietary records were coded by the same dietitian, and analysed with the Food Finder Program (Medtech, Tygerberg, South Africa).
Training
Over the 12-week period, the subjects recorded their daily physical training which was then quantified according to metabolic equivalents (MET-h/week). In addition, physical activity was measured using a 7 d physical activity recall questionnaire prior to the start of the intervention, and at the end of the 12-week period. Habitual activity was expressed as MET-h/wk (Blair et al. Reference Blair, Haskell, Ho, Paffenbarger, Vranizan, Farquhar and Wood1985). The subjects were instructed to keep their training and diet constant throughout the trial, and any changes were recorded.
Body composition assessment
Body composition assessments were undertaken immediately prior to and after 12 weeks of intervention. The anthropometric measurements, including the sum of seven skinfolds (biceps, triceps, subscapular, suprailiac, abdominal, thigh and calf), weight, height, and waist and hip circumferences were obtained. In addition, subjects underwent precise measurement of whole body, body composition using fan-beam DEXA.
CT was used to assess both visceral adipose tissue and subcutaneous adipose tissue area (cm2); Yoshizumi et al. Reference Yoshizumi, Nakamura, Yamane, Islam, Menju, Yamasaki, Arai, Kotani, Funahashi, Yamashita and Matsuzawa1999), using a Toshiba X-press helical scanner (Japan). Subjects were scanned in the supine position with legs slightly flexed and arms raised above the head. Scans were done in arrested expiration at the L4/L5 level of the vertebra.
Visual analogue scale measures of appetite
Subjective motivation to eat (hunger, satiety, fullness and prospective consumption) was assessed by repeated administration of 100 mm visual analogue scales (VAS) (Flint et al. Reference Flint, Raben, Blundell and Astrup2000) prior to a test breakfast in the fasted state (10–12 h) and then hourly for 3 h following the test meal. These VAS ratings were completed in the fasted state, every 2 weeks, through the 12-week intervention. The test breakfast comprised a 100 g muffin (Muffinmate CC, Cape Town, South Africa) and 200 ml pure fruit juice (Parmalat, Stellenbosch, South Africa), which were individually packaged. The composition of the muffin per 100 g was 2749·4 kJ, 50·9 g protein, 31·6 g fat, 37·4 g carbohydrate, while the fruit juice contained 13·5 g carbohydrate/100 ml.
Oral glucose tolerance test and fasting blood lipid profiles
Prior to starting the trial and after 12 weeks of supplementation the subjects underwent a standard OGTT after a 10–12 h overnight fast. A fasting blood sample (20 ml) was drawn for the determination of plasma glucose and insulin concentrations, and serum triacylglycerol, total cholesterol, HDL-cholesterol, LDL-cholesterol and NEFA concentrations. The subjects then ingested 75 g glucose dissolved in 250 ml water. Blood samples (6 ml) were drawn at 30 min intervals for 2 h for the determination of plasma glucose and NEFA concentrations. Blood was drawn at 30 and 120 min post-glucose ingestion for determination of plasma insulin concentrations.
Plasma glucose concentrations were determined using the glucose oxidase method (Glucose Analyzer 2; Beckman Instruments, Fullerton, CA, USA) and plasma insulin concentrations were determined by non-specific insulin RIA (Count-A-Coat Insulin; Diagnostic Products, Los Angeles, CA, USA) with intra-assay and inter-assay CV of 4·5 % and 6·6 %, respectively. Serum NEFA concentrations were analysed with enzymatic spectrophotometric measurement using a commercial kit (NEFA Half-micro test; Roche, Mannheim, Germany). Blood lipids were analysed using the Roche Modular Auto Analyzer. Enzymatic colorimetric assays were used to analyse total cholesterol, triacylglycerol and HDL-cholesterol concentrations. The LDL-cholesterol concentrations were determined using the Friedewald Formula (Friedewald et al. Reference Friedewald, Levy and Fredrickson1972).
Insulin sensitivity
Insulin resistance and insulin sensitivity were estimated from fasting and glucose-stimulated blood glucose and insulin concentrations, based on the homeostasis (HOMA; Matthews et al. Reference Matthews, Hosker, Rudenski, Naylor, Treacher and Turner1985) and the QUICKI (Perseghin et al. Reference Perseghin, Caumo, Caloni, Testolin and Luzi2001) models.
The HOMA model is used as a proxy measure of insulin resistance and correlates well to insulin resistance measured using the euglycaemic–hyperinsulinaemic clamp (Matthews et al. Reference Matthews, Hosker, Rudenski, Naylor, Treacher and Turner1985; Phillips et al. Reference Phillips, Clark, Hales and Osmond1994). It is calculated using the following equation:
The QUICKI or Quantitative Insulin Sensitivity Check model has been shown to correlate well with insulin sensitivity measured using the euglycemic–hyperinsulinaemic clamp, however, a recent modification, incorporating fasting NEFA concentrations, further improves this association (Perseghin et al. Reference Perseghin, Caumo, Caloni, Testolin and Luzi2001). The two equations used for this model are as follows:
where Gb = fasting glucose concentration (mg/dl); Ib = fasting insulin concentration (μU/ml); NEFAb = fasting NEFA concentration (mmol/l).
Insulin secretion was also assessed using the 30 min insulin increment to the 30 min glucose increment. In addition, the attenuation of NEFA mobilisation during the OGTT was described.
Maximal oxygen uptake, energy expenditure and substrate utilisation at rest and in response to sub-maximal exercise
All subjects were tested for VO2max and peak sustained power output on an electronically braked cycle ergometer (Lode, Groningen, The Netherlands) as described previously (Hawley & Noakes, Reference Hawley and Noakes1992). The results of the initial maximal test were used to determine the workload that corresponded to 25 % and 65 % of VO2max. The CV of measurement for the Oxycon Alpha was 1·4 %.
On another day, after a 10–12 h overnight fast, subjects arrived at the laboratory, and rested in the supine position for 30 min prior to the start of each test. Energy expenditure and substrate utilisation were assessed at rest, using the canopy or ventilated hood technique, by measuring O2 uptake and CO2 production at 60 s intervals for 20 min or until subjects reached steady state ( < 5 % change in RER) (VMax Metabolic Cart 229; SensorMedics, Yorba Linda, CA, USA). From these measurements, the resting energy expenditure and RER were determined using the equations of Frayn (Reference Frayn1983).
Following the resting measurements, sub-maximal exercise was performed by the subjects at two exercise intensities (25 % and 65 % of VO2max) for 15 min each on a cycle ergometer, with 15 min seated rest separating the two bouts. During the sub-maximal exercise session, substrate oxidation was calculated based on the gas exchange measured using a breath-by-breath OxyconSigma Analyser (Mijnhart, Bunnik, The Netherlands), as described previously.
Statistical analysis
Sample size was determined using GraphPad Instat™, version 2.05a (GraphPad, San Diego, CA, USA). In order to be able to detect differences in body fat mass (kg) of 1·5 kg with a standard deviation of 1·75 (kg) and differences in body fat of 1·5 % with a standard deviation of 2·0 %, at an alpha level of 0·05, and with 80 % power, we required a sample size of between fourteen and eighteen per group. This sample size takes into consideration the Bonferroni correction for multiple effects (gender and treatment). In addition, to detect differences in RMR of 0·6 MJ/d with a standard deviation of 0·7 MJ/d, we required a sample size of fourteen per group.
Two-factor, repeated measures ANOVA was used to explore changes in body composition and metabolic parameters over time, between men and women, the CLA and control groups. Where there were significant effects attributed to gender differences, we subsequently adjusted for body composition. All results are presented as means and standard deviations, and α < 0·05 was considered to be statistically significant.
Results
Subject characteristics
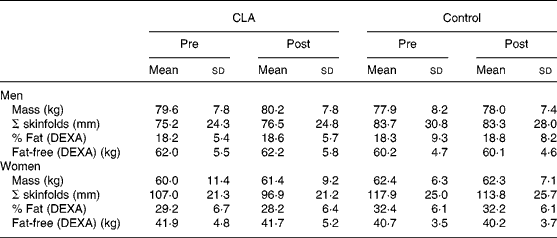
Subjects were non-obese, regularly exercising men and women, with mean ages of 32 (sd 7) years. The mean BMI and VO2max for men and women were 22·5 (sd 2·5) and 24·2 (sd 2·1) kg/m2, and 41·2 (sd 6·0) and 50·8 (sd 7·5) ml/kg per min, respectively. Subject characteristics are presented in Table 1. Groups were well matched for age, mass and anthropometrical characteristics. However, there was a significant difference in dietary restraint between the males in the control and CLA groups. When included as a covariate in the analysis, dietary constraint did not alter any of the subsequent relationships.
Table 1 Body composition changes prior to (pre) and following (post) 12 weeks of conjugated linoleic acid (CLA) administration* (Mean values and standard deviations)
DEXA, dual-energy X-ray absorptiometry.
* For details of procedures, see Methods section.
Compliance and tolerance
Sixty-two of the sixty-four subjects completed the trial. Two subjects withdrew from the trial, one due to personal reasons and the other due to medical reasons. The pill compliance was above 90 % in both groups (93·9 (sd 6·5) v. 95·2 (sd 6·0) %, for CLA and control groups, respectively). No subjects were excluded on the basis of non-compliance and co-varying for compliance in the statistical analysis did not alter any of the relationships.
The capsules were well-tolerated, with only a few subjects reporting sporadic adverse events. The adverse events reported in the CLA and control groups were headaches (6 % v. 16 %), bloating (29 % v. 23 %), diarrhoea (48 % v. 35 %), flatulence (16 % v. 0 %), skin irritation (13 % v. 19 %), and flu or cold (32 % v. 42 %), respectively. However, the occurrence of adverse events did not differ significantly between the groups.
Body composition
Body composition changes over the 12-week period are also presented in Table 1. CLA supplementation was not associated with any statistically significant changes in body mass or body composition in men or women. There were also no significant changes in regional body fat distribution in either group (Table 2), measured using either anthropometry (waist and hip circumferences) or CT.
Table 2 Regional body composition prior to (pre) and following (post) 12 weeks of conjugated linoleic acid (CLA) administration* (Mean values and standard deviations)

AT, adipose tissue.
* For details of procedures, see Methods section.
Glucose tolerance and insulin sensitivity
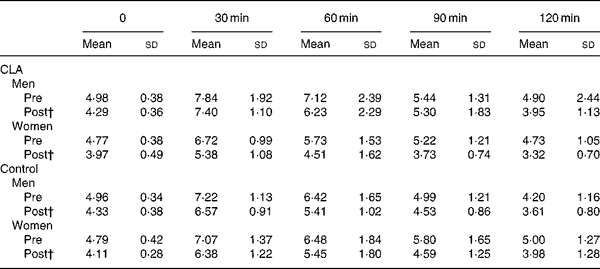
The results of the OGTT are presented in Tables 3–5. Plasma glucose concentrations were not different in response to an oral glucose load in either of the groups and in men and women following the 12-week intervention period. Although plasma glucose concentrations were not different between groups, mean plasma insulin concentrations (at 0, 30, 120 min) were statistically lower in women taking CLA following the 12-week intervention period, compared to the control group of women (P = 0·04, gender × time × treatment interaction; mean values presented in Fig. 1). A significant association was found between the change in mean plasma insulin concentrations over the 12-week intervention, and the change in body fat (r 0·36, P = 0·032). Similarly, mean serum NEFA concentrations were significantly attenuated in response to an oral glucose load after 12 weeks of supplementation in the CLA group compared to the control group (P = 0·001, time × treatment interaction).
Table 3 Changes in plasma glucose concentrations (mmol/l) in response to an oral glucose load, prior to (Pre) and following (post) the 12-week conjugated linoleic acid (CLA) intervention period* (Mean values and standard deviations)
* For details of procedures, see Methods section.
† P < 0·05, plasma glucose concentrations were lower in both groups following the 12-week intervention.
Table 4 Changes in plasma insulin concentration (μU/ml) in response to an oral glucose load, prior to (pre) and following (post) the 12-week conjugated linoleic acid (CLA) intervention period* (Mean values and standard deviations)

* For details of procedures, see Methods section.
† P = 0·05, group × trial × time interaction.
Table 5 Changes in serum NEFA concentration (mmol/l) in response to an oral glucose load, prior to (pre) and following (post) the 12-week conjugated linoleic acid (CLA) intervention period* (Mean values and standard deviations)

* For details of procedures, see Methods section.
† P < 0·01, group × trial × time interaction.
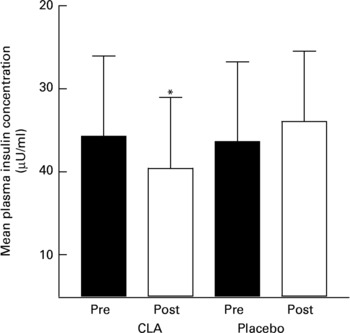
Fig. 1 Mean plasma insulin concentrations in women prior to (pre) and following (post) a 12-week intervention of conjugated linoleic acid (CLA). For details of procedures, see Methods section. Values are means with their standard deviations depicted by vertical bars. *P = 0·05 for group × trial interaction.
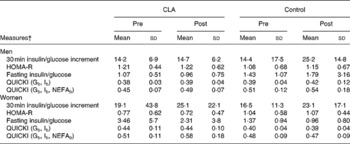
Insulin sensitivity, as measured by the increment in glucose concentrations (0–30 min) v. the increment in insulin concentrations, and by the QUICKI model (Matsuda & DeFronzo, Reference Matsuda and DeFronzo1999; Perseghin et al. Reference Perseghin, Caumo, Caloni, Testolin and Luzi2001), insulin resistance measured using the HOMA model (Matthews et al. Reference Matthews, Hosker, Rudenski, Naylor, Treacher and Turner1985), and the fasting glucose/insulin ratio, were not significantly different between treatment or control groups, in men or women (Table 6).
Table 6 Measures of insulin sensitivity and insulin resistance prior to (pre) and following (post) the 12-week conjugated linoleic acid (CLA) intervention period* (Mean values and standard deviations)
* For details of procedures, see Methods section.
† For details of measures, see Methods section.
Blood lipid profiles
Blood lipid profiles are presented in Table 7. Significant decreases were found in serum total cholesterol and LDL concentrations in both groups and decreases in HDL-cholesterol concentrations in women only, over the 12-week intervention (P = 0·001, P = 0·017 and P = 0·02, respectively). However, after covarying for body composition, these differences were no longer significant, nor were there significant changes in serum triacylglycerol concentrations in response to CLA supplementation.
Table 7 Serum lipid profiles prior to (pre) and following (post) the 12-week conjugated linoleic acid (CLA) intervention period* (Mean values and standard deviations)
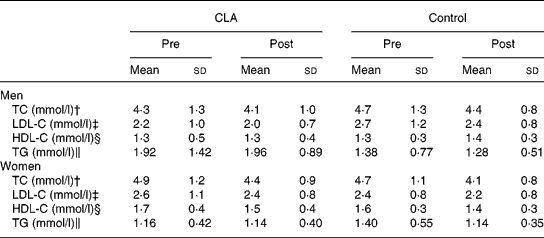
HDL-C, HDL-cholesterol; LDL-C, LDL-cholesterol; TC, total cholesterol; TG, triacylglycerol.
* For details of procedures, see Methods section.
Changes pre–post in both groups: †P = 0·001, ‡P = 0·017; §P = 0·02.
‖ P = 0·03, time × treatment interaction.
RMR, substrate utilisation at rest and during sub-maximal exercise
Resting RER and RMR, expressed in absolute (MJ/d) or relative (kJ/kg fat-free mass (FFM) per d) terms, did not change in response to CLA treatment over 12 weeks, in either men or women. However, absolute RMR decreased with weight loss in both groups, and RER increased significantly from pre- to post-testing (P < 0·001). There were also no significant differences in response to the CLA treatment over 12 weeks in substrate utilisation during sub-maximal exercise at 25 % and 50 % of VO2max (Table 8).
Table 8 RMR and RER at rest and during sub-maximal exercise at 25 % and 50 % of VO2max, prior to (pre) and following (post) the 12-week conjugated linoleic acid (CLA) intervention period* (Mean values and standard deviations)

PPO, peak sustained power output.
* For details of procedures, see Methods section.
† Changes pre–post in both groups, no group or interaction effects (P < 0·001).
Ratings of hunger, fullness, prospective consumption and satisfaction
CLA supplementation did not alter fasting measures of appetite at any stage during the trial in either men or women (data not shown). There were also no differences in perception of hunger, fullness, prospective consumption and satiety following the standardised breakfast. This was true, irrespective of whether the data were expressed as area under the curve, means or by comparing each time-point. Mean values for satiety, in response to the standardised breakfast, over the 12-week intervention period are presented in Fig. 2.
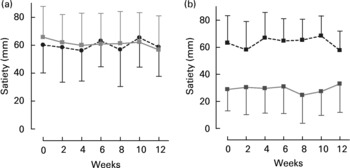
Fig. 2 Mean satiety scores for women (a) and men (b) for the conjugated linoleic acid (CLA, □) and control groups (●, ■). For details of procedures, see Methods section. Values are means with their standard deviations depicted by vertical bars. There were no effects of CLA on satiety, however, in the men, the control group had a higher overall satiety level (gender × group interaction, P = 0·02).
Dietary intake and training
There were no systematic or statistically significant changes in nutrient or energy intake (data not shown), or in training frequency reported at the beginning, mid-way or at the end of the trial. In women, physical activity, measured as MET-h/week, was 13·1 (sd 8·3) and 11·2 (sd 6·9) h at baseline and 13·0 (sd 8·3) and 9·4 (sd 7) h at 12 weeks in the CLA and control groups, respectively. In men, physical activity was 11·8 (sd 5·8) and 14·8 (sd 12·5) h at baseline and 14·7 (sd 5·9) and 10·8 (sd 5·9) h at 12 weeks in the CLA and control groups, respectively.
Discussion
The main finding of the present study was that mixed isomer CLA administration (c9t11 isomer (29·7 %) and c10t12 isomer (30·9 %), 3·9 g/d for 12 weeks) significantly reduced plasma insulin concentrations in response to an oral glucose challenge, in non-obese regularly exercising women. Furthermore, NEFA concentrations were significantly attenuated in response to oral glucose, in both men and women in the CLA group. The changes in plasma insulin concentrations with CLA supplementation may be attributable, in part, to changes in body composition, as those individuals who lost the greatest amount of body fat also had an associated decrease in mean plasma insulin concentrations (r 0·38, CLA group).
To our knowledge, this is the first controlled, clinical trial that has demonstrated this effect in normal-weight persons who are regularly exercising. Recently, a study undertaken in young, sedentary individuals found that 8 weeks of supplementation with a mixed isomer CLA, similar in content and dose to the present study, resulted in a significant decrease in mean fasting insulin concentrations, as well as an improved insulin sensitivity index in six of the ten subjects undergoing supplementation. This occurred despite no significant changes in body composition (Eyjolfson et al. Reference Eyjolfson, Spriet and Dyck2004).
The results of Eyjolfson et al. (Reference Eyjolfson, Spriet and Dyck2004) are in contrast to previous studies in normoglycaemic individuals, in which CLA administration was associated with increased plasma insulin concentrations, suggesting decreased insulin sensitivity (Medina et al. Reference Medina, Horn, Keim, Havel, Benito, Kelley, Nelson and Erickson2000), and in Type 2 diabetics, in whom fasting glucose increased and insulin sensitivity decreased with CLA supplementation (Moloney et al. Reference Moloney, Yeow, Mullen, Nolan and Roche2004). The apparent adverse effect of CLA supplementation on insulin resistance originally appeared to be isomer-specific. For example, in recent studies of abdominally obese men, treatment with dietary t10c12 isomer-enriched CLA (3·4 g/d for 12 weeks) resulted in significantly increased insulin resistance and blood glucose levels, compared to the mixed isomer or placebo controls (Risérus et al. Reference Risérus, Berglund and Vessby2001). More recently, however, this same group of researchers studied twenty-five abdominally obese men, supplemented for 12 weeks with c9, t11-enriched CLA (83 %; Risérus et al. Reference Risérus, Vessby, Arnlov and Basu2004a). In their study, insulin sensitivity, as measured by the euglycaemic clamp technique, was reduced by 15 % in the CLA group, compared to the control group. This is the first such study showing adverse effects of the c9t11 isomer-enriched CLA on insulin sensitivity in man, and thus, the isomer-specific effects are not consistent.
The findings of reduced plasma insulin and serum NEFA concentrations in response to the same level of glycaemia in the present study may suggest improved insulin sensitivity with CLA supplementation in the already insulin-sensitive women. Differences between the work of Risérus et al. (Reference Risérus, Berglund and Vessby2001, Reference Risérus, Vessby, Arnlov and Basu2004a, Reference Risérus, Vessby, Arner and Zetheliusb) and the present study, as well as that of Eyolfson et al. (Reference Eyjolfson, Spriet and Dyck2004) may be due, in part, to the fact that subjects were young adults, and not overweight. Furthermore, in both of these studies, subjects were ingesting a similar amount of mixed-isomer CLA. However, further human studies are recommended, in order to determine the specific mechanisms underlying these effects, in particular, the isomer-specific nature of the adaptations, and any potential adverse effects and dose–response relationships in obese or insulin-resistant individuals.
In the present study, reduced plasma insulin concentrations at the same level of glycaemia in the CLA women were not reflected in the indexed measures of insulin resistance (HOMA) or insulin sensitivity (QUICKI), although there was a trend towards improved insulin sensitivity (P < 0·08). This is likely due to the fact that these indices have been developed, in part, to establish a more easily administered reference for insulin. In the current study sample, subjects were generally insulin-sensitive, and found to be at the higher range of values previously reported for non-diabetic, control populations for QUICKI, and at the very low range of values for HOMA-IR (Phillips et al. Reference Phillips, Clark, Hales and Osmond1994; Perseghin et al. Reference Perseghin, Caumo, Caloni, Testolin and Luzi2001). Therefore, these indices may not be as sensitive to change in the extreme ranges, and in non-diabetic, non-obese, fit individuals.
Body composition
In the present study we failed to find an association between CLA administration and changes in body composition. In human studies, the effects of CLA supplementation on body composition have been inconsistent. For example, in a small, placebo-controlled study of healthy, non-obese women, 3·9 g/d mixed isomer CLA, containing smaller quantities of the c9t11 and t10c12 isomers, over 64 d, had no effect on body fat content (Zambell et al. Reference Zambell, Keim, Van Loan, Gale, Benito, Kelley and Nelson2000). Conversely, in studies of overweight men and women (Blankson et al. Reference Blankson, Stakkestad, Fargertun, Thom, Wadstein and Gudmundsen2000) and abdominally obese men (Risérus et al. Reference Risérus, Berglund and Vessby2001), CLA supplementation over several weeks (amounts ranged from 3·4 to 6·8 g/d mixed isomer composition (>36 % t10c12 and c9t11 isomers) for 12 weeks, or 4·2 g/d for 4 weeks) resulted in significant body fat losses. In another recent study, as little as 1·8 g CLA/d resulted in a significant reduction in body fat percentage in healthy, non-overweight men and women, who exercised for 90 min, three times weekly (Thom et al. Reference Thom, Wadstein and Gudmundsen2001). Differences between studies may be linked, in part, to the composition of the placebo control capsules, or the isomeric mix of the CLA supplement.
As training and dietary intake did not change in the present study, it is unlikely that these factors played a confounding role for effects of CLA on body composition.
Regional adipose tissue distribution
Unlike previous studies in abdominally obese individuals supplemented with CLA (Risérus et al. Reference Risérus, Berglund and Vessby2001), we were unable to detect differences in regional adipose tissue distribution, visceral or subcutaneous adipose tissue area, using anthropometrical measures and CT scans, which may not be sensitive enough to detect small changes in body fat distribution expected in non-obese, physically fit individuals.
Plasma lipoprotein levels
In the present study, we found a reduction in serum HDL-cholesterol and total cholesterol concentrations, in both groups of women, however there was no treatment effect of CLA. This is in agreement with other human trials, in which CLA supplementation (at similar concentrations for reasonably similar time periods) did not significantly alter plasma lipoprotein or serum triacylglycerol concentrations in normal-weight and overweight individuals (Benito et al. Reference Benito, Nelson, Kelley, Bartolini, Schmidt and Simon2000; Risérus et al. Reference Risérus, Berglund and Vessby2001). More recently, Noone et al. (Reference Noone, Roche, Nugent and Gibney2002) demonstrated that supplementation with a 50:50 blend of c9t11:t10c12 isomers of CLA for 8 weeks significantly reduced fasting triacylglycerol concentrations, whereas supplementation with an 80:20 blend of c9t11:t10c12 isomers of CLA reduced VLDL-cholesterol concentrations in fifty-one normolipidaemic subjects, without altering LDL-cholesterol or HDL-cholesterol concentrations.
The decrease in total cholesterol and HDL-cholesterol seen in both groups of women over the 12-week intervention period may be a consequence of increased awareness and self-monitoring of dietary intake, or the unlikely result of subtle changes in dietary fatty acid intake, and/or training. However, these changes are usually described in persons who have undergone weight loss (Sartorio et al. Reference Sartorio, Lafortuna, Vangeli, Tavani, Bosetti and La Vecchia2001).
The effects of dietary CLA supplementation (in the range of 0·1 % of dietary energy) on lipoprotein metabolism are, thus far, inconsistent. The conflicting results regarding CLA supplementation and lipoprotein metabolism may be due to genetic susceptibility, differences in dose-response, isomer content and the levels of intake of dietary fat, and specific fatty acids. In addition, the placebo control used in trials varies greatly, including olive oil, linoleic acid, safflower oil, soya oil and sunflower oil. This may explain, in part, the lack of consistent results of CLA supplementation on plasma lipid profiles.
Appetite and measures of satiety
In the present study, CLA supplementation did not alter short-term appetite, measured using a VAS, nor hunger, satiety, fullness and desire to eat, preceding and for 3 h following a standardised breakfast. The present results are in agreement with a study by Medina et al. (Reference Medina, Horn, Keim, Havel, Benito, Kelley, Nelson and Erickson2000), in a small sample of normal-weight women, in which appetite was measured over a 9-week period of CLA supplementation. Medina et al. (Reference Medina, Horn, Keim, Havel, Benito, Kelley, Nelson and Erickson2000) postulated that this method may not be sufficiently sensitive to identify subtle changes in appetite.
In contrast, in a recent study by Kamphuis et al. (2003b), they observed increases in ratings of fullness and satiety and decreased ratings of hunger, in response to a standardised meal, in fifty-four overweight subjects over 13 weeks of supplementation at dosages of either 1·8 or 3·6 g CLA/d. However, prior to CLA supplementation, subjects had followed a very low-energy diet (2·1 MJ/d) for 3 weeks.
Differences between these studies may be a result of differences in energy or macronutrient composition of the standardised breakfast, or a consequence of protocol variations. For example, in the study by Kamphuis et al. (2003b), CLA supplementation was preceded by a short-term period of dieting, and consisted of a single pre-breakfast measure. In the present study, repeated VAS tests were conducted, before a standardised breakfast and in the 2 h period following the breakfast. It is also possible that hunger and satiety ratings should have been monitored for a longer period of time (>4·5 h), as the VAS technique is shown to be more valid and correlates best to subsequent energy intake if measured over 4 h following the standardised meal (Flint et al. Reference Flint, Raben, Blundell and Astrup2000).
Resting energy expenditure and substrate oxidation at rest and during exercise
Finally, in the present study, we found no differences between treatment groups in changes in resting energy expenditure, or in substrate oxidation at rest associated with weight loss, nor during exercise. The present results are in agreement with the study by Zambell et al. (Reference Zambell, Keim, Van Loan, Gale, Benito, Kelley and Nelson2000), in which no changes were found in resting energy expenditure, RER or fat oxidation at rest. In contrast, increased resting energy expenditure was demonstrated in overweight individuals who were supplemented with CLA after having lost weight, using very low-energy diets (Kamphuis et al. Reference Kamphuis, Lejeune, Saris and Westerterp-Plantenga2003a). In the present study, however, the increase in resting energy expenditure in the CLA group was not significant after adjusting for lean body mass.
Conclusion
The findings of the present study suggest that CLA (3·9 g/d, 12 weeks) supplementation resulted in significant and favourable changes in plasma insulin and NEFA concentrations in response to an oral glucose load, suggesting improved insulin sensitivity. However, these changes were demonstrated in persons who were not overweight, and were found specifically in regularly exercising women. More studies are needed to further understand the mechanisms underlying these changes, and the possible modulating role of gender, fitness and body fat levels on the physiological response to CLA supplementation.
Acknowledgements
We thank the subjects who gave of their time without financial remuneration. Ryan Jankelowitz is thanked for his expert medical assistance. Jack Bergman and Debbie Steele of Symington and Partners and Tobie de Villiers are thanked for their extensive contribution to the research in terms of acquisition, analysis and interpretation of body composition data from the CT and DEXA scans, respectively. We are also grateful to Judy Belonje, for her expert technical assistance in performing the glucose and NEFA assays, and Jenny Ann Smuts, for her assistance in dietary analysis. This study was funded, in part, by Loders Croklaan, The Netherlands; RP Scherer, UK; Aspen Pharmacare, South Africa; and Technology and Human Resources for Industry Programme, South Africa. In addition, the UCT/MRC Research Unit for Exercise Science and Sports Medicine receives support from the Medical Research Council of South Africa, and the Nellie Atkinson and Harry Crossley Staff Research Funds of the University of Cape Town.


