INTRODUCTION
Forage plants in pastures are considered the main food source for domestic ruminant animals worldwide. Approximately half of the world beef production comes from tropical and subtropical areas of the globe, which has shown an increase in beef and veal production of c. 200% during the last 40 years (Jank et al. Reference Jank, Valle, Resende and Gilloway2005). In Brazil, the scenario is similar, with livestock production being mainly based on grassland use. Globally, Brazil has the largest commercial bovine herd, 172 million head, spread over 160 million hectares of grassland (0·36 native and 0·64 cultivated) (IBGE 2009), with 0·97 of animals fed exclusively on pastures. From 1970 to 1996, the area of native pastures decreased from 103 to 78 million ha, while that of cultivated pastures increased from 30 to 100 million ha (Jank et al. Reference Jank, Valle, Resende and Gilloway2005), indicating a rapid change towards the use of cultivated grasslands, with more than 0·60 of the total grassland area being occupied with cultivated pastures. Among these, the majority of cultivated species belong to the Brachiaria and Panicum genera and, in spite of no official statistics, it is believed that most of the Brachiaria area is occupied with marandu palisade grass (Brachiaria brizantha (Hochst. ex A. Rich) cvar Marandu), since during the 1990s, it represented c. 0·70 of all forage seed sold in Brazil (Andrade Reference Andrade, Gomide, Mattos and Da Silva2001).
Traditionally, animal production from pastures in tropical areas has consistently been related to low levels of animal performance, with productivity being <0·05 and 0·10 of the theoretical potential for milk and meat production, respectively (Da Silva & Carvalho Reference Da Silva, Carvalho and McGilloway2005), as a consequence of poor grazing management practices (Mesquita et al. Reference Mesquita, Da Silva, Paiva, Caminha, Pereira, Guarda and Nascimento2010). In general, pastures show a strong seasonality of production, resulting in large fluctuations in quantity and quality of available herbage, constraining animal production. According to Hodgson et al. (Reference Hodgson, Clark, Mitchell and Fahey1994), animal productivity depends not only on seasonal variation in herbage yield and nutritive value but also on how grazing management affects sward structure and, consequently, ingestive behaviour, herbage intake (HI) and animal performance. Although herbage quality of tropical grasses is assumed to be inferior relative to temperate grasses, animal production per unit area can be larger due to faster rates of herbage growth and accumulation, provided that harvest of the produced herbage is efficient and carried out within the limits defined by adequate sward targets for grazing management (Da Silva & Carvalho Reference Da Silva, Carvalho and McGilloway2005). Under those circumstances, targets should be decided based on knowledge of how plants respond to variations in sward structure (Hodgson Reference Hodgson, Okubo and Shiyomi1985), and management practices considered as a means of generating and/or maintaining those conditions (Hodgson & Da Silva Reference Hodgson, Da Silva, Batista, Barbosa, Santos and Ferreira2002). These concepts are well developed for temperate grass pastures, but little has been done for tropical species. Against that background, the present experiment was designed to study the influence of contrasting sward conditions defined in terms of height on animal behaviour, HI, nutritive value and body weight gain (BWG) of beef cattle heifers grazing continuously stocked marandu palisade grass.
MATERIALS AND METHODS
Experimental site, treatments and design
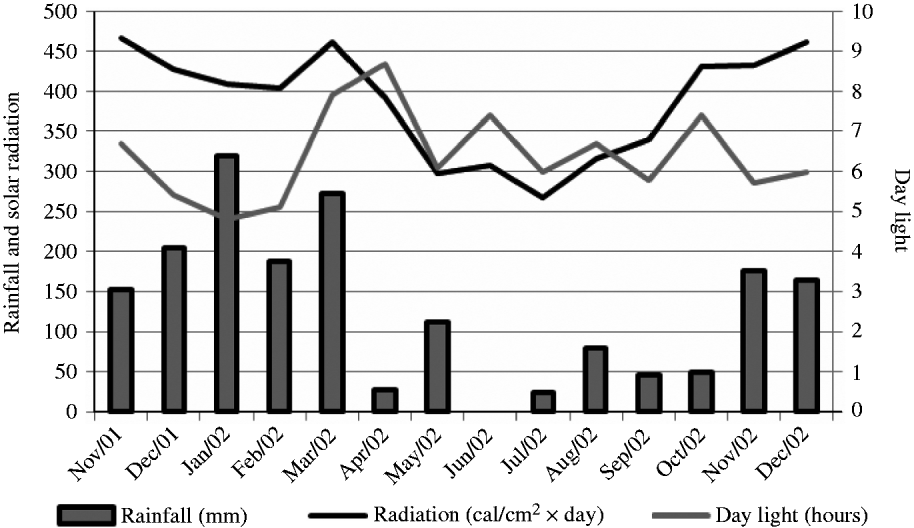
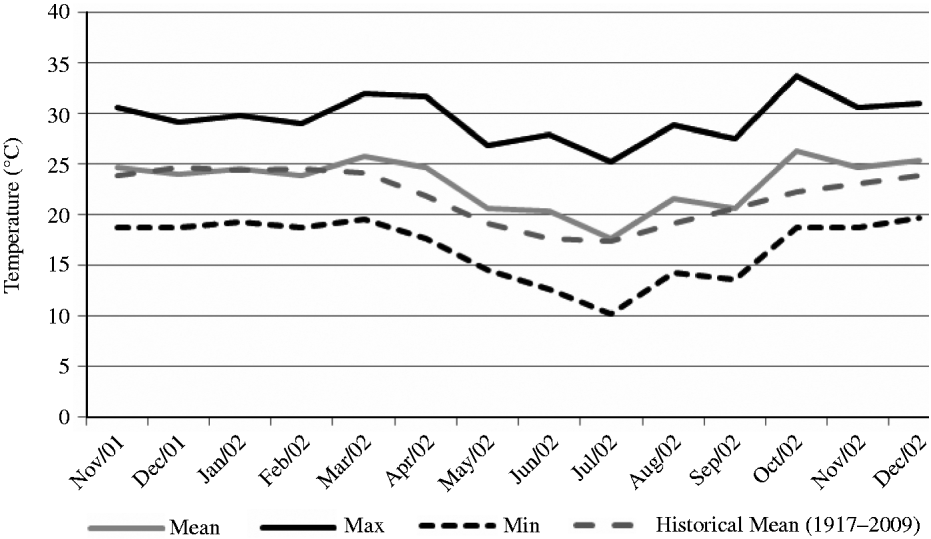
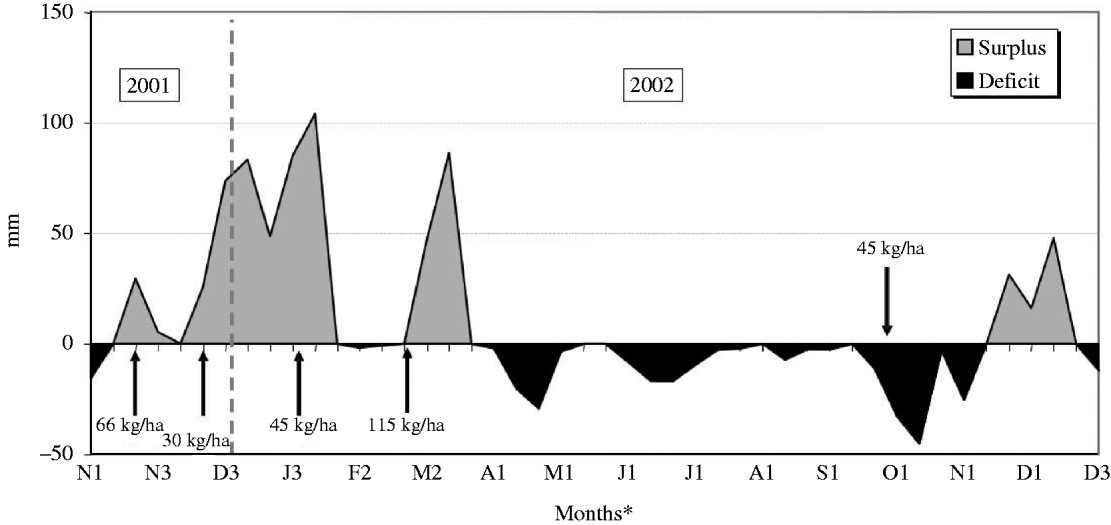
The experiment was carried out at E.S.A. ‘Luiz de Queiroz’ (ESALQ), University of São Paulo, Piracicaba, SP, Brazil (22o42′S, 47o37′W and 550 m asl) on a marandu palisade grass pasture (B. brizantha (Hochst. ex A. Rich) cvar Marandu) established in 2001 on a Eutric Kandiudalf. Average soil chemical characteristics (van Raij et al. Reference van Raij, Cantarella, Quaggio and Furlani1986) for the 0–200 mm layer were: pH CaCl2: 5·6; organic matter (OM) = 41 dg/dm3; phosphorus (P: ion-exchange resin extraction method) = 67 mg/dm3; calcium (Ca) = 74 mmolc/dm3; magnesium (Mg) = 19 mmolc/dm3; potassium (K) = 6·5 mmolc/dm3; hydrogen (H) + aluminium (Al) = 36 mmolc/dm3; sum of bases = 99 mmolc/dm3; cation exchange capacity = 134·8 mmolc/dm3; base saturation = 74%. According to the Köppen classification, the climate is Cwa (sub-tropical with dry winter). Rainfall, solar radiation and daylight hours, average mean, minimum and maximum air temperatures, and soil water balance (Thornthwaite & Mather Reference Thornthwaite and Mather1955) are shown in Figs 1–3, respectively, and indicate an average year considering historical data (1917–2002). Swards were fertilized with nitrogen (N) and K throughout the experimental period (Table 1).

Fig. 1. Monthly rainfall, solar radiation and day light hours on the experimental site from November 2001 to December 2002.

Fig. 2. Average mean, minimum and maximum air temperature on the experimental site from November 2001 to December 2002.

Fig. 3. Monthly soil water balance (calculated at 10 day intervals considering a soil water storage capacity of 50 mm) from November 2001 to December 2002 (arrows correspond to N application dates and rates).
Table 1. Dates and rates of fertilizer application throughout the experimental period
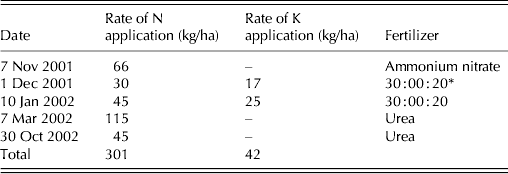
* Commercial N : P : K formula.
Treatments corresponded to four sward surface heights (SSH: 100, 200, 300 and 400 mm) generated by continuous stocking and maintained on target using variable stocking rate (SR). These were allocated to experimental units (1200 m2 paddocks) according to a randomized complete block design with four replications. The paddocks were grazed by a 2-year old Nelore (Bos taurus indicus) and Canchim (5/8 Charolais (Bos taurus taurus) × 3/8 Zebu (Bos taurus indicus)) heifers with an average initial body weight (BW) of 280 kg. The experimental period started on 8 January 2002 and finished on 14 February 2003, totalling 380 days.
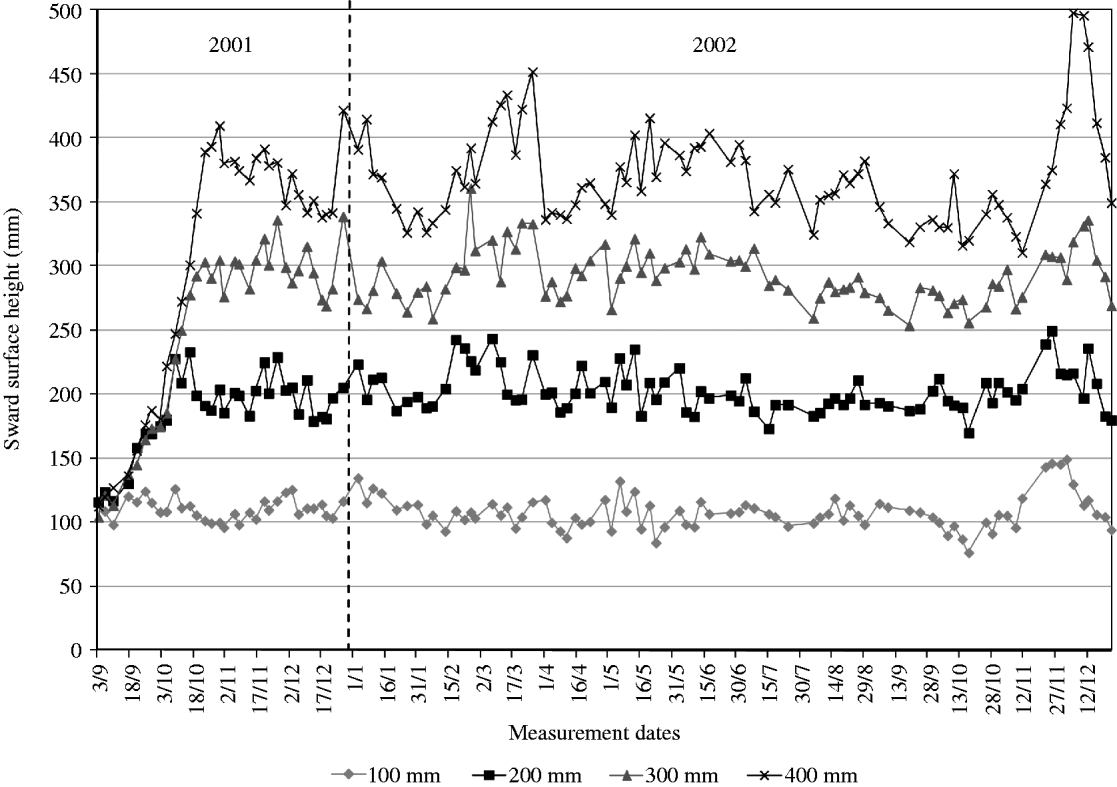
Prior to the beginning of measurements, on 28 and 29 August 2001, paddocks were grazed and subsequently mowed to c. 80 mm in preparation for the experiment. From then onwards, SSH was monitored on a weekly basis and animals introduced to paddocks as swards approached target heights. Once grazing started, monitoring of sward height was performed twice a week (3 and 4 day intervals) on 20 points per paddock using a thin acetate sheet and ruler (Fagundes et al. Reference Fagundes, Da Silva, Pedreira, Sbrissia, Carnevalli, Carvalho and Pinto1999). Average sward height on paddocks was allowed to vary by 10% around the target, with animals being added or removed when the upper or lower limit of the range, respectively, was close to being reached (Fig. 4). All paddocks had animals grazing at the end of October 2001, ensuring a minimum period of 60 days under the grazing regimes imposed until the commencement of measurements in 8 January 2002.

Fig. 4. Average SSH of experimental treatments from 3 September 2001 to 17 December 2002. Vertical line indicates the start of the experiment.
Measurements
Herbage accumulation
Herbage accumulation was measured using four 1·4 × 0·7 m exclosure cages (1·0 m2) per paddock, which were rotated every 3 weeks. After each sampling, cages were rotated and anchored on new areas representative of sward conditions (visual assessment of herbage mass and height). Herbage accumulation was calculated as the difference between the herbage mass under the cage at the last and the first day of exclusion (Davies et al. Reference Davies, Fothergill and Morgan1993). These were determined using calibration curves between sward height and herbage mass produced in a concomitant set of measurements being made in the same experimental area using a similar procedure described by Braga et al. (Reference Braga, Pedreira, Herling, Luz, Marchesin and Macedo2009).
Morphological composition and nutritive value of the herbage produced
A grazing simulation method was used to collect herbage samples for chemical analysis and digestibility determination (Sollenberger & Cherney Reference Sollenberger, Cherney, Barnes, Miller and Nelson1995). A random sample of 500 g was harvested by hand per paddock every month, placed in plastic bags and stored in a cool room. A subsample was then used to determine botanical (marandu palisade grass and other species) and morphological (leaf (lamina), stem (sheaths + stem) and dead material) composition. The remaining material was dried in a forced draught oven at 65 °C to constant weight. After drying, subsamples were ground using a Wiley Mill with a 1 mm sieve and stored at room temperature for chemical analysis.
CP was determined using the volumetric method of micro Kjeldhal (AOAC 1990) and neutral detergent fibre (NDF) and acid detergent fibre (ADF) determined according to Van Soest et al. (Reference Van Soest, Robertson and Lewis1991), adapted for the ANKOM 200 methodology (ANKOM 200 Fibre Analyzer, ANKOM Technology Corporation, Fairport, NY, USA). Determination of in vitro organic matter digestibility (IVOMD) was made as proposed by Holden (Reference Holden1999) using a Daisy Incubator II (ANKOM Technology Corp.).
Live weight gain, SR and grazing days
Measurements of animal performance were made using two test animals per experimental unit (paddock) and a variable number of extra heifers used to adjust SR and allow experimental conditions to be maintained according to the treatment specifications. Animals (test and variable stock) were weighed immediately before entering or exiting paddocks, and adjustments in SR carried out twice a week using animal's shrunk weight (12 h). Owing to the size of the paddocks relative to the BW of animals, there were times that test animals remained for less than a week or had to be away from paddocks during long periods, particularly during autumn, winter and early spring (April–November). In such cases, animals were removed from experimental units, put to graze on an adjacent area composed of the same grass species and the number of days without grazing being recorded. For that reason, measurements of daily weight gain were performed only during late spring and summer (December 2001–March 2002), the period of active and fast plant growth.
Animal behaviour, bite mass (BM) and bite rate (BR)
Measurements of animal behaviour were performed during 24 h periods in January, February, May, July, August and December 2002, with observations and identification of animals at 10 min intervals using binoculars and stop watches. For night observations, flash lights were used, with animals being habituated with the procedure at least 1 month beforehand. To facilitate identification, one of the two animals in each paddock was marked with automotive spray. A total of eight animals per treatment was originally planned (four replications – blocks – and two test animals per replication), but when pasture growth was low and not all paddocks could support animals (need to maintain targets of sward height), there was always a minimum of four animals per treatment. Measurements were carried out by a group of eight pre-trained observers allocated to blocks in pairs. At the end of each measurement period, observations of activities for each animal were combined and the time spent grazing, ruminating and with other activities throughout the day calculated accordingly.
During the 24 h periods of animal behaviour observations, animals were filmed during periods of intense grazing activity (early in the morning and late in the afternoon) from the top of two observation towers. Several tapes (10 min) were recorded for each animal with the objective of generating the largest possible number of images from animals within each paddock. From the tapes, the time spent for executing 20 bites was determined and the results used to calculate BR (Hodgson Reference Hodgson and Leaver1982).
Measurements of BM were made using oesophageal fistulated Nelore (Bos taurus indicus) heifers. Only two evaluations were carried out because fistulated animals had to be operated and trained to be used. The first measurement period was from 31 August to 5 September 2002, and the second from 10 to 14 February 2003. Four fistulated animals were used in pairs, one pair for each two blocks, early in the morning and late in the afternoon, times of more intense grazing activity. For each measurement procedure, animals were equipped with collection bags and allowed to graze for 15 min during which the number of bites taken was counted. At the end of measurement, the collection bags were removed and extrusa samples immediately placed into plastic bags, quantified, subsampled and sent for drying in a forced draught oven at 65 °C to constant weight. The results were used to calculate BM.
HI
Intake measurements were made using controlled release capsules (CRC) containing 8 g of n-dotriacontane (C32) and 8 g of n-hexatriacontane (C36) (Captec, New Zealand) to estimate HI (Burns et al. Reference Burns, Pond, Fisher and Fahey1994). Two estimates of intake were made. The first was carried out on 14 January 2002, using 27 Nelore heifers with an average BW of 280 kg. These received the CRCs after a 16-h fast period and were placed into their paddocks where they remained until the end of the measurement period. This corresponded to an 8-day interval for stabilization of n-alkanes release and another 5-day interval for faecal sampling. There was the possibility of using 32 capsules (four treatments × four replications × two animals per replication), but, because of anatomical limitations of some animals relative to the CRC size, only 27 could receive them. Faecal samples were harvested every day at 07·00 h and frozen. Later, they were dried in a forced draught oven at 65 °C until constant weight, ground and pooled across days to form one composite sample per animal. The second estimate of HI was made on 11 December 2002 using 30 Nelore heifers with an average BW of 240 kg following the same procedure described above, the only difference being that the period of faecal sampling lasted 7 days instead of 5.
During both periods of HI measurement, random herbage samples of simulated grazing were harvested using the hand plucking procedure (c. 300 g fresh weight). These were separated into two subsamples and one used for the separation of the morphological components leaf (leaf laminae) and stem (leaf sheath + stem). Both subsamples were dried in a forced draught oven at 65 °C to constant weight and ground for n-alkane profile analysis. Extraction and calculation procedures for n-alkanes followed those described by Oliveira et al. (Reference Oliveira, Medeiros, Tedeschi, Aroeira and Da Silva2007), and the results used to calculate HI.
Statistical analysis
Analysis of variance of the data was carried out using the Mixed Procedure of SAS®. The choice of the covariance matrix was made using the Akaike Information Criterion (AIC) (Wolfinger Reference Wolfinger1993), and analysis performed considering SSH, season of the year and their interaction as fixed effects and blocks as a random effect (Littel et al. Reference Littel, Pendergast and Natarajan2000). When appropriate, treatment means were calculated using the ‘LSMEANS’ statement, and comparisons made using Student t test and P ⩽ 0·05.
RESULTS
Herbage accumulation
Herbage accumulation rates (HARs) were not influenced by SSH, but varied with season of the year (P < 0·001) and with the SSH × season of the year interaction (P < 0·001). The highest and lowest values of HAR were recorded during summer (132·6 kg/ha/day) and winter-early spring (1·9 kg/ha/day), respectively (Table 2). From winter-early spring to late spring average HAR increased from 1·9 to 111·8 kg/ha/day. During summer, the lowest values of HAR were recorded on swards managed at 100 mm, whereas in autumn the lowest values were recorded on those managed at 400 mm. During winter-early spring HAR was lower on swards managed at 300 and 400 mm than at 100 and 200 mm, with the inverse happening in late spring, when HAR of swards managed at 300 and 400 mm were higher than those managed at 100 and 200 mm, respectively (P < 0·05).
Table 2. Rates of herbage accumulation (±s.e.m.) on marandu palisade grass subjected to intensities of continuous stocking management from January to December 2002

* Summer (Dec–Mar), Autumn (Apr–Jun), Winter-early spring (Jul–Oct), and Late spring (Nov–Dec).
SR and number of grazing days
SR varied with SSH (P < 0·001), season of the year (P < 0·001) and SSH × season of the year interaction (P < 0·001). With the exception of winter-early spring, recorded values decreased with increasing SSH and were largest in summer, followed by those in late spring, autumn and winter-early spring (Table 3).
Table 3. SR* of marandu palisade grass (±s.e.m.) subjected to intensities of continuous stocking management from January–December 2002

* Calculated as animal units (1 AU = 1 adult animal weighing 450 kg).
† Summer (Dec–Mar), Autumn (Apr–Jun), Winter-early spring (Jul–Oct), and Late spring (Nov–Dec).
Similarly, the number of grazing day (GD) varied with SSH (P < 0·001), season of the year (P < 0·0001) and the SSH × season of the year interaction (P < 0·001) (Table 4). The number of GD decreased with increasing SSH and was largest in summer, followed by those in late spring, autumn and winter-early spring. Overall, the number of GD corresponded to 0·13–0·45 of the experimental period (391 days) for swards managed at 400 and 100 mm, respectively.
Table 4. Number of GD on marandu palisade grass (±s.e.m.) subjected to intensities of continuous stocking from December 2001 to December 2002*

* 391 days of experiment.
† Summer (Dec 2001–Mar 2002), Autumn (Apr–Jun 2002), Winter-early spring (Jul–Oct 2002), and Late spring (Nov–Dec 2002).
Morphological composition of hand plucked herbage samples
Morphological composition of herbage samples harvested using the hand plucking procedure was not affected by either SSH or SSH × season of the year interaction, varying only with season of the year (P < 0·001) (Table 5).
Table 5. Morphological composition of hand plucked herbage samples (±s.e.m.) on continuously stocked marandu palisade grass from January to December 2002
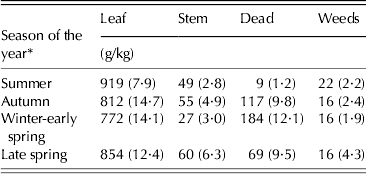
* Summer (Dec–Mar), Autumn (Apr–Jun), Winter-early spring (Jul–Oct) and Late spring (Nov–Dec).
Nutritive value
There was a clear contrast for all studied variables between swards managed at 100 and 400 mm. CP content and IVOMD decreased as SSH increased from 100 to 400 mm, the reverse happening with NDF and ADF (P < 0·05) (Table 6).
Table 6. CP, IVOMD, NDF and ADF of hand plucked herbage samples (±s.e.m.) on marandu palisade grass subjected to intensities of continuous stocking management from January–December, 2002

* Ash-free calculated values.
BWG
Daily weight gain varied with SSH (P = 0·003), with lower values recorded on swards managed at 100 and 200 mm (0·190 and 0·510 kg/animal/day, respectively) than on those managed at 400 mm (0·930 kg/animal/day). Swards managed at 300 mm (0·750 kg/animal/day) did not differ from those managed at 200 and 400 mm. Overall, swards managed at higher SSH resulted in greater daily BWG, but lower SR (Table 3), with highest gain/ha recorded at 300 and 400 mm (263, 514, 569 and 571 kg/ha of BWG for swards managed at 100, 200, 300 and 400 mm, respectively).
Grazing behaviour and HI
BM
BM was influenced only by SSH (P < 0·001). There was no effect of month of the year nor SSH × month of the year interaction. The lowest and highest values were recorded on swards managed at 100 and 400 mm, respectively, with intermediate values on swards managed at 200 and 300 mm (0·5, 0·8, 1·2 and 1·5 ± 0·10 g/bite for 100, 200, 300 and 400 mm, respectively).
BR
BR was influenced by SSH (P < 0·001), month of the year (P < 0·001) and SSH × month of the year interaction (P < 0·001) (Table 7). Overall, BR values increased as SSH decreased from 400 to 100 mm, with a minimum of 16·4 bites/min on swards managed at 400 mm in February and a maximum of 55·2 bites/min on swards managed at 100 mm in May.
Table 7. BR (±s.e.m.) on marandu palisade grass subjected to intensities of continuous stocking from January–December 2002

Grazing time (GT)
GT was influenced by SSH (P < 0·001) and month of the year (P = 0·002). The largest values were recorded on swards managed at 100 mm, with no difference between swards managed at 200, 300 and 400 mm (684, 642, 636 and 630 ± 14 min on swards managed at 100, 200, 300 and 400 mm, respectively). Throughout the year, GT was largest in June and lowest in January, February and August, with intermediate values recorded in May and December (636, 606, 630, 726, 618 and 672 ± 18 min for January, February, May, June, August and December, respectively).
HI
Daily HI varied with SSH (P < 0·001) and month of the year (P < 0·001), with no significant effect seen for the SSH × month of the year interaction. HI was lowest on swards managed at 100 cm, with no difference between those managed at 200, 300 and 400 mm (1·31, 1·78, 1·84 and 1·96 kg/100 kg of BW for swards managed at 100, 200, 300 and 400 mm, respectively). Overall, intake values were larger in December relative to January 2002 (1·90 and 1·56 kg/100 kg BW, respectively).
DISCUSSION
Animal production from pastures is not uniform throughout the year as a consequence of the variation in environmental factors such as rainfall, solar radiation and temperature. In general, herbage accumulation in the tropics is larger during warm and wet months (October–March) and comprises 0·8–0·9 of the annual accumulation, with the remaining 0·1–0·2 occurring from April to September (Pedreira & Mattos Reference Pedreira and Mattos1981). In the current study, climatic conditions were close to an average year considering historical data from 1917 to 2002 and rates of herbage accumulation changed according to season of the year and within seasons of the year as a function of SSH. During summer and late spring, when environmental conditions were favourable, rates of herbage accumulation were high, particularly on swards managed at 300 and 400 mm. In this period, light availability was probably the main limiting factor within the sward canopy, and herbage accumulation followed the classical pattern of response described for perennial ryegrass (Bircham & Hodgson Reference Bircham and Hodgson1983) and Cynodon (Pinto et al. Reference Pinto, Da Silva, Sbrissia, Carvalho, Carnevalli, Fagundes and Pedreira2001), with similar herbage accumulation on swards managed at 200, 300 and 400 mm. However, during autumn and winter-early spring, times of the year when temperature and rainfall were lower and there was soil water deficit, herbage accumulation decreased as SSH increased from 100 to 400 mm. Taller swards are more likely to be susceptible to water stress, since their evapotranspiration is larger. In addition, leaves in poorly managed swards are generally older and less photosynthetically active (Parsons et al. Reference Parsons, Johnson and Harvey1988) and, therefore, unlikely to contribute substantially to plant growth (Gifford & Marshall Reference Gifford and Marshall1973; Woledge Reference Woledge1977). Variations in herbage accumulation resulted in variations in SR and number of GD, simply reflecting the way monitoring and control of grazing was carried out during the experiment (e.g. maintenance of SSH targets). Overall, the number of GD during the experiment was low, with animals remaining on paddocks only 0·13–0·45 of the entire experimental period as a consequence of the small size of paddocks (1200 m2) relative to the size of animals (c. 300 kg) used in the experiment and the strong, typical seasonality of herbage production.
SR depends not only on the productivity of forage species and the amount of herbage on offer but also on the efficiency with which the produced herbage is harvested by the grazing animal. In the current study, SR and the number of GD showed the same pattern of variation described for herbage accumulation. In general, high values of SR and GD were recorded in summer, followed by those in late spring, autumn and winter-early spring, with values increasing as SSH decreased from 400 to 100 mm. The number of GD is a SR-related variable, and may be considered low because it corresponded to a low proportion of the total experimental period (0·13 (51 days) to 0·45 (178 days) for the 400 and 100 mm, respectively). Carnevalli et al. (Reference Carnevalli, Da Silva, Carvalho, Sbrissia, Fagundes, Pinto and Pedreira2001a, Reference Carnevalli, Da Silva, Fagundes, Sbrissia, Carvalho, Pinto and Pedreirab), in an analogous grazing experiment with Cynodon cultivars and grazing sheep, also reported a number of GD smaller than the experimental period (0·83 and 0·89 for coastcross and tifton 85, respectively), but with numbers significantly larger than those recorded in the current study. This may be associated with the smaller size of animals used by Carnevalli et al. (Reference Carnevalli, Da Silva, Carvalho, Sbrissia, Fagundes, Pinto and Pedreira2001a, Reference Carnevalli, Da Silva, Fagundes, Sbrissia, Carvalho, Pinto and Pedreirab) (sheep and not cattle) and the small paddock size used in the current experiment, but it is certainly a consequence of the need to vary the SR to maintain SSH targets. Although it may result in periods of time with no animals on the paddocks, sward conditions mimic a truly continuous stocking management, since even under continuous stocking individual leaves and tillers are defoliated intermittently (Lemaire et al. Reference Lemaire, Da Silva, Agnusdei, Wade and Hodgson2009).
The chemical composition of the hand-plucked herbage indicated a reduction in nutritive value as SSH increased, since CP and IVOMD decreased and NDF and ADF increased. However, the differences were not large relative to the recorded differences in daily weight gain, indicating that nutritive value was relatively less important than HI in determining animal performance (Stobbs Reference Stobbs1973; Hodgson Reference Hodgson1990; Carvalho et al. Reference Carvalho, Ribeiro Filho, Poli, Moraes, Delagarde, Mattos, De Faria, Da Silva, Nussio and Moura2001; Benvenutti et al. Reference Benvenutti, Gordon and Poppi2006; Euclides et al. Reference Euclides, Macedo, Valle, Difante, Barbosa and Cacere2009). Differences in CP and IVOMD corresponded to –17·5% (137–113 g/kg) and –7·0% (671–624 g/kg) between swards managed at 100 and 400 mm, while differences in HI and BWG corresponded to around +50% (1·31–1·96 kg/100 kg BW) and +340% (0·190–0·930 kg/animal/day), respectively. Hodgson (Reference Hodgson1990) pointed out that on efficiently grazed continuously stocked swards, animals are consistently eating young leaf material and, as a result, digestibility and CP of the consumed herbage should remain high. However, on swards maintained at a low height the turnover of leaves and tillers is higher than on swards maintained at taller heights (Hernandez-Garay et al. Reference Hernandez-Garay, Matthew and Hodgson2000; Sbrissia et al. Reference Sbrissia, Da Silva, Sarmento, Molan, Andrade, Gonçalves and Lupinacci2010), a condition that would result in low herbage mass comprised of younger leaves and tissues, explaining the results for CP, IVOMD, NDF and ADF in the current study. Similar results were presented by Flores et al. (Reference Flores, Euclides, Abrão, Galbeiro, Difante and Barbosa2008) for continuously stocked B. brizantha cvar Marandu and Xaraés maintained at 150, 250 and 400 mm using a similar grazing protocol.
In spite of the higher nutritive value, HI in the current study was lower on swards managed at 100 mm, mainly because of the reduced BM under those conditions (0·5 and 1·5 g/bite on swards managed at 100 and 400 mm, respectively). Reduction in BM is a direct response of limiting sward conditions to consumption of herbage (Hodgson Reference Hodgson1990; Hodgson et al. Reference Hodgson, Clark, Mitchell and Fahey1994). In fact, in a concomitant set of experiments in the same experimental area in which the aim was to evaluate the vertical distribution of morphological components in sward herbage mass and the patterns of defoliation of individual leaves and tillers, it was demonstrated that the top 0·50 of sward canopy comprised mainly leaf lamina, regardless of management height, and that defoliation severity corresponded to 0·67 of the leaf lamina length for all leaf categories, regardless of defoliation frequency. The results indicated that animals were exploiting only the top third of the sward, a condition that would correspond to potential grazing strata of 33, 67, 100 and 133 mm for swards maintained at 100, 200, 300 and 400 mm, respectively (Da Silva & Nascimento Reference Da Silva and Nascimento2007). According to Hodgson et al. (Reference Hodgson, Clark, Mitchell and Fahey1994), grazing horizons shorter than 100 mm correspond to a serious restriction of bite formation, resulting in a significant reduction of BM despite the high proportion of leaf in the herbage consumed. Animals did increase their BR (46·3 and 17·5 bites/min on swards managed at 100 and 400 mm, respectively) in order to compensate for the smaller BM and, for the 100 mm swards, they also increased GT (684 and 630 min on swards managed at 100 and 400 mm, respectively). However, HI remained lower, probably because intake per bite normally has a larger influence on daily HI than BR (Hodgson Reference Hodgson, Okubo and Shiyomi1985; Spalinger & Hobbs Reference Spalinger and Hobbs1992; Parsons et al. Reference Parsons, Thornley, Newman and Penning1994; Cosgrove Reference Cosgrove and Gomide1997; Illius Reference Illius, Buchanan-Smith, Bailey and McCaughey1997; Baumont et al. Reference Baumont, Cohen-Salmon, Prache and Sauvant2004). Larger values of daily intake and BM were associated with lower BR and GT, indicating a similar pattern of response to what has already been described for temperate grass forage species (Gordon Reference Gordon, Hodgson, Lemaire, Moraes, Carvalho and Nabinger2000; Laca & Lemaire Reference Laca, Lemaire, Mannetje and Jones2000; Wade & Carvalho Reference Wade, Carvalho, Lemaire, Hodgson, de Moraes, Carvalho and Nabinger2000). Similar results have been reported by Difante et al. (Reference Difante, Euclides, Nascimento, Da Silva, Barbosa and Torres2010) for Tanzania guinea grass (Panicum maximum Jacq. cvar Tanzania), highlighting consistency and indicating that there are more similarities than differences between tropical and temperate forage grass species. The higher weight gain per animal on swards managed at 300 and 400 mm was associated with lower SR, and a larger weight gain/ha was recorded on swards managed at 300 and 400 mm (569 and 571 kg/ha, respectively).
CONCLUSIONS
On marandu palisade grass, plant and animal responses are determined by SSH and influenced by season of the year. During the pasture growing season (late spring and summer), rates of herbage accumulation are relatively stable on swards maintained at 200–40 mm, with little difference in nutritive value. Within that range of sward conditions, differences in animal performance are basically a consequence of differences in HI, since larger weight gains were recorded on tall swards, associated with large BM and intake rate. The results indicate large flexibility of grazing management of this forage grass species under continuous stocking and highlight the importance of providing adequate grazing conditions to allow efficient grazing. Sward height is an easy and efficient way of implementing and monitoring such management practices, and could be used as management guide in field conditions.


