Protected areas help to decrease human impacts on habitat (Geldmann et al., Reference Geldmann, Barnes, Coad, Craigie, Hockings and Burgess2013), one of the major causes of mammalian extinction (Ceballos & Ehrlich, Reference Ceballos and Ehrlich2002). Nevertheless, they do not always protect species’ core habitats, often because the needs of threatened mammals are not easily met (e.g. species with large home ranges, or migratory habits; Berger, Reference Berger2003), or because of planning and logistical shortcomings (e.g. scarcity of public land; Knight et al., Reference Knight, Grantham, Smith, McGregor, Possingham and Cowling2011). Protecting core habitats is difficult when resources are scarce and in high demand by both humans and focal species (e.g. in arid regions humid areas are important for both native species and agricultural activities; Fritz et al., Reference Fritz, Saïd, Renaud, Mutake, Coid and Monicat2003). Coexistence between large mammals and humans can induce the former to move to areas where conflict may be high (Nyhus & Tilson, Reference Nyhus and Tilson2004) or cause them to be displaced to suboptimal locations (Verlinden, Reference Verlinden1997).
Here we focus on the taruka Hippocamelus antisensis, categorized as Vulnerable on the IUCN Red List (Barrio et al., Reference Barrio, Nuñez, Pacheco, Regidor and Fuentes-Allende2017), specifically the Chilean populations bordering the Atacama Desert. In this region the taruka is restricted to humid ravines (Barrio, Reference Barrio2013), which are exploited for agriculture (Fuentes-Allende et al., Reference Fuentes-Allende, Vielma, Paulsen, Arredondo, Corti, Estades and González2016). The southern extension of this population has contracted by 500 km northward since the arrival of Europeans in South America (Castro et al., Reference Castro, Aldunate and Varela2004) and is now at a low density (Sielfeld & Guzman, Reference Sielfeld and Guzman2011). This population is categorized as Critically Endangered (Cofré & Marquet, Reference Cofré and Marquet1999) as a result of conservation threats mainly associated with interactions with local communities (Barrio, Reference Barrio2013). Although there are six protected areas within the taruka's range (Sielfeld & Guzman, Reference Sielfeld and Guzman2011), it is not known whether these include ideal habitat for the species. We therefore identify core habitat types for the taruka and assess the contribution of protected areas in safeguarding these.
The study included 17,036 km2 of Andean foothills (2,500–4,000 m altitude) in the Arica-Parinacota and Tarapacá districts in Chile (Fig. 1), 6,436 km2 of which are included in the Chilean Protected Areas System (SNASPE, 2016; Supplementary Table 1). The area is dominated by canyons in which vegetation comprises mainly low scrub, with mean monthly temperatures of 0–18 °C and annual precipitation of 50–200 mm that mostly falls during December–March.

Fig. 1 Habitat suitability map for taruka Hippocamelus antisensis within the study area, with taruka occurrence and protected areas, including the proposed protected area (Supplementary Table 1).
We developed a species distribution model, using MaxEnt v. 3.3.3.k (Phillips et al., Reference Phillips, Anderson and Schapire2006), to identify taruka habitat from sightings, absence records, and environmental variables, at a resolution of 1 km2. From a total of 155 sightings obtained from the literature (Sielfeld & Guzman, Reference Sielfeld and Guzman2011; Fuentes-Allende et al., Reference Fuentes-Allende, Vielma, Paulsen, Arredondo, Corti, Estades and González2016) and from an extensive study (BAG and NFA, unpubl. data) during 2004–2015, we selected 76 sightings (one per 1 km2 grid cell, to reduce spatial autocorrelation and avoid pseudo-replication; Wellenreuther et al., Reference Wellenreuther, Larson and Svensson2012). Absence records (115 locations, one per 1 km2 cell) were collected during the 2014 survey (Fuentes-Allende et al., Reference Fuentes-Allende, Vielma, Paulsen, Arredondo, Corti, Estades and González2016; Supplementary Material 1, Supplementary Fig. 1).
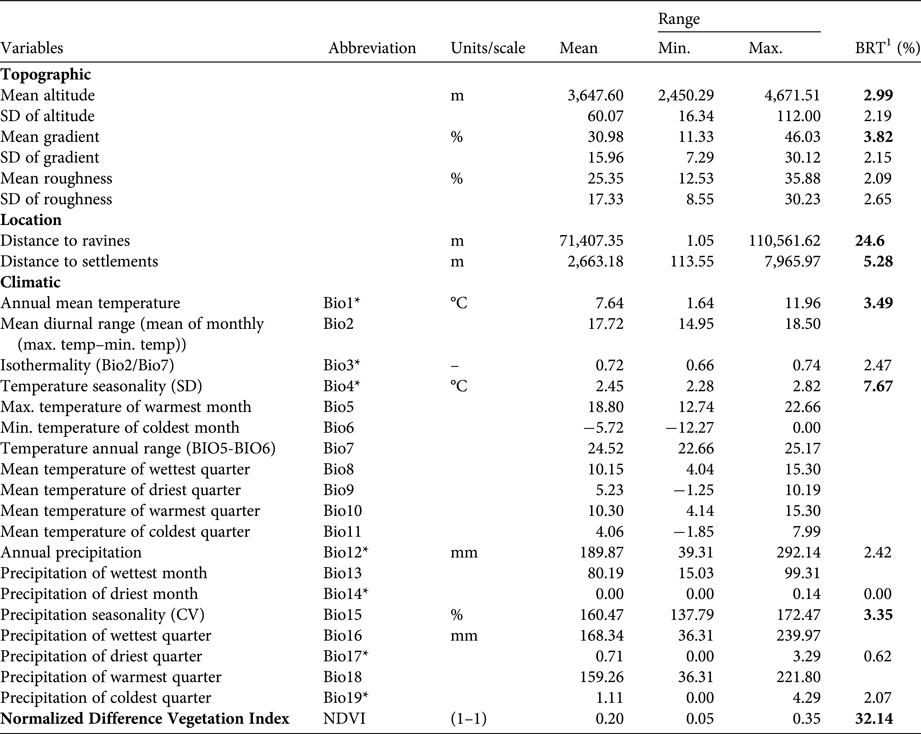
We initially chose 28 variables: topography (6 variables), climate (19 variables), normalized difference vegetation index (NDVI), and distance from each record to nearest ravine and nearest human settlement. Climatic variables with high auto-correlation were discarded (R > 0.7; Elith et al., Reference Elith, Graham, Anderson, Dudı´k, Ferrier and Guisan2006). Variables were then selected using boosted regression trees (Elith et al., Reference Elith, Leathwick and Hastie2008). Our final model was constructed via 4-fold cross-validation. Eight variables were selected that best described the core habitat (Table 1; Supplementary Material 1).
Table 1 Environmental variables considered potential predictors of the distribution of the taruka Hippocamelus antisensis.

*The climatic variables selected after excluding those with a correlation (R) > 0.7
1The relative contribution (%) of the predictor variables for a Boosted Regression Tree model (BRT) that determine taruka presence in northern Chile (Arica-Parinacota and Tarapacá districts; Fig. 1). Variables selected for constructing the distribution model are in bold.
The importance of each environmental variable in explaining taruka presence was assessed using Jackknife analysis and response curves of presence (Phillips, Reference Phillips2017). Model consistency was measured using the Area Under the Curve (AUC) index (Liu et al., Reference Liu, Berry, Dawson and Pearson2005). We used logistic output format (Phillips & Dudik, Reference Phillips and Dudik2008) to facilitate the interpretation of results, and determined areas where the species could occur using as cut-off thresholds the maximum value of the sensitivity–specificity sum (MaxSS; Jiménez-Valverde & Lobo, Reference Jiménez-Valverde and Lobo2007) and the average value of all pixels included in the prediction (Averprob; Liu et al., Reference Liu, Berry, Dawson and Pearson2005). Spatial overlap between potential distribution and location of protected areas was assessed using ArcGIS 10.1 (ESRI, Redlands, USA).
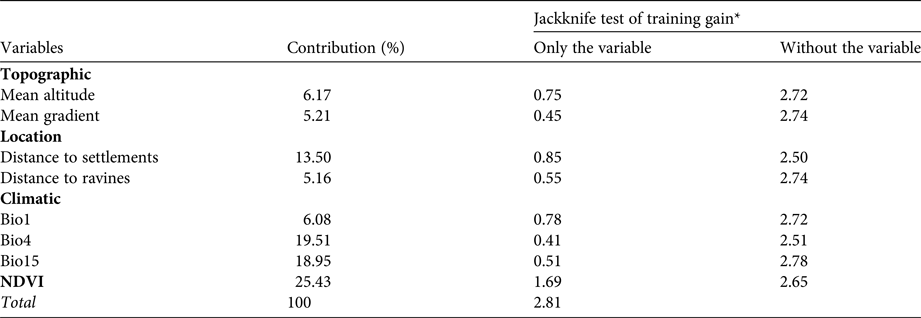
The mean of the four models generated via cross-validation had good overall fit (AUCmean = 0.978 ± SD 0.003). The relative importance of the selected variables’ for predicted occurrence of the taruka were consistent for Jackknife and BRT analyses, confirming the robustness of our results (Tables 1 & 2). The model indicates that taruka core habitat is more abundant in Arica-Parinacota than in Tarapacá district (Supplementary Fig. 2). NDVI, distance to settlements, temperature, and seasonality of precipitation affected presence, but NDVI and distance to settlements had the greatest influence (Table 2; Supplementary Fig. 3a & d). High NDVI values (> 0.3), short distances to settlements, low thermal variation (Supplementary Fig. 3b) and high annual variation in precipitation (Supplementary Fig. 3c) increased the probability of taruka presence.
Table 2 Percentage contribution and relative predictive power of environmental variables in the MaxEnt habitat suitability model for taruka according to the MaxEnt Jackknife test. Training gains were calculated for a single variable if used solely for the modelling procedure and additionally for the model with the remaining variables after dropping the focus variable.

*Values are means of four Jackknife replicates of regularized training gain.
Food availability, inferred by NDVI (Pettorelli et al., Reference Pettorelli, Vik, Mysterud, Gaillard, Tucker and Stenseth2005) and climatic variables, accounted for almost 60% of the probability of presence, reaching its maximum in areas with favourable conditions for plant growth (e.g. no pronounced thermal variation or highly variable precipitation; O'Donnell & Ignizio, Reference O'Donnell and Ignizio2012), as suggested by other authors (Barrio, Reference Barrio2013; Fuentes-Allende et al., Reference Fuentes-Allende, Vielma, Paulsen, Arredondo, Corti, Estades and González2016). The physiology of the taruka limits the species to feeding on high quality vegetation (Müller et al., Reference Müller, Codron, Meloro, Munn, Schwarm, Hummel and Clauss2013; Gazzolo & Barrio, Reference Gazzolo and Barrio2016), and thus it has a preference for the scarce productive areas confined to ravines. The influence of distance to settlements probably arises because in this region they are mainly confined to humid areas with high quality vegetation (Goykovic, Reference Goykovic2012). Human settlements are scarce in the study area (one settlement per 48.2 km2), but they are concentrated within the habitats favourable for taruka according to the Maxent model (one settlement per 11.7 km2 in areas embraced by the MaxSS threshold), a coincidence that increases the likelihood of negative interactions with people. Damage to crops by taruka is common in Chile (Barrio, Reference Barrio2013).
The extent of the potential distribution of tarukas varied between the two cut-off thresholds (Supplementary Fig. 2). The MaxSS cut-off was 0.105, restricting the core distribution to 3,527.9 km2 at altitudes of 2,500–4,500 m (394.9 km2 within protected areas), and the Averprob cut-off was 0.562, restricting the core distribution to 304.1 km2 at 3,000–3,500 m (23.5 km2 within protected areas). Overall, the models suggest that taruka habitat is concentrated in the northern part of our study area over 2,500–4,000 m, with increasing fragmentation to the south.
Thus, there is a mismatch between taruka core habitat and protected areas, as for other deer species in Chile (e.g. 3–8% for pudú Pudu puda, Pavez-Fox & Estay, Reference Pavez-Fox and Estay2016; 30% for huemul Hippocamelus bisulcus; Quevedo et al., Reference Quevedo, von Hardenberg, Pastore, Álvarez and Corti2016). Much of the taruka's potential distribution lies in the pre-puna region, in which protected areas are scarce (Pliscoff & Fuentes-Castillo, Reference Pliscoff and Fuentes-Castillo2011) and negative farmer–taruka interactions are common. The most suitable location for establishing a new conservation unit for taruka is in the south of the Arica-Parinacota district (Fig. 1) because this area offers a large expanse for protecting the pre-puna biodiversity (Rundel & Palma, Reference Rundel and Palma2000), there are no settled communities there, and protection of this area could help to prevent isolation of southern taruka populations. In the north and in areas where conflict occurs, other conservation approaches need to be considered, such as educational programmes to increase awareness about this deer species (Rechberger et al., Reference Rechberger, Pacheco, Nuñez, Roldán, Martínez and Mendieta2014), and fencing of crops (VerCauteren et al., Reference VerCauteren, Lavelle and Hygnstrom2006) while still ensuring taruka have access to natural grasslands and watercourses (Hayward & Kerley, Reference Hayward and Kerley2009), and consulting local communities prior to taking management decisions (Rechberger et al., Reference Rechberger, Pacheco, Nuñez, Roldán, Martínez and Mendieta2014).
Acknowledgements
The Terrestrial Ecology Group of the Departamento de Ecología, Universidad Autónoma de Madrid is funded by the Comunidad de Madrid and the European Social Fund via the REMEDINAL-3 (S-2013/MAE-2719) research network. We thank Esteban Zúñiga and Jorge Valenzuela from the Chilean National Forestry Corporation (CONAF), and NFA acknowledges a postgraduate scholarship from the Comisión Nacional de Investigación Científica y Tecnológica, Chile. This research forms part of the surveys that the NGO Tarukari carries out in the highland desert of Northern Chile. Comments from C. Shuert, L. Pacheco and an anonymous reviewer improved the text.
Author contributions
NFA, BAG, AV and JEM: conceived and designed the study and performed the fieldwork. CM analysed the data and CM, NFA and JEM wrote the paper.
Biographical sketches
Cristina Mata is an ecologist interested in landscape connectivity for animals, habitat modelling and network analysis. Nicolás Fuentes-Allende is a field ecologist interested in ecology and management of ungulates. Juan E. Malo is an ecologist focused on ecological interactions and the effects of human activities on wildlife populations. André Vielma is interested in applied conservation and human–wildlife interactions, and Benito A. González is a researcher interested in ecology, evolution, management and conservation of Andean and Patagonian ungulates.


