Introduction
The use of ice cores as climatic and environmental archives is increasing. They used to be only considered valuable when recovered from the dry-firn areas in the heart of Antarctica and Greenland, but more careful site selection and improved analysis techniques have now started to establish reliable ice-core records within the percolation zone in the Arctic and at high-elevation snowfields at lower latitudes (e.g.Reference KoernerKoerner,1997).
One of the most important tasks in ice-core analysis is to establish the chronology of the core. the dating techniques generally used in ice-core analysis include: (a) flow models, (b) counting cycles of seasonally varying parameters in the core, (c) using reference horizons, and (d) using unstable isotopes with known radioactive decay (Reference PatersonPaterson,1994).Most of these methods have their pros and cons, and it is unusual to obtain a good ice-core chronology relying on only one of them. the best results come from combining as many parameters from the ice core as possible (Reference Hammer, Clausen, Dansgaard, Gundestrup, Johnsen and ReehHammer and others, 1978; Reference MeeseMeese and others, 1997; Reference EichlerEichler and others, 2000).
The most used annual marker in ice cores is the seasonal variation of stable isotopes in water (δ18O and δD), and in particular δ18O. Despite the development in understanding of the insoluble-dust and ion-chemistry deposition records (Reference KoernerKoerner, 1977; Reference Hammer, Clausen, Dansgaard, Gundestrup, Johnsen and ReehHammer and others, 1978; Reference Legrand and MayewskiLegrand and Mayewski, 1997), δ18O and δD are still the most common tools for finding the depth/time relation in ice cores. Although excellent conditions for preservation of annual cycles of δ18O and δD exist in areas such as central Greenland, the isotopes sometimes fail to record an exact chronology due to missing annual layers in the record, or because intra-seasonal variations create spurious cycles (e.g. Reference Bolzan and StrobelBolzan and Strobel, 1994; Reference Shuman, Alley, Anandakrishnan, White, Grootes and StearnsShuman and others, 1995). the reasons behind this are to be found in both pre- and post-depositional processes (Reference JouzelJouzel and others, 1997; Reference Pohjola, Sepúlveda, Casassa and SinclairPohjola, 2002).
Here we use the upper 81m of the δ18O and δD record from a 122 mlong ice core from the icefield Lomonosovfonna, central Spitsbergen, Svalbard, to determine a more precise chronology of the core than is available through reference horizons and flow modelling. We also reconstruct the annual accumulation rates for the icefield.
The Ice-Core Record and Ice-Core Site
The 122m deep ice core was drilled in May 1997 and penetrated to within about 5 m of the bed. the ice-core site, drilling procedure, analytical techniques, climate at the drill site and the background to the project are described in Reference IsakssonIsaksson and others (2001). the drill site was at the summit of the 600 km2 Lomonosovfonna icefield (1250m a.s.l.; Fig. 1), with an average annual temperature of about –12˚C. Latent heat from percolating meltwater has raised the temperature of the ice column to about –2.5˚C (Reference Van de WalVan de Wal and others, 2002). from stratigraphic studies it was estimated that about 25 %of the snowpack melts in a median year, with an increase to about 33% melt during the last century (Reference PohjolaPohjola and others, 2002). Despite melting of the snowpack and infiltrating meltwater, there were no signs of reorganization of the δ18O and δD in the ice strata due to percolation. Reference PohjolaPohjola and others (2002) show that only slight depletion of δ18O and δD was found in infiltrated ice facies compared with firn layers and bubbly ice facies.
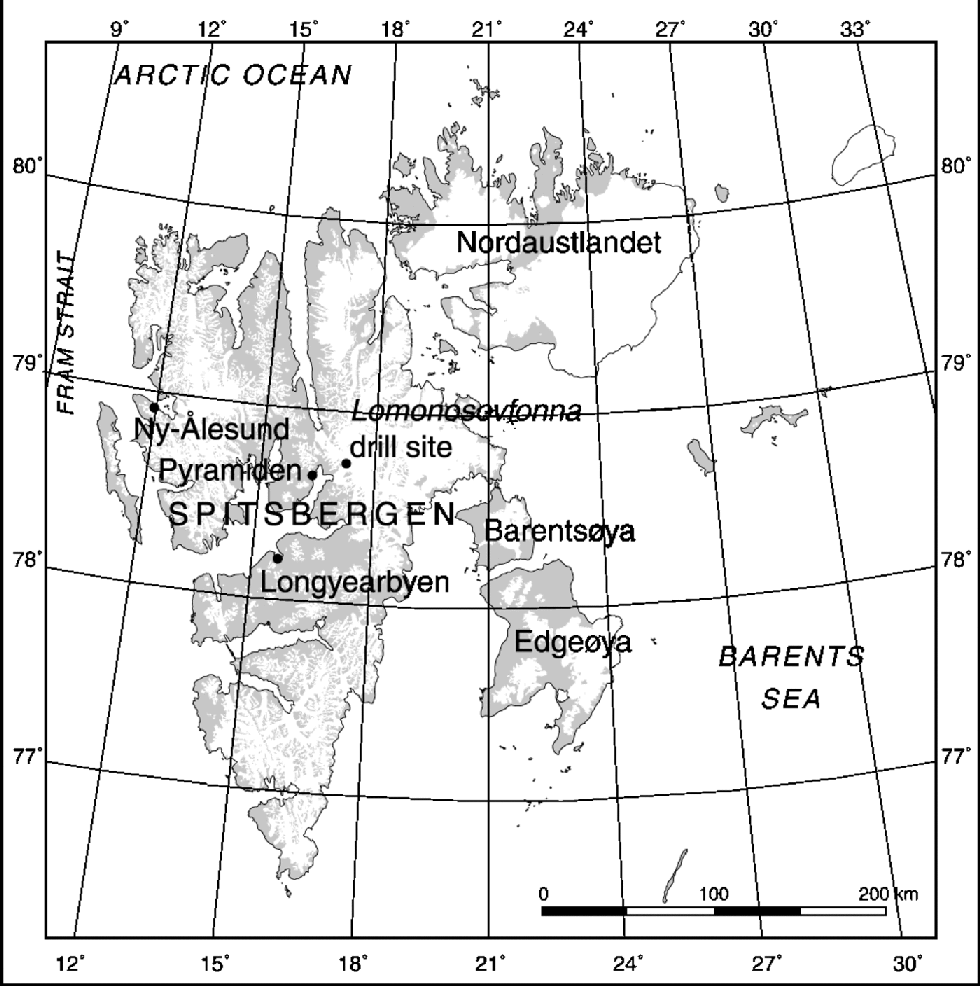
Fig. 1 Map over Svalbard showing Ny Ålesund, Longyearbyen and the ice-core site Lomonosovfonna on the island of Spitsbergen. the white terrestrial area is ice-covered terrain.
The ice-core data used here are the δ18O and δD record from the upper two-thirds of the core. δ18O is available in a continuous array of 0.05 m samples from 0–81m depth, and δD in two shorter continuous arrays (5.0–10.1 and 17.4–36.1m depth) and a series of discontinuous samples (also in 0.05 m intervals) (Fig. 2). the analytical uncertainty (ε) of δ18O is ±0.1‰, and of δD±1.5‰ .The upper part of the ice core was analyzed for radioactive isotopes (Reference PinglotPinglot and others, 1999), and at 18.5–18.95m (12.95–13.34mw.e.) the 1963 bomb horizon was found. the sulphate record was investigated for volcanic horizons, and only one event stood out: the Laki (Iceland) eruption of 1783 at 66.8 m (54.82–54.87mw.e.) (Reference Kekonen, Moore, Mulvaney, Isaksson, Pohjola and van deWalKekonen and others, 2002).
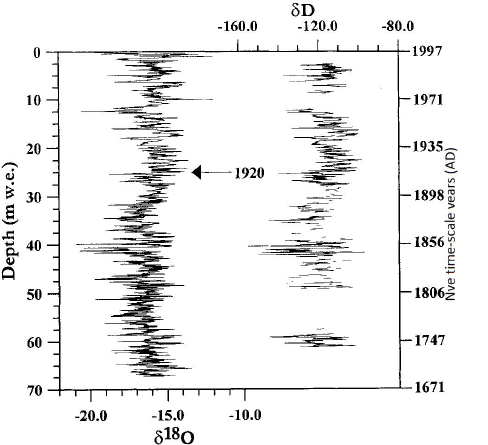
Fig. 2 The ice-core record of δ 18O(oxygen isotope ratio) (left) and δD(hydrogen isotope ratio) (right) at 0–81m core depth.
The potential of δ18O and δD as annual time markers at the drill site
One prerequisite for using stable isotopes (δ18O and δD) in water as annual time markers is that the isotopic record shows a distinct annual cycle. the isotopic record reflects various processes: the regional temperature variation, regional hydrological cycle and atmospheric circulation dynamics, as well as ocean surface temperature and its relation to ocean circulation dynamics (for further details see Reference JouzelJouzel and others, 1997; Reference Hoffmann, Werner and HeimannHoffmann and others, 1998). In other words, a rather complex dynamical environment influences δ18O and δD in the water vapour, which is later deposited as snow on the ice-field. the hydrological cycle and the atmospheric circulation over the Atlantic Ocean sector of the Arctic show a pronounced seasonal cycle. This is imprinted as detectable annual cycles of δ18O and δD in precipitation collected at the coastal station of Ny Ålesund, west-central Spitsbergen, situated about 100 km west of the ice-core site (Fig. 1). the location of Svalbard between mild maritime Atlantic air masses and colder Arctic air masses introduces intra-seasonal noise into the record. Diffusion of the isotopic signal will smooth out most of these short-period events, and the annual cycles will be most pronounced in the ice-core record (Reference JohnsenJohnsen, 1977; Reference Whillans and GrootesWhillans and Grootes, 1985). the smoothing effects of the three-point moving average in Figure 3 show a simplified illustration of the effects of diffusion on the Ny Ålesund record.
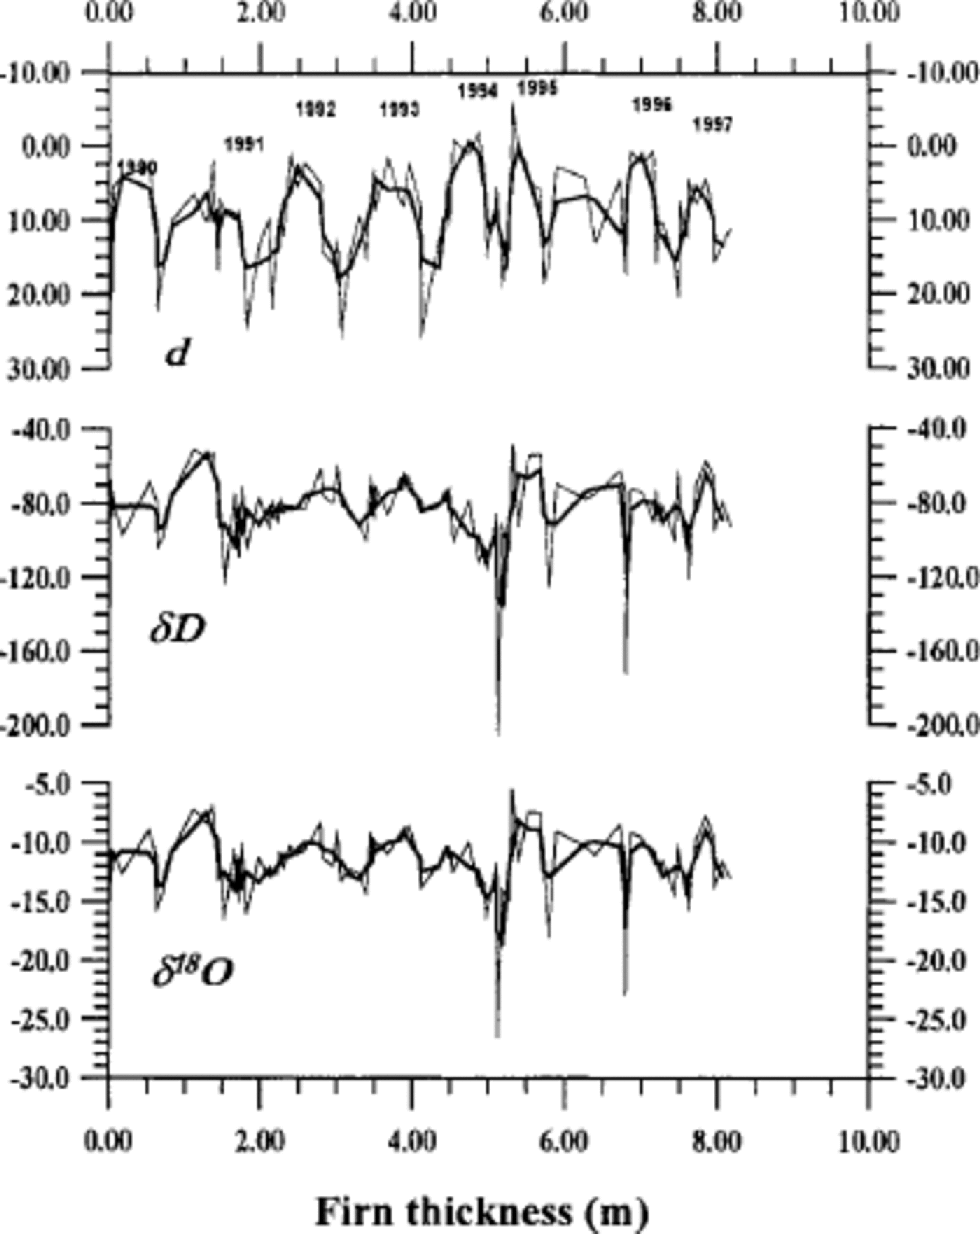
Fig. 3 The record of δ 18O, δD and deuterium excess (d) at Ny Ålesund, 1990–97. the thinner lines are the monthly record (http://www.iaea.org/programs/ri/grip/gripmain.htm), and the thicker lines are a three-point moving average. the monthly data are converted into metres of firn by adding each month’s precipitation to the time (depth) axis. the density of the firn is 400 kg m–3 throughout the pack. This forces dry and isotopically extreme periods to have a lower weighting in the depth/ time axis, similar to that recorded in an ice column. the annual label is positioned at June in each year in the horizontal axis. Note that the horizontal axis is not real depth, but can be viewed as thickness from a reference point in a firn pack starting January 1990.
The isotopic record from Ny Ålesund shows distinct annual cycles in most years. Only the 1995 and 1996 cycles show a less clear character, which might have been difficult to detect in a real snow/firn pack. Thus we find that δ18O and δD have an annual cycle in this region which we assume is also present over Lomonosovfonna. Therefore, we expect to find δ18O and δD annual cycles in the ice-core record, as long as post-depositional processes, such as vapour-driven diffusion, have not eliminated this signal.
Results
Calculation of isotope cycles
The model used to identify annual cycles in δ18O and δD is based on the simple criterion that each time ∂X/∂z (X = δ18O, δD; z is distance down-core) changes sign, a (seasonal) half-cycle is found, and the algorithm delivers the depth of the presumed seasonal extrema. In order to avoid cycles of smaller wavelengths than annual lengths, two criteria must be met: (1) amplitude of cycle >analytical uncertainty (ε), (2) half-wavelength of cycle > detection length (l ), where l is the search window, which is the minimum thickness of a seasonal layer. the algorithm can only find cycles having more than two points per cycle, obeying the Nyquist criterion (Reference Press, Teukolsky, Vetterling and FlanneryPress and others, 1992). the model is discussed further in Reference Pohjola, Sepúlveda, Casassa and SinclairPohjola and others (2002).
Since the ice column is affected by gravitational spreading, vertical strain will thin the older (deeper) layers. Reference NyeNye (1963) provided a simple function to correct for the vertical strain such that Lz = Ls(z/H), where L is the layer thickness, H is the ice thickness in mw.e., and subscripts s and z represent the values at the surface and at a height z (in mw.e.) above the bed. the length of the search window (l) was adjusted according to the Nye thinning model, giving a gradually decreasing l with depth. the relation between strain and depth presented by Reference NyeNye (1963) leads to the Nye time-scale, ![]() where t is time and a is accumulation rate (Reference Dansgaard and JohnsenDansgaard and Johnsen, 1969).
where t is time and a is accumulation rate (Reference Dansgaard and JohnsenDansgaard and Johnsen, 1969).
We first use the δ18O record to calculate the chronology, since the δD record is not available for the full depth interval. to control the model we use the two established reference horizons of AD 1783 and 1963. We also use an extra datum of AD1920 based on a more subjective feature fitting than the 1783 and 1963 horizons. In the temperature record from Longyearbyen (1911–97) (Reference Nordli, Hanssen-Bauer and J. FørlandNordli and others, 1996) there is a pronounced increase in air temperatures, with the midpoint at 1920. We assume this will be reflected in the isotopic data, and place this date in the middle of the pronounced increase of δ18O in the isotope record (Fig. 2). the other two reference horizons with the Nye time-scale also gave approximately this age to the isotope feature independently, but it is useful to have this reference layer as an additional check on our cycle counting.
Table 1 shows the results of counting annual cycles in the δ18O record using various values of ls. the best overall result is obtained using a value of 0.062mw.e. It is apparent that no single value of ls would give a perfect result with all datum horizons placed at their correct depths. the time/depth relationship was also investigated by Reference Kekonen, Moore, Mulvaney, Isaksson, Pohjola and van deWalKekonen and others (2002) using the Nye time-scale. They found that accumulation rates must have increased in the last part of the 20th century in order to explain the position of the Laki and 1963 bomb test markers. to give the datum horizons their correct depths, we use ls =0.10mw.e. in the 1963–97 interval, and ls =0.07 in the deeper parts of the core. the obvious explanation for the better match obtained by using a larger ls in the upper 18.5m is that accumulation rates were higher in this part of the core. Additionally, the younger ice has more high-frequency variability in the record than in the lower part of the core, as the older part of the record is smoothed by diffusion. This could lead to our search method detecting shorter than annual cycles if ls is too small. A larger ls gives fewer cycles per unit core.
Table 1. Comparison of depths to reference horizons based on cycle-counting with various values of the minimum thickness of the search layer ls
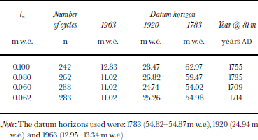
Figure 4 shows the calculated depth/age relation in mw.e., and compares the derived scale to time-scales calculated from the Nye time-scale.
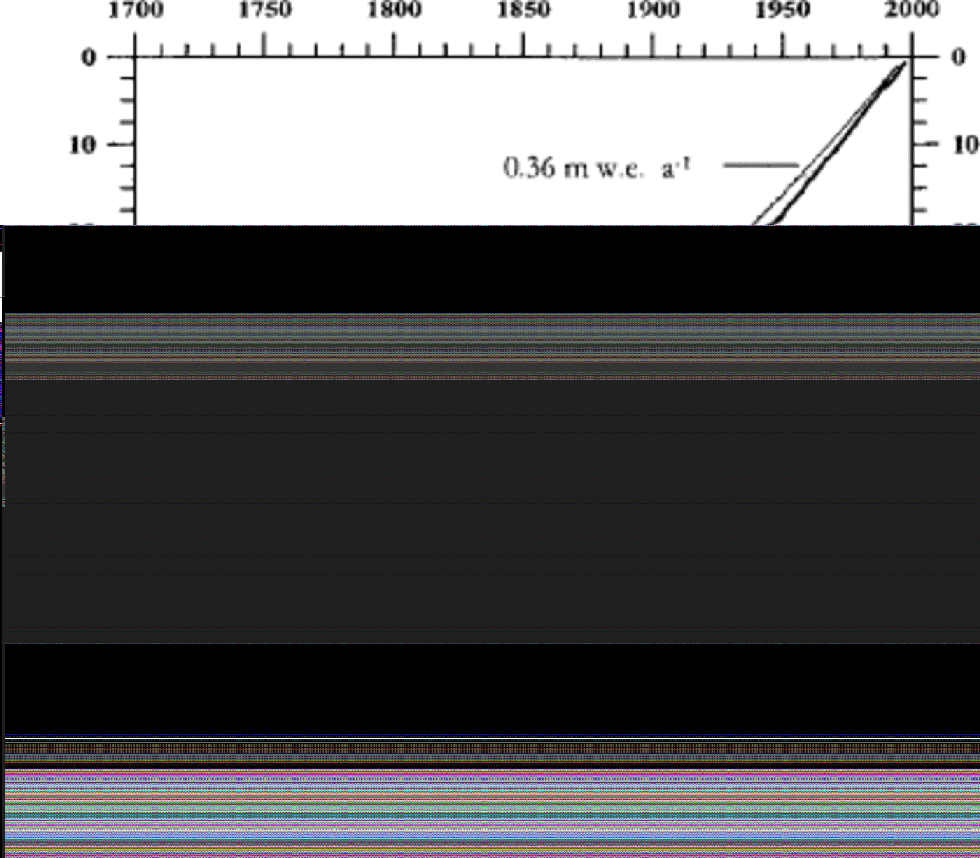
Fig. 4 The depth/age relation in m w.e. of the upper 81m of the Lomonosovfonna ice core, calculated by using annual cycles of δ18O (thick line). the thin curves show the depth/age relation based on the Nye model using an apparent accumulation rate of 0.36 m w.e. a–1(upper) and 0.41 m w.e. a–1(lower). the dashed curve shows the depth/age relation based on the Nye model using an accumulation rate of 0.42 m w.e. a–1(1996– 63) and 0.31m w. e. a–1(1963–1715).
It is generally recommended in ice-core studies that each annual cycle should contain at least eight samples. (e.g. Reference PatersonPaterson, 1994, p. 333). With increased thinning down the core, our sampling size of 5 cm samples will fail to meet that criterion at some depth. In Figure 5, we study the sampling density at two depth intervals centred around AD 1750 and 1850. We find that the upper interval barely meets this criterion, and that some years are thinner and contain fewer samples. the lower interval has even fewer samples per year. We do know the number of years between our dated horizons, and presume that each year will be shown as an isotopic cycle. By restricting our cycle counting to layers that simply satisfy the basic Nyquist sampling theorem (Reference Press, Teukolsky, Vetterling and FlanneryPress and others, 1992) we count cycles as years that contain fewer than the ideal 6–8 samples, but which contain sufficient points to define a cycle (i.e. three points). Below our last reference horizon (Laki) at 54.8mw.e. we introduce a higher uncertainty in the time-scale. Also as depth increases, the thickness of each cycle is less precisely determined, since the vertical extent of each cycle will be constrained by fewer samples.
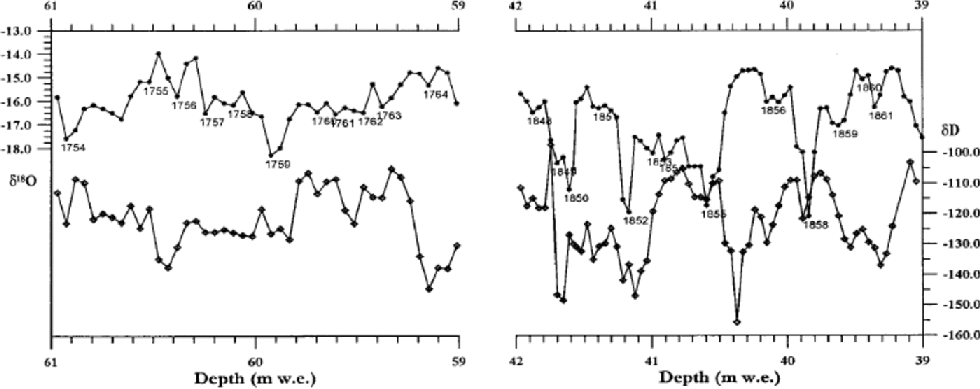
Fig. 5 The isotope cycles (upper curve δ 18O, lower curve δD) shown in two depth intervals centred on about AD1750 and 1850. the crosses mark the midpoint of each sample.
Validation of δ18O chronology by comparing δ18O and δD cycles
The ice-core chronology, or the depth/time relation, shown in Figure 4 is based on the position of the seasonal extrema in the δ18O record. Figure 3 shows that the δD record has annual cycles similar to the δ18O record. We can use this to test the results of our δ18O cycle counting, since within the same depth interval the δD and the δ18O record should show the same number of cycles. δD is only available in two long continuous intervals in the 0–81m part of the ice core, 5.02– 10.17 mw.e (interval A) and 12.11–27.72 mw.e (interval B). We find that we obtain similar numbers of cycles in the δD record and in the δ18O record, although the δD cycles are somewhat fewer (7–10% fewer δD cycles; Table 2).
Table 2. Comparison of number of cycles found in the δD and the δ18O record in the two different intervals where both were analyzed

The explanation for the differing results using δD and δ18O is probably the higher ratio of signal to analytic uncertainty (ε) in δ18O than in δD. In stating this we assume that δD and δ18O in the precipitated record are similar to each other (e.g. Fig. 3). Post-depositional diffusion of the signals cannot account for the fewer δD cycles, since the δ18O signal would decay faster than δD (Reference Johnsen, Clausen, Cuffey, Hoffmann, Schwander, Creyts and HondohJohnsen and others, 2000). However, this discrepancy in numbers of isotopic cycles can give an estimate of the uncertainty of the method (±10%).
We also tried to use the deuterium excess, d, defined as [δD – (8δ18O)], to count annual cycles. However, the results were poor, mainly because ε becomes a quite large number for d (2.3‰), which is about 50% of the average amplitude in d in the ice-core record. In order to use d cycles as annual markers, it seems the diffusion has to be calculated, and then the data must be back-diffused (Reference JohnsenJohnsen, 1977; Reference Bolzan and PohjolaBolzan and Pohjola,2000; Reference Johnsen, Clausen, Cuffey, Hoffmann, Schwander, Creyts and HondohJohnsen and others, 2000).
Calculation of accumulation rates at Lomonosovfonna summit back to AD 1715
As the ice-core chronology has been established, the accumulation rates over the icefield can be reconstructed. Figure 6 shows the thickness of the annual layers over the period 1715–1996, based on the δ18O cycle chronology. the decrease of annual layer thickness (apparent accumulation rate) back with time is affected by the thinning of the layers with depth. In order to decompress the annual layers, we used the Nye model for vertical thinning (Reference PatersonPaterson, 1994). to decompress the annual layers we used an accumulation rate of 0.36 mw.e. a–1, based on the depth of the 1963 reference horizon (Reference PinglotPinglot and others, 1999). the thinned (measured) and the decompressed (calculated) accumulation rates are shown in Figure 6. the decompression of the data introduces an uncertainty to the time (depth) gradient of the accumulation rate. TheNye model assumes a constant vertical strain rate, while other models have more sophisticated solutions (Reference Dansgaard and JohnsenDansgaard and Johnsen, 1969; Reference Raymond, Weertman, Thompson, Mosley-Thompson, Peel and MulvaneyRaymond and others, 1996). An imperfection of all these models is that they fail to take into account variations in accumulation rate. However, time-averaged accumulation rate influences the thinning rate more than does accumulation variance.
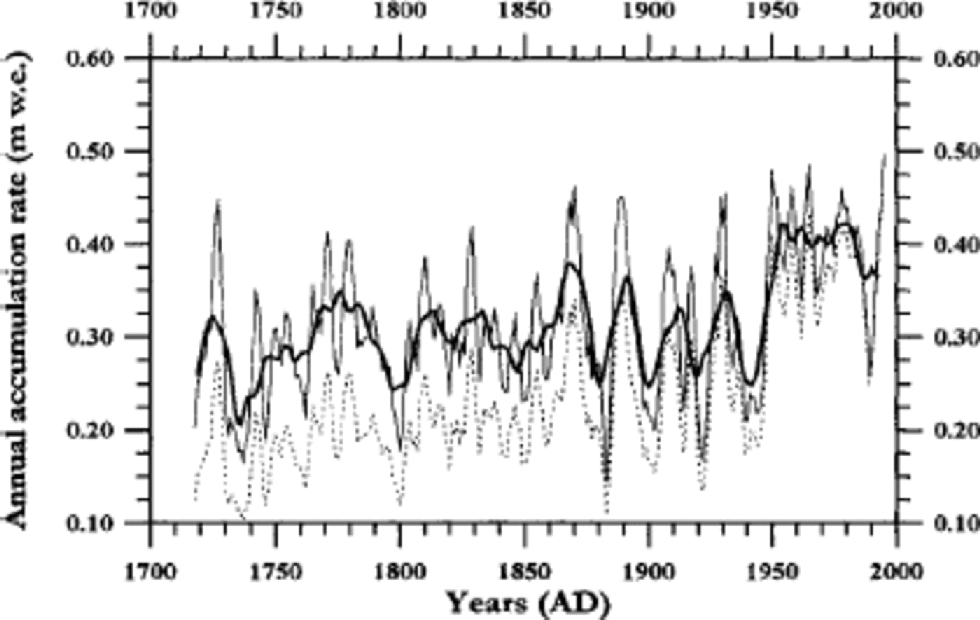
Fig. 6 The calculated annual accumulation rates, AD1715– 1997. the lower curve (dashed line) shows the thinned annual thickness from the ice core. the upper curve (thin line) is the decompressed annual thickness, giving the accumulation rates. Both curves are plotted using a weighted 5 year running mean. the thicker line is the 11year running mean of the decompressed accumulation rates.
The general trend of accumulation rates seen in Figure 6 is an average accumulation rate of about 0.30 mw.e. a–1 from the 18th century to the mid-20th century, with a ~25% increase to an average of about 0.42 mw.e. a–1 in the later part of the 1940s. the accumulation rate in the lower part of the series is the most sensitive to uncertainty in the decompression, and the long-term gradient may then be somewhat in error. However, the date at 81 m depth using a Nye model with both the 1963 and the 1783 reference horizons (providing two accumulation rates in different periods) is 1704 (Reference Kekonen, Moore, Mulvaney, Isaksson, Pohjola and van deWalKekonen and others, 2002), which is very close to the 1715 date found from the isotope cycles. the 10 year discrepancy between the methods in the extrapolation of some 70 years beyond the Laki marker suggests a combined error in both methods of about 15%, which is consistent with our earlier estimate of approximately 10% error in the cycle-counting method. the large increase of accumulation rate in the mid-20th century is certainly real, and probably shows another mode of precipitation pattern over the icefield. Ground-penetrating radar surveys over the surrounding glaciers show that internal reflection horizons are also indicative of a late-20th-century rise of about 10% in accumulation rates (Reference PälliPälli and others, in press).
Another feature visible in the accumulation data, which is independent of the decompression model, is the periodicity of the accumulation rates. Singular spectrum analysis (SSA; e.g. Reference Vautard, Yiou and GhilVautard and others, 1992), using a window of 60 years and Monte Carlo significance testing with 1000 statistically similar surrogate series, was performed to make robust estimations of non-linear trends and quasi-periodic components. SSA is particularly useful for finding oscillations that are not strictly periodic, such as may be expected if there are some errors in dating the ice core year-by-year. As SSA operates in the time rather than the frequency domain, errors in dating contribute to an overall lowering of the signal-to-noise ratio, while still allowing quasi-periodic signals to be found and their significance tested. There is no significant long-term trend in accumulation in the decompressed data. SSA shows quasi-periodic signals significant at the 99% level against both white and red noise in the quasi-biannual (QB: 2.1 year) band accounting for 3.4% of the variance. There is also a highly significant signal with a period of 20.7 years accounting for 6.3% of the variance. Additional signals significant against red noise were found at 3.5, 2.7 and 2.1 year periods. the maximum entropy spectrum in Figure 7 is a more traditional view of the frequency content of the accumulation-rate record, and the significant power peaks are at the same frequencies as found by the more robust SSA technique. While the 2–4 year power band may be speculated to have an El Niño−Southern Oscillation origin, the 20.7 year period signal has not been shown in other Arctic records, as far as we know. SSA of the large-scale atmosphere circulation patterns over the Arctic and Atlantic−the North Atlantic Oscillation and the Arctic Oscillation (Reference Thompson and WallaceThompson and Wallace, 1998)−shows power in the QB band. Similar results are seen in North Atlantic sea surface temperatures, and ice conditions in the Baltic Sea (Reference Jevrejeva and MooreJevrejeva and Moore, 2001). Our finding of the two highly significant periodic signals, especially the well-known QB signal, adds confidence to our dating.
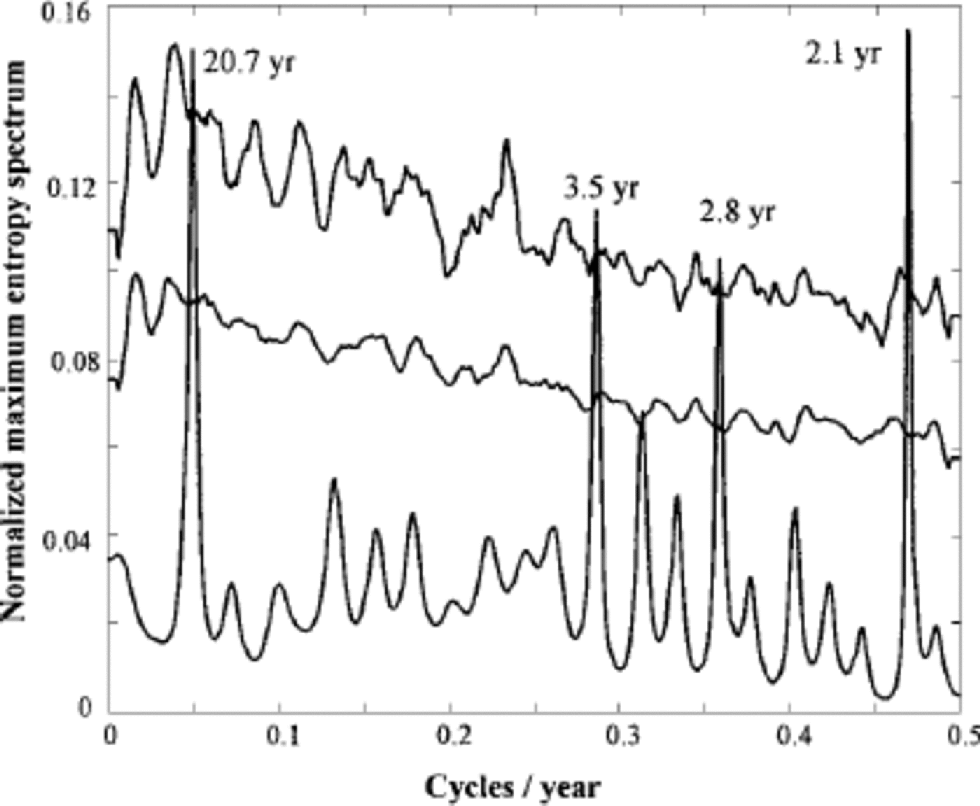
Fig. 7 Normalized maximum entropy spectrum (of order 50) of the accumulation rate (lower curve). the 99% and 95% significance levels against red-noise estimates from 1000 first-order autoregressive Monte Carlo simulations are shown in the two uppermost curves. the peaks at 20.7, 3.5, 2.8 and 2.1years are clearly significant.
Conclusions
We can construct an ice-core chronology from Lomonosovfonna using isotope cycles as time markers. the continuously sampled precipitation at a nearby coastal station shows pronounced annual cycles in stable isotopes in water, which correspond to similar-magnitude isotope cycles found in the ice-core data.
We further find that diffusion of the isotope signal has damped the seasonal amplitudes in the ice-core record, so that the amplitude of seasonal cycles in deuterium excess is of the same magnitude as the analytical uncertainty. the δ18O cycles are still detectable in the record, at least down to 80 m core depth, due to their much lower analytical uncertainty. the thinning of annual layers suggests that the lower 40 m of the core should be sampled with higher resolution in order to reveal annual cycles. from the Nye time-scale we find that an average annual layer at 100m depth would be 6 cm thick. This suggests that we need a sample size of about 2 cm to reveal annual layers at this depth.
The calculated annual accumulation rates over the ice-field show a general trend of lower accumulation from the 18th century to the mid-20th century, when accumulation rates increased rapidly. We also find significant periodicity in the accumulation record at 2.1 and 21years.
Acknowledgements
We are grateful for the work done by everyone involved in the Lomonosovfonna Ice Core Project. E. Huss, J. Ivask, T. Jauhiainen, M.Karczmarska,H. Samuelsson, C. vander Veen and J. Vähviläinen are thanked for sampling assistance. A. Igesund is thanked for the Svalbard map. We are grateful to the Finnish Academy, the Nordic Council of Ministers, the Norwegian Polar Institute, Stiftelsen Ymer-80 and the Swedish Natural Science Council for funding. Comments from two referees and the editor E. Steig aremuch appreciated.


