Introduction
Water is crucial for sustainable agriculture and food security. The growing water scarcity has emerged as a barrier to attaining sustainable development. Insufficient water availability is an obstacle for the growth, productivity and adaptation of crops in semi-arid regions around the world. Water resources and unpredictable rainfall patterns have an impact on the long-term viability of crop production. In areas where water resources are scarce and demand for food is increasing due to a growing population, managing water resources and growing of crops that can withstand the harsh climate have become critical factors for sustainable agriculture. Promising results can be achieved by growing crops such as amaranth and quinoa, which are drought- and salt-tolerant thereby increasing productivity in regions with drought and salinity problems (Jacobsen et al., Reference Jacobsen, Mujicar and Ortiz2003; Yazar and İnce Kaya, Reference Yazar and İnce Kaya2014).
Water-efficient irrigation strategies play a crucial role in reducing crop water use. These strategies, e.g. deficit irrigation (DI), partial root drying irrigation and regulated deficit irrigation (RDI) have been developed for controlled water management. DI has proven its effectiveness as a water-saving irrigation technique, allowing crops to grow with a lower amount of irrigation water compared to the total water typically required for crop evapotranspiration (ETa) (Gonzalez-Dugo et al., Reference Gonzalez-Dugo, Ruz, Testi, Orgaz and Fereres2018, Wang et al., Reference Wang, Yan, Sun, Su and Zhang2019; Abdelkhalik et al., Reference Abdelkhalik, Pascual, Nájera, Domene, Baixauli and Pascual-Seva2020). RDI is a technique that focuses on application of a controlled water deficit during the plant growth stages. The aim is to save as much irrigation water as possible while minimizing the negative effects of water deficit, on crop yield. It also plays a role in improving water productivity (WP) (Blanco et al., Reference Blanco, Martínez-Hernández, Artés-Hernández, Blaya-Ros, Torres-Sánchez and Domingo2019).
Amaranth (Amaranthus spp.), which belongs to the category of C4 plants, improves the efficiency of water utilization and photosynthesis in climates and areas with drought compared to C3 plants. The exceptional nutritional value of amaranth along with its ability to thrive in harsh environments makes it a promising choice for growing crops in arid and semi-arid regions (Ecker et al., Reference Ecker, Weinberger and Qaim2010; Emire and Arega, Reference Emire and Arega2012; Rastogi and Shukla, Reference Rastogi and Shukla2013). As amaranth can meet the immediate needs of rural populations in agriculturally deprived areas, it is a crop with properties that can help mitigate the effects of climate change and promote food security. As the cost of water for irrigation is increasing, and water supplies are becoming scarcer, so irrigation scheduling techniques will need to become more accurate. An effective way to save water and improve productivity, quality and yield is to schedule irrigation with pressurized irrigation systems, paying particular attention to microirrigation techniques like surface drip (SD) and subsurface drip (SSD) irrigation (Bozkurt Çolak et al., Reference Bozkurt Çolak, Yazar, Alghory and Tekin2021). The effective scheduling of irrigation requires a quantitative assessment of the impending crop water deficit stress (Jones, Reference Jones2007). To optimize the use of water and energy and maximize profits, one must have a thorough understanding of the soil water status, crop water requirements, crop water stress status and potential yield loss under water-stressed conditions (Kang et al., Reference Kang, Hu, Goodwin, Jirie and Zhang2002; Zegbe et al., Reference Zegbe, Behboudian, Lang and Clothier2002). Still, since crops react to both the soil and the climatic environment, scheduling irrigation according to crop water status may be more advantageous (Yazar et al., Reference Yazar, Howell, Dusek and Copeland1999). In recent years, the use of crop-based irrigation strategies therefore has increased. Direct measurements of some factors, such as leaf water potential (LWP) and canopy temperature are among the potential indicators of crop water status.
Grain amaranth has been shown to be resistant to abiotic conditions such as salinity and drought in numerous studies. Irrigation only during delicate growth stages helps maintain productivity and increase water-use efficiency (Lavini et al., Reference Lavini, Pulvento, d'Andria, Riccardi and Jacobsen2016; Pulvento et al., Reference Pulvento, Sellami and Lavini2022). A significant growth stage that appears to influence grain output is the absence of water during flowering formation; in contrast, soil water deficit during vegetative growth stages enhances the assimilate allocation to the above-ground biomass, especially to the grain (Mlakar et al., Reference Mlakar, Bavec, Jakop and Bavec2012).
In Adana, Turkey, grain amaranth genotypes were significantly affected by the rainfed (RF) (drought) conditions in contrast to irrigated conditions. Under RF conditions yield decreased by 56%, biomass by 43% and harvest index by 20%. Yazar et al. (Reference Yazar, Bozkurt Çolak and Tekin2013) evaluated the grain yield performance of grain amaranth cultivars (A-2, -5, -7, -12, -14) in Adana, Turkey, during a 2-year adaptation experiment. When evaluated under irrigation, grain yields of amaranth cultivars ranged from a low value of 2441 kg/ha for A-7 to a high value of 4441 kg/ha for A-14.
A field experiment was conducted under a shading net to evaluate the impact of different levels of drip irrigation on yield and water-use efficiency of amaranth (Amaranthus hybridus L). Five treatments – drip irrigation for 60, 80, 100 and 120% of the water requirement, and furrow irrigation for 100% of the water requirement were used in the randomized block design experiment. Drip irrigation was used to irrigate the amaranth crop at 100% of the water requirement and produced the best economic yield per plant (149.3 g/plant) and fresh yield per hectare (22.7 t/ha). Drip irrigation with 60% of the water requirement gave the lowest economic yield per hectare (14.20 t/ha) (Peter et al., Reference Peter, Ayyanagowdar, Babu, Pampanna, Polisgowdar and Ramesh2019).
The effects of irrigation and nitrogen levels on the growth and yield of grain amaranth (Amaranthus hypochondriacus L.) were investigated in a field experiment. Significantly higher growth and yield indices were observed in the treatment that irrigated at 30, 60 and 75 days after sowing; significantly higher grain and stover yields (911 and 2401 kg/ha, respectively) were observed (Srujan et al., Reference Srujan, Pater, Madagoudra, Lokesh and Terin2021).
Given the lack of information on the effect of water deficits on the crop water-stress index (CWSI) and mid-day LWP of amaranth, the objectives of this work were to investigate the effects of water restrictions on the yield, WP, CWSI and LWP under various DI strategies (regulated deficit irrigation and conventional deficit irrigation) applied with SD and SSD irrigation systems under the Mediterranean climatic conditions.
Materials and methods
Experimental site, soil and irrigation water
The study was conducted in 2019–20 in the Tarsus Soil and Water Resources Department of Alata Horticulture Research Institute (36°53′N and 34°57′E, altitude 30.0 m above sea level), in the Mersin-Tarsus region of Turkey. Although the average annual rainfall is 616 mm, about 54% of the total amount falls between November and May. In 2019, the average annual temperature was 17.8°C, the average annual relative humidity was 71.0% and the average annual evaporation was 1487 mm (MGM, 2019). Table 1 lists some of the soil's physical and chemical properties.
Table 1. Physical and chemical properties of different soil layers of the experimental site

FC, field capacity; WP, wilting point; BD, bulk density; EC, electrical conductivity; CaCO3, calcium carbonate; P2O5, phosphorus pentoxide; K2O, potassium oxide; OM, organic matter SiCL, silty clay loam; SiC, silty clay.
The soil pH range at the experimental location is 7.8–8.1, the electrical conductivity (EC) of the saturation extract is 0.5–0.6 dS/m and the volumetric soil water content (SWC) at permanent wilting point and at field capacity of the root zone are 18.0–18.9 and 30.0–31.4%, respectively. The soil is characterized as Arikli silty-loamy and has a relatively high water holding capacity. The range of the mean bulk density is 1.30–1.44 g/cm3. Up to a soil depth of 60 cm, the soil has an available water storage capacity of 96 mm. The groundwater table is about 4 m below the soil surface.
The irrigation water used for the research was supplied from the irrigation canal. The irrigation water samples taken from the irrigation canal were analysed in the Soil and Water Resources Laboratory. According to the analysis the irrigation water salinity (EC) was 0.464 dS/m and pH was 8.04.
Irrigation treatments and experimental design
A randomized block design with four replicates in split plots was used for the field experiment. Two irrigation techniques SD and SSD irrigation systems; six irrigation strategies full irrigation (FI), conventional DI25, DI50, DI75, RDI and RF, in which no irrigation was applied except during crop emergence and establishment period made up the strategies. Irrigation techniques were assigned to the subplots, while SD and SSD irrigation systems were assigned to the main plots. FI in which 50% of the water available in the effective root-zone depth of 60 cm was used to restore the water deficit in the soil to field capacity. In RDI 50% of the FI was used up to the time of flowering, after which 100% of the required water was used as FI until harvest. DI75 and DI50, two DI treatments, received 75 and 50% of FI, respectively. Each subplot included six rows of plants and was 4.2 m long and wide. A distance of 1 m was left between each plot to avoid overlapping between irrigation treatments.
Irrigation systems
Two types of drip irrigation systems were used in the study, namely SD and SSD. In the plots of SD irrigation, 16 mm diameter polyethylene (PE) laterals with in-line emitters 0.40 m apart, each supplying 2.0 litres/h at an operating pressure of 100 kPa were used. In the experimental plots, a drip lateral line was positioned 0.70 m from the centre between the plant rows. A locally manufactured SD irrigation system from Betaplast Comp., Adana, Türkiye was used for the study. A chisel plow was used to bury the lateral lines of the SSD system 25 cm below the soil surface. In-line emitters with a flow rate of 2.0 litres/h were used in the SSD treatment plots spaced 0.40 m apart on the PE lateral line (Geoflow Corte Madera, CA, USA). A flow meter was attached to the control unit to measure the total flow supplied to all experiments in each treatment.
Agronomic practices
After a preliminary study in 2018, which revealed five amaranth varieties based on research conducted at Çukurova University under the 7th EU Research Framework Project (SWUP-MED Project), the variety with the highest grain yield was used in the study. On 22 April 2019 and 11 May 2020, 21-day-old seedlings were planted in the plots with a row spacing of 70 cm and a distance of 20 cm between the rows. Before planting amaranth seedlings in the experimental plots, the band was fertilized with a compound fertilizer consisting of 75 kg/ha N, 75 kg P2O5 and 75 kg K2O (15%–15%–15% N–P2O5–K2O). The remaining N was supplied to the plots via fertigation; 2.5 kg of urea (46% N) was mixed with water in a fertilizer tank at each irrigation stage, starting 3 weeks after planting. Irrigation applied 150 kg/ha of N to each plot through fertigation. A total of 225 kg/ha of N was applied to each plot. During cultivation weeds were weeded by hand.
Measurements and observations
During the research years, meteorological data were recorded by an automatic weather station on the experimental site. Table 2 shows the daily recorded rainfall, maximum and minimum air temperatures, air humidity, wind speed and solar radiation, as well as the long-term mean climate data from 1952 to 2020, summed for each growing season.
Table 2. Historical monthly mean and 2019–20 growing seasons weather data of the experimental site
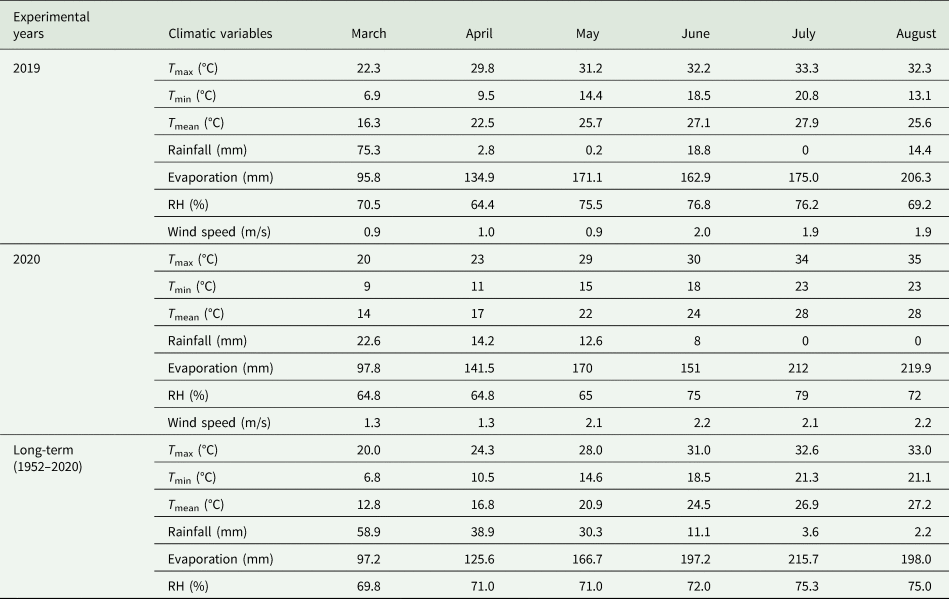
T max, maximum air temperature; T min, minimum air temperature; T mean, mean air temperature; RH, relative humidity.
Tiraditional gravimetric methods for measuring SWC (0–60 cm) and SWC measured by sensors (0–40 cm) were used. For each irrigation treatment, SWC sensors (SM-150, Delta T Devices, Cambridge, UK) with data recorders positioned between the two crops in the crop row at a depth of 20 and 40 cm on one replicate.
The following formula was used to determine how much irrigation should be applied to the total irrigation plots:
where A is the plot area (m2), P is the plant cover as percentage of wetted area (m2), V is the volume of irrigation water (L) and SWD is the soil water deficit in the experimental plots (mm). The SWD in the plots with FI was almost 50% of the water available in the soil up to 60 cm depth and all plots were irrigated at the same time. The percentage of crop cover immediately prior to irrigation was used to determine the percentage of wetting in each treatment plot. The FI was used to determine how much water was applied to the other treatments. Gate valves at the input of each manifold were used to regulate the amount of time that water was delivered to each treatment plot.
The water balance equation was used to determine the ETa or seasonal water consumption of the plants:
where I is the amount of irrigation water applied (mm), P is the precipitation (mm), ETa is the crop evapotranspiration (mm), ΔS is the variation in the SWC (mm) up to a 60 cm soil depth at planting and harvest, Ro is the runoff (mm), while Dp is the deep percolation. Deep percolation is defined as the amount of water percolating below a soil depth of 60 cm. In this study, the portion of precipitation that corresponds to the soil water deficit is regarded as effective precipitation.
The water stress of the plants can be determined quickly and non-destructively by monitoring the canopy temperature (T c). With the development of the CWSI, which is derived from canopy and air temperature, the use of canopy surface temperature to assess water stress in crops has become increasingly possible. Canopy surface temperatures (T c) were measured using a portable infrared thermometer (IRT, Everest Interscience, model 100L DL, Cambridge, USA), which has a field of view of 3° and detects radiation in the waveband of 8–14 μ. IRT readings were taken at a horizontal angle of 30–40° in order to have only crop canopy in the view area.
In the experimental years, when the percentage of plant canopy cover percentage was close to 70%, data collection for T c was started in the first week of May and continued until the amaranth reached physiological maturity. T c measurements were taken at a distance of approximately 1 m from the canopy at four different corners of the plot and the results were averaged to determine the canopy temperature of the plot. The T c measurements carried out under clear skies at mid-day (12.00 and 14.00 h local standard time). The temperature of the dry and wet bulb measured with monitored using an aspirated psychrometer (Assmann Psychrometer, Sato Keiryoki MFG Co., Ltd, Cambridge, Japan) at a height of 1.5 m in the open area space next to the experimental plots. At a mean barometric pressure of 101.25 kPa, the mean vapour pressure deficit (VPD) was determined by averaging measured instantaneous wet and dry bulb temperatures and applying the standard psychrometer equation. For a crop transpiring at its potential rate, the VPD and the air temperature difference (T c − T a) in the canopy are in a linear relationship represented by the CWSI. The CWSI was determined by lower and upper bounds by using the method described in Idso et al. (Reference Idso, Jackson, Pinter, Reginato and Hatfield1981):
where T c is the canopy temperature (°C), T a is the air temperature (°C), LL is the non-water-stressed baseline (lower baseline-line) (°C) and UL is the non-transpiring upper baseline (°C). Using information gathered just from the unstressed treatments (FI), LL for the canopy air temperature differential (T c − T a) v. the VPD relationship was calculated. The canopy temperatures of the heavily stressed plants in the RF treatment plots were measured several times over the amaranth growth season to confirm the upper baseline.
The most important determinant for the quality and production of crops is the crop water status. Maintaining the ideal crop water condition is of crucial importance. Throughout the growing season, mid-day LWP was measured with a pressure chamber (PMS Instrument Company, Model 615, Albany, USA) 1 day before irrigation (Scholander et al., Reference Scholander, Hammel, Bradstreet and Hemmingsen1965). Between 12.00 and 14.00 h, two fully grown sunlight leaves of one plant were used for the LWP measurements of each experimental unit. The mid-day LWP value for this plot was determined from the average of the two observations made on that day. WP and irrigation water productivity (IWP) were calculated using the following equations (Yazar et al., Reference Yazar, Howell, Dusek and Copeland1999):
where Y is the yield of the irrigated treatment (kg/ha), I is the irrigation water applied in the irrigated treatment (mm), WP is the water productivity (kg/m3) in terms of yield per unit of water applied, ETa is the actual crop evapotranspiration (mm) and IWP is the irrigation water productivity (kg/m3) in terms of yield per unit of irrigation water applied.
Depending on the physiological maturity of the plants, the 6 m long sections of the three adjacent middle rows in each plot were harvested manually to determine the grain yields. Six rows of plants were harvested in each plot, leaving one row outside the margins and 1 m from the heads, totalling an area of 4 m × 2.80 m = 11.2 m2. The method used to calculate above-ground dry matter (DM) production was to cut each plant in each plot at the ground level within a 1.0 m row segment at 14-day intervals until harvest. The plant samples were dried at 65°C until weight remained unchanged.
A LAI-2000 Plant Canopy Analyzer (Li-Cor 2000, Lincoln, NE, USA) was used to determine the leaf area index (LAI); measurements were taken in the middle two rows of amaranth plants in each treatment every 2 weeks during the growth season. In order to account for the canopy light interception at five distinct angles, four measurements were taken below the canopy and one above it. From these observations, LAI was calculated using a model of radiative transfer in vegetative canopies. The fish-eye field of vision having a 148° field of view ensures that LAI calculations are based on a large sample of the foliage canopy, and the many readings taken below the canopy ensure that the LAI calculations are based on a sizable sample of the vegetation canopy.
Plants were observed weekly and when the first inflorescence appeared on the main stem was noted. The date on which the seedlings were transferred to the experimental plots and the day on which 50% of the plants in that plot showed inflorescence were used to calculate the time until blooming. From the time of blossoming to grain maturity, the reproductive growth phase was noted. Here, the length of the growth season is the entire amount of time that has passed between planting the seedlings in the field and harvesting them.
Economic analysis
The total cost of crop production, the annual cost of the irrigation system, the cost of irrigation labour and the cost of water were included in the calculation of the total cost of amaranth production for the experimental years. The net return was calculated as the difference between total production costs and the gross incomes per hectare (Dağdelen et al., Reference Dağdelen, Başal, Yılmaz, Gürbüz and Akcay2009; Sezen et al., Reference Sezen, Şengül, Baytorun, Daşgan, Akyildiz, Tekin, Onder, Agcam, Akhoundnejad and Gügercin2015). Information on the amaranth production costs and sale prices were obtained from the Chamber of Farmers’ Association and the Agricultural Provincial Directorate in Mersin. The production costs of amaranth include land rent, fertilizer, seeds, tillage, plant protection and labour costs for irrigation, harvesting and transportation costs. The net benefit was estimated by the difference between the total production costs and the income generated.
Statistical analysis
Analysis of variance was performed on the data using SAS's JMP statistical program (SAS Institute, Inc., Cary, NC, USA). The least significant difference (LSD) test was used to compare treatment means (Steel and Torrie, Reference Steel and Torrie1980).
Results
Irrigation and ETa
It was found that the long-term average mean temperatures corresponded to the climatic conditions in the experimental years. Monthly precipitation varied in the years and periods in which the study was conducted. In the study, a total of 20.6 mm of precipitation fell in 2019, a total of 37.2 mm in the 2020 growing season.
Table 3 shows the irrigation amount and the ETa values for the two irrigation systems and irrigation treatments during the experimental years. All treatments received 50 mm of irrigation water with sprinkler irrigation in two applications (22/04/2019 and 06/05/2019) in order to establishing uniform plant stand at the beginning of the 2019 growing season.
Table 3. Amaranth seasonal irrigation, actual Eta, grain yield, WP, IWP, LAI and DM yield values under different treatments in the growing seasons of experimental years 2019–20
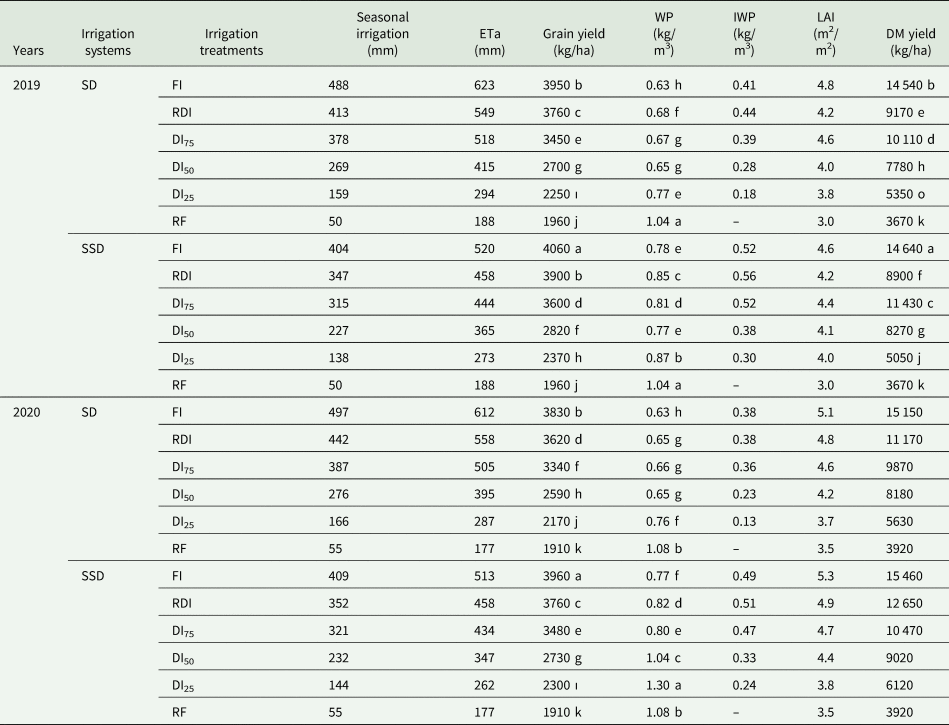
SD, surface drip irrigation; SSD, subsurface drip irrigation; FI, full irrigation; RDI, regulated deficit irrigation; DI75, DI50, DI25, deficit irrigation.
Values followed by different small letters (a, b and c) indicate significant differences at **P < 0.01 (1% significant level); *P < 0.05 ( 5% significant level); P > 0.05 ns (not significant).
In the 2019 growing season, the SD irrigation plots received different amounts of irrigation (159 mm in the DI25 and 488 mm in FI treatment), the SSD plots received corresponding amounts between 138 and 404 mm. An 84 mm more water was applied to the SD plots with FI than with SSD. The RDI and DI75 treatments in SD plots applied to 413 and 378 mm, respectively, while in SSD plots the RDI and DI75 treatments applied 347 and 315 mm, respectively in 2019. In the 2020 growing season, the DI25 and FI treatments received 166 and 497 mm of irrigation water, respectively, while the SSD plots received 144 and 409 mm of irrigation water, respectively. The total irrigation applied to RDI plots was 442 mm under SD, while 387 mm was applied to DI75 plots. Due to the higher maximum air temperatures that occurred in the second year of the study (2020), all treatments received a slightly higher amount of irrigation water than in the 2019 growing season.
In the 2019 growing season, the seasonal crop ETa values varied between 188 mm in RF and 623 mm in FI in SD, and between 188 mm in RF and 520 mm in FI in SSD plots. In 2020, ETa values varied between 177 and 513 mm in SSD plots, and from 177 mm in RF to 612 mm in FI in SD plots. Because there was less surface evaporation from the SSD plots, amaranth under SD plots required more water than SSD plots for the same treatment ETa values in the SD system, for DI75 it was 518 mm and for RDI it was 549 mm during the first experimental year. The ETa values for the SSD were 444 and 458 mm in 2019 and 2020, respectively. In 2020, DI75 and RDI irrigation trials received 505 and 558 mm under SD; the corresponding values were 434 and 458 mm under SSD, respectively. In the 2019 growing season ETa values were generally greater than those in 2020 due to higher amounts of rainfall and lower relative humidity during the second experimental year.
Variation of SWC
Figures 1(a)–(d) and 2(a)–(d) show the variation in SWC at 15 and 45 cm soil depth for the different irrigation treatments under SD and SSD systems in the experimental years. Figure 1(a) illustrates how SWC at a soil depth of 15 cm in FI remained close to 50% available water (AW) until 87 days after transplanting (DAP 87) in 2019. From this point onwards, as the season progressed, SWC gradually dropped below 50% AW over time towards the end of the growing season. Throughout the growing season, SWC values showed similar patterns in the irrigation treatments under SD and SSD. Nevertheless, SWC was higher at a depth of 15 cm under SSD than under SD irrigation, and this difference was more pronounced at the beginning of the season. The occurrence of evaporation losses at the surface under SD irrigation is responsible for this difference. As the season progressed, SWC decreased in all treatments and more water was retained at a soil depth of 15 cm in the SSD irrigation. In the DI75 and RDI irrigation treatments, SWC remained below that of FI during the growing season SWC in RDI was similar to DI50 at the beginning of the growing season when a 50% decrease was applied during the vegetative growth stage. However, after flowering, SWC in RDI showed a similar trend to FI until harvest. Therefore, these two treatments did not lead to any water stress during the entire growth period of amaranth. In the DI50, DI25 and RF treatments, water stress gradually increased towards the end of the growing season, with SWC fluctuating. In contrast, SWC is maintained at a fairly high level in the DI75 treatment. Towards the end of the growing season, SWC in the RF treatment reached the wilting point. Figures 1(b) and (d), as well as Figs 2(b) and (d), illustrate similar trends for SWC variation at 45 cm soil depth for the treatments in the experimental years. The SWC values in the FI, RDI and DI75 treatments were still comparatively higher than those in DI50, DI25 and RF. In the corresponding treatments, the SWC values at 45 cm soil depth were higher than SWC values at 15 cm depth. It can therefore be concluded that amaranth consumed most of the water from soil depth of 0–45 cm in various treatments. As the growing season progressed, the SWC decreased steadily in all treatments and reached its lowest values towards the end of the growing season.
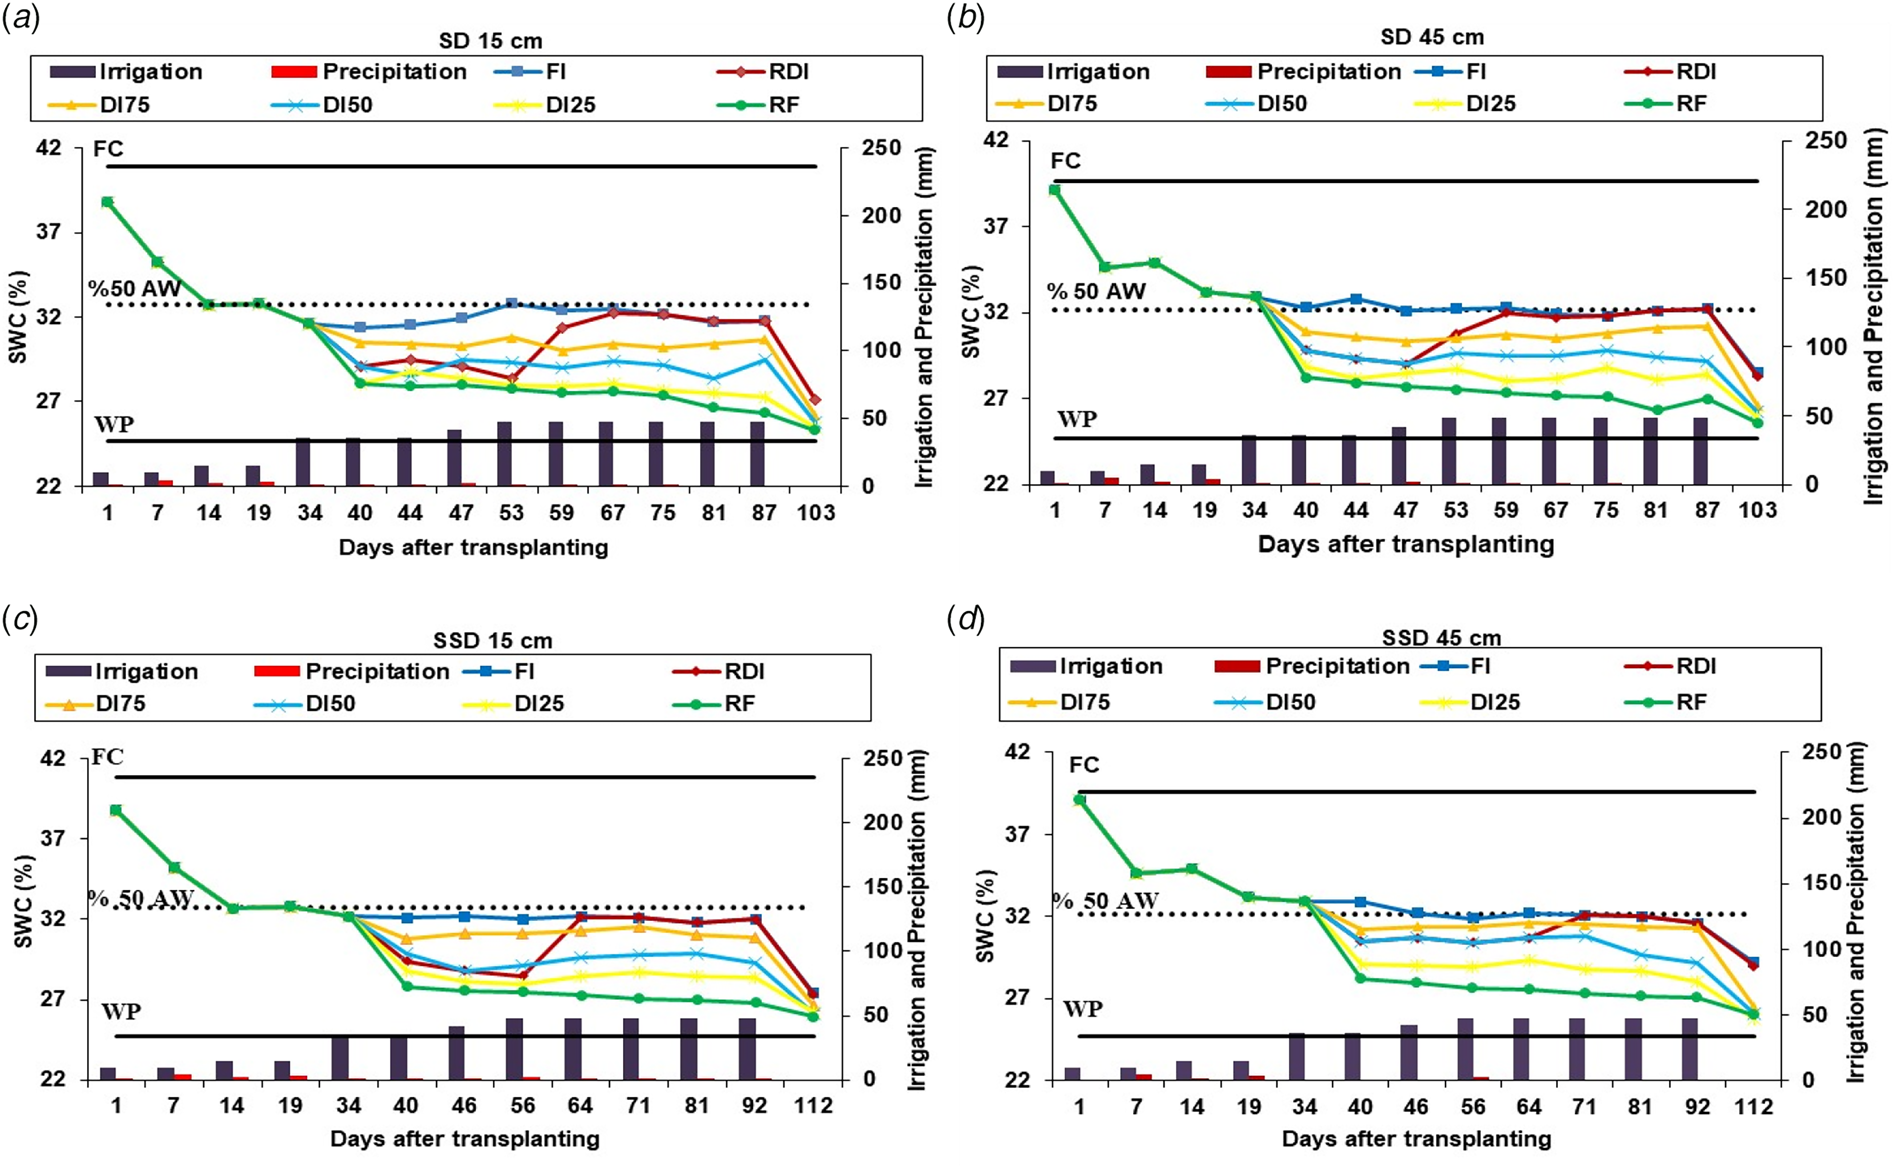
Figure 1. Soil water storage variation under the different treatments: (a) SWC in SD at 15 cm; (b) SWC in SD at 45 cm; (c) SWC in SSD at 15 cm; (d) SWC in SSD at 45 cm in 2019. SWC, soil water content; FC, field capacity; WP, wilting point; SD, surface drip irrigation; SSD, subsurface drip irrigation; FI, full irrigation; RDI, regulated deficit irrigation; DI75, 75% deficit irrigation; DI50, 50% deficit irrigation; DI25, 25% deficit irrigation; RF: rainfed.
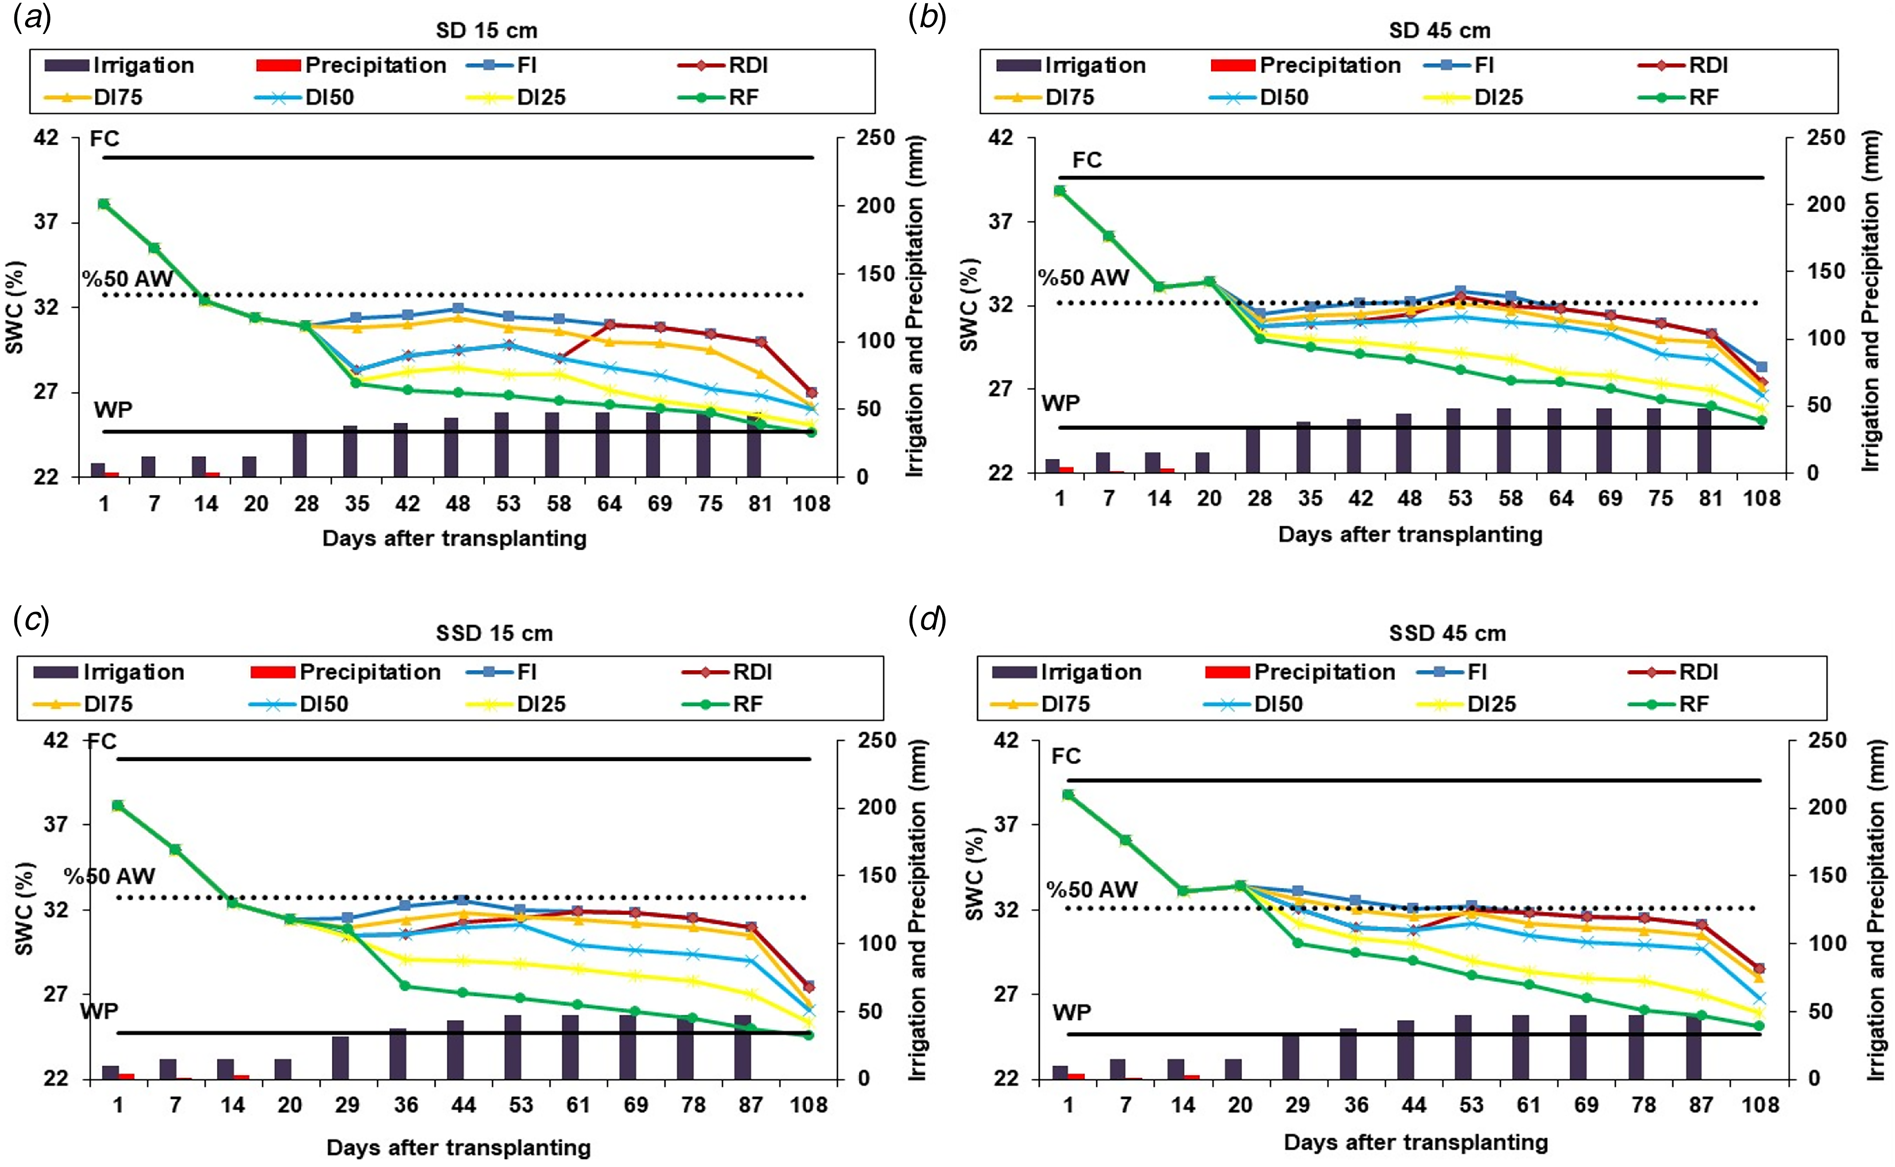
Figure 2. Soil water storage variation under the different treatments: (a) SWC in SD at 15 cm; (b) SWC in SD at 45 cm; (c) SWC in SSD at 15 cm; (d) SWC in SSD at 45 cm in 2020. SWC, soil water content; FC, field capacity; WP, wilting point; SD, surface drip irrigation; SSD, subsurface drip irrigation; FI, full irrigation; RDI, regulated deficit irrigation; DI75, 75% deficit irrigation; DI50, 50% deficit irrigation; DI25, 25% deficit irrigation; RF: rainfed.
Grain yield
The grain yield values for the two drip irrigation techniques and the different irrigation treatments in the experimental years (Table 3). The results of the statistical analysis for the variables are shown in Tables 4 and 5. Statistical evaluation of the results for grain yields obtained during two experimental years showed the prevailing effect of the climatic conditions during the study. According to the combined variance analysis results (Table 4), the years were not similar (P < 0.01). Therefore, the yields obtained in 2019 and 2020 were evaluated separately. For the SD system, grain yields ranged from 2250 kg/ha for DI25 to 3950 kg/ha for FI, and varied between 2370 kg/ha for DI25 and 4060 kg/ha for FI for the SSD system. In the first year, the RF treatment produced a grain yield of 1960 kg/ha and in the second year the RF yield was 1910 kg/ha. Grain yields in the second year varied from 2300 kg/ha in DI25 to 3960 kg/ha in FI and ranged from 2170 kg/ha in DI25 to 3830 kg/ha in FI under SSD. The treatments in 2020 produced higher yields than in 2019. There was a significant difference in grain yields between the SSD and SD irrigation systems in the experimental years. SSD produced significantly higher yields than the SD method (Table 4). There were also significant differences in yields between the 2019 and 2020 growing seasons (P < 0.01). FI under the SSD system produced significantly higher yields than the other treatments in the 2019 growing season, followed by FI under SD and RDI under SSD. In the 2020 growing season, FI under the SSD system produced a significantly higher yield than the other treatments, followed by FI under the SD system and RDI under the SSD system. In both irrigation systems, the RDI treatments resulted in significantly higher yields than the conventional DI treatments: DI75, DI50 and DI25 (Table 5).
Table 4. Combined statistical analysis results of grain yield, WP, IWP, LAI and DM yield of amaranth under different treatments
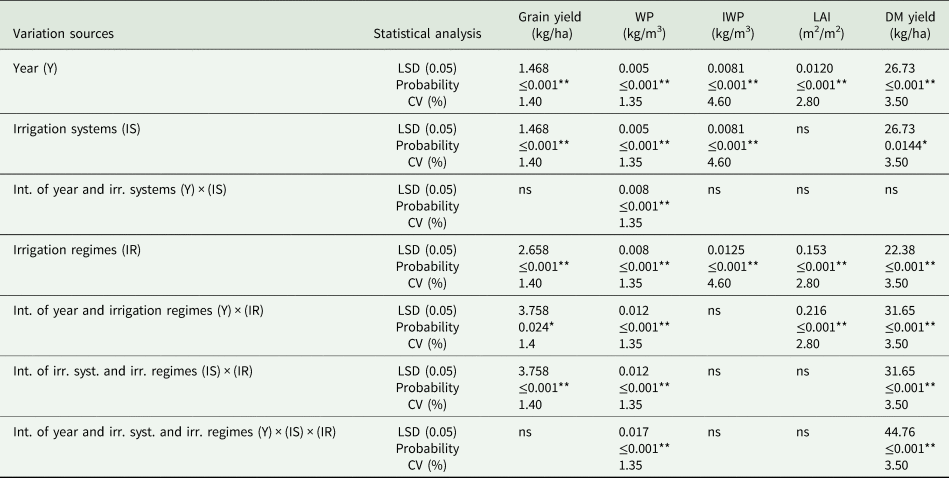
CV, coefficient of variation; LAI, leaf area index; WP, water productivity; IWP, irrigation water productivity.
Significant differences LSD (least significant difference) grouping at **P < 0.01 (1% significant level); LSD grouping at *P < 0.05 (5% significant level); P > 0.05 ns (ns, not significant).
Table 5. Comparison of mean grain yield, mean WP, IWP, LAI and DM yield of amaranth averaged over two drip irrigation systems for the different treatments in the 2019–20 growing seasons

FI, full irrigation; RDI, regulated deficit irrigation; DI75, DI50, DI25, deficit irrigation; LAI, leaf area index; WP, water productivity; IWP, irrigation water productivity.
Values followed by different small letters (a, b and c) indicate significant differences LSD (least significant difference) grouping at **P < 0.01 (1% significant level).
DM yield
The DM yield values for each treatment under both the drip systems in the experimental years are shown in Table 3. Combined statistical evaluations of the results for DM yields are shown in Table 4. The irrigated treatments produced above-ground DM yields that varied from 5350 kg/ha in DI25 to 14540 kg/ha in FI under SD, and DM values under the SSD system ranged from 5050 kg/ha in DI25 to 14 640 kg/ha in 2019. DM yield values in 2020 varied from 5630 kg/ha to 15 150 kg/ha in FI under SD and 6120 kg/ha in DI25 to 15 460 kg/ha in FI under SSD. RF produced the lowest DM in both experimental years (Table 3). The interaction between irrigation methods and irrigation treatments differed significantly (P < 0.01) in DM yields in the first year. In the second year, however, a significant difference was only observed for the irrigation treatment. In the 2019 growing season, FI under SSD produced a significantly higher DM yield than other treatments, followed by FI under SD plots. Compared to the other treatments RDI produced less DM than DI75 under SD, but RDI resulted in higher DM yields than DI75 under SSD. The FI treatments under both the drip systems produced significantly higher DM yields in the second year (Table 5).
Leaf area index
The maximum values of LAI for different treatments under SD and SSD systems in the experimental years are shown in Table 3. LAI values varied from 3.8 in DI25 to 4.8 in FI under SD; in FI under SSD they varied from 4.0 to 4.6 in 2019. In the 2020 growing season LAI values varied from 3.8 in DI25 to 5.3 in FI under SSD and from 3.7 in DI25 to 5.1 in FI under SD. In the two experimental years, RF achieved the lowest LAI values. The irrigation treatments resulted in significantly different LAI values (P < 0.01) in the 2019 and 2020 growing seasons. Combined statistical evaluations of the results for LAI in are shown in Table 4. The treatments produced the highest LAI values in both systems, followed by the RDI and DI75 treatments. Tables 4 and 5 show that there was no significant difference in LAI between the SSD and SD irrigation systems in the experimental years. As the season progressed, LAI values decreased in all treatments due to leaf senescence.
Leaf water potential
The variation in LWP values before irrigation for different treatments during the course of the 2019 and 2020 growing seasons is shown in Figs 3(a)–(d). LWP values generally decreased at higher values of water stress. The LWP values in the plots with SD irrigation varied from −1.03 MPa in FI to −1.48 MPa in DI25 under the SD system in 2019; they varied from −0.98 MPa in FI to −1.42 MPa in DI25 under the SSD system. LWP values changed in the second year and ranged from −1.02 MPa in FI and −1.43 MPa in DI25 under SSD, and LWP varied from −1.06 MPa in FI to −1.47 MPa in DI25 under SD. The lowest LWP values were observed in the RF plots. RF resulted in LWP values of 1.65 MPa in the first year and −1.62 MPa in the second year. Higher LWP values were observed in the plots with FI treatment than in the plots with conventional DI and in the treatment plots with RDI treatment under both the drip systems. We observed slightly higher LWP values in SSD plots than in the SD plots, but the difference between the two irrigation systems was not significant. In general, LWP values decreased towards the end of the season compared to the beginning of the season.
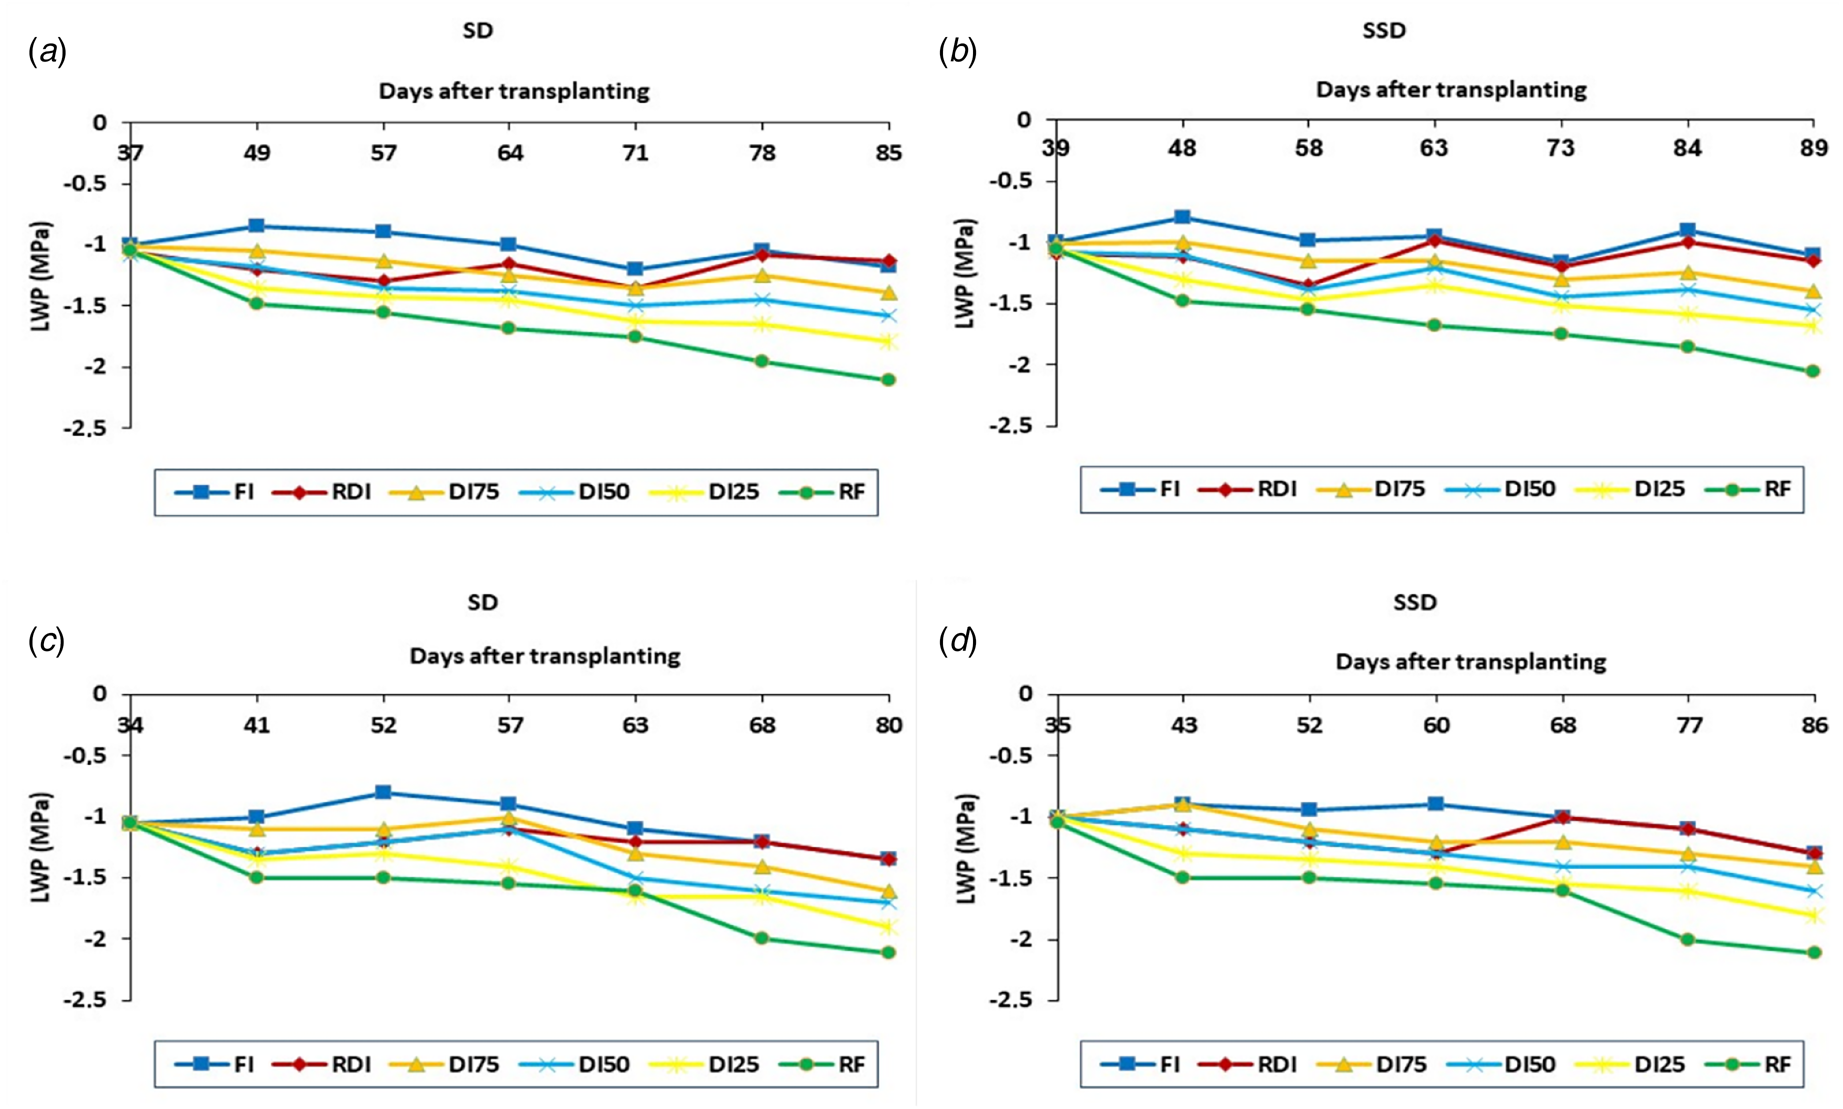
Figure 3. LWP variation for the different treatments under SD and SSD irrigation systems: (a) LWP in SD in 2019; (b) LWP in SSD in 2019; (c) LWP in SD in 2020; (d) LWP in SSD in 2020. SWC, soil water content; FC, field capacity; WP, wilting point; SD, surface drip irrigation; SSD, subsurface drip irrigation; FI, full irrigation; RDI, regulated deficit irrigation; DI75, 75% deficit irrigation; DI50, 50% deficit irrigation; DI25, 25% deficit irrigation; RF: rainfed.
Crop water-stress index
Psychrometric measurements were used to determine the VPD of the air and the empirical technique was used to calculate the relationship between T c − T a and the CWSI. Using the empirical equations from Idso et al. (Reference Idso, Jackson, Pinter, Reginato and Hatfield1981), the upper limit (UL) and lower limit (LL) for amaranth were established as follows: LL = −0.5871 VPD + 1.0769, and UL = −0.0624 VPD + 4.0828. However, since the intercept value in the UL calculation is modest, the UL is assumed to be 4.08°C.
The changes in CWSI before irrigation for the different treatments during the growing seasons were studied. In the first year, the seasonal mean CWSI values for SD treatments ranged from 0.19 in FI to 0.60 in DI25 under SD, and the seasonal mean CWSI values for SSD treatments varied from 0.16 in FI to 0.56 in DI25 under SSD (Figs 4(a)–(d)). In the second year, seasonal mean CWSI values varied from 0.22 in FI to 0.57 in DI25 for SD treatments and from 0.18 in FI to 0.54 in DI25 under SSD treatments for SSD treatments. The CWSI values in RF were 0.68 and 0.67 in the 2019 and 2020 experimental years, respectively. Due to the lower SWC caused by the dry weather and lack of irrigation, the CWSI values increased in the RF treatment. Compared to DI50 and RF, CWSI values were lower in the RDI and DI75 treatments under the drip systems.
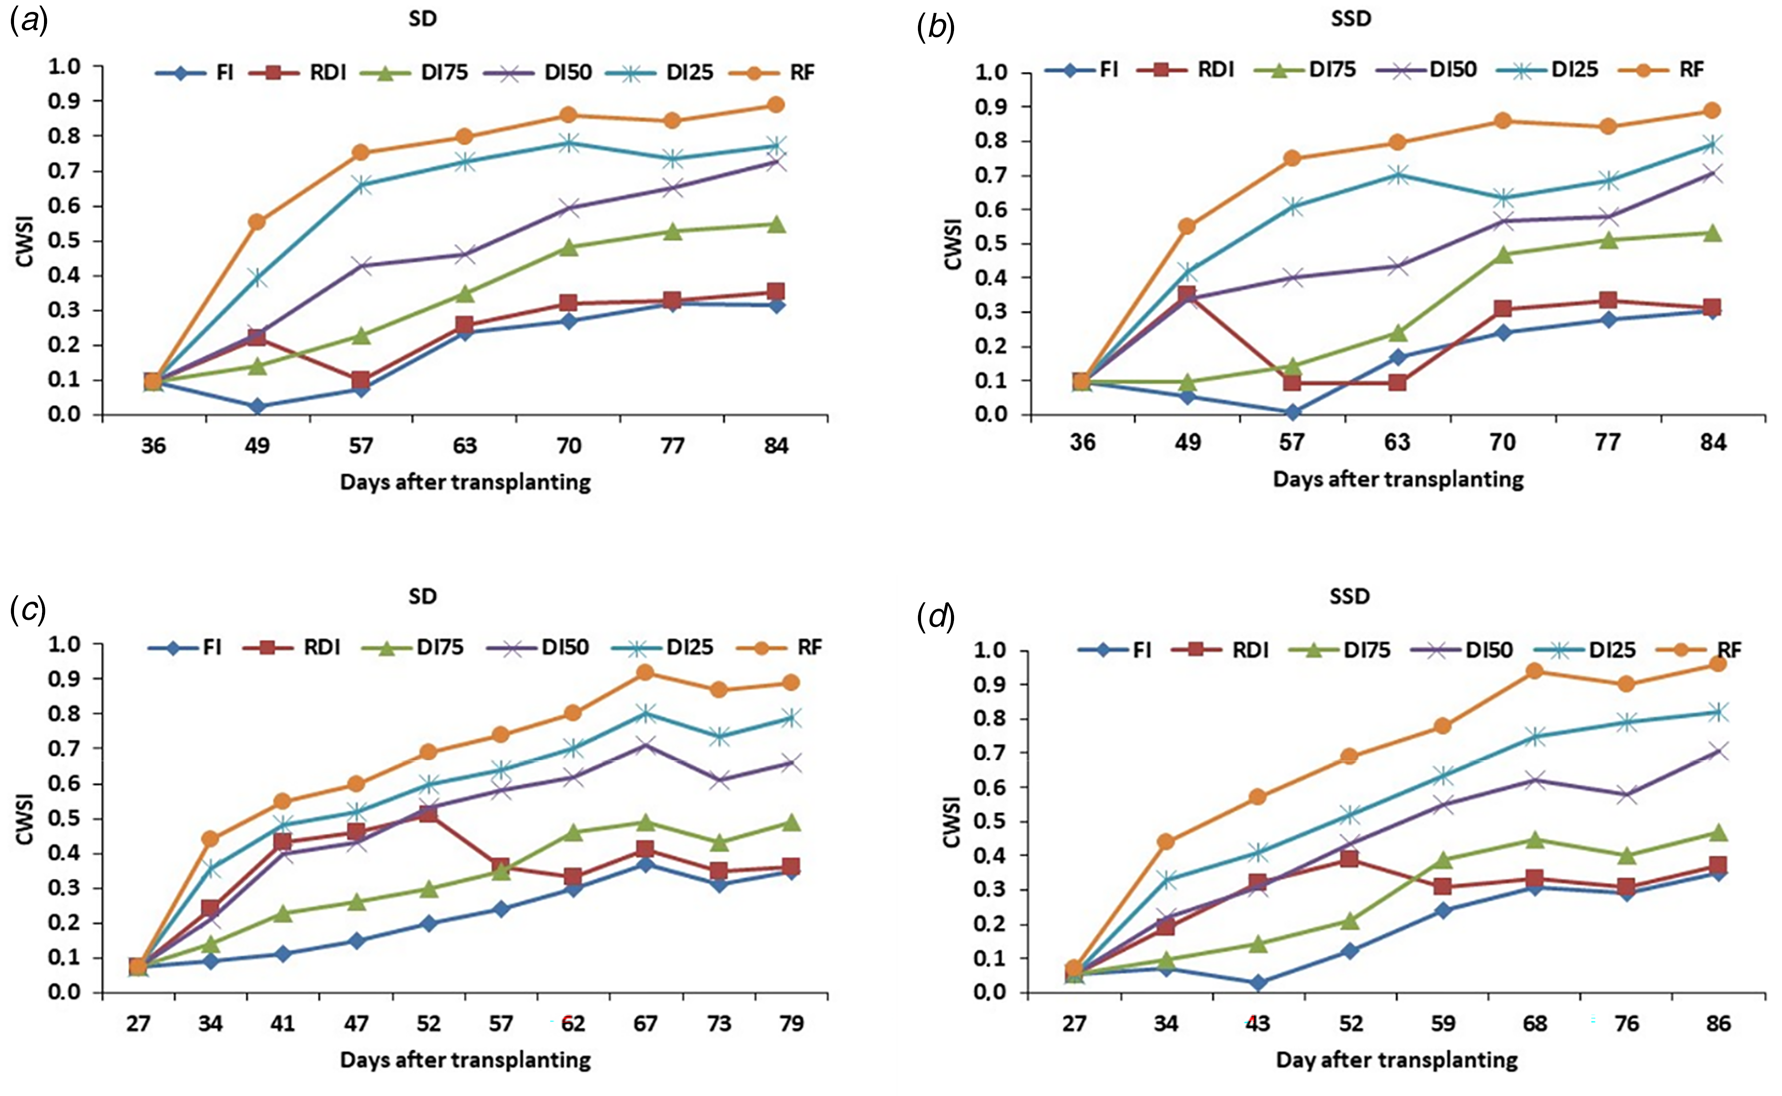
Figure 4. CWSI variation during the 2019 and 2020 amaranth growing seasons in all treatments under SD and SSD irrigation: (a) CWSI in SD in 2019; (b) CWSI in SSD in 2019; (c) CWSI in SD in 2020; (d) CWSI in SSD in 2020. SWC, soil water content; FC, field capacity; WP, wilting point; SD, surface drip irrigation; SSD, subsurface drip irrigation; FI, full irrigation; RDI, regulated deficit irrigation; DI75, 75% deficit irrigation; DI50, 50% deficit irrigation; DI25, 25% deficit irrigation; RF: rainfed.
Relationships between LWP, grain yield, ETa, DM yield and LAI
The curvilinear correlations between LWP (the independent variable) and grain production, ETa, DM yield and LAI (the dependent variable) in the experimental years are shown in Figs 5(a)–(d) and 6(a)–(d). Overall, there was a significant (P < 0.01) positive correlation between LWP and grain yield, ETa, DM yield and LAI, which means that as LWP values decreased, these four variables also decreased. Strong second-order polynomial equations with high R 2 values best characterize all these relationships. During the growing seasons, the R 2 values for SD and SSD in the first- and second-growing seasons were 0.95 and 0.95, respectively; for the relationship between LWP and grain yield, the comparable values for SSD were R 2 = 0.96 and 0.95. For LWP with DM, LAI and ETa, the coefficients of determination were all above 0.94.
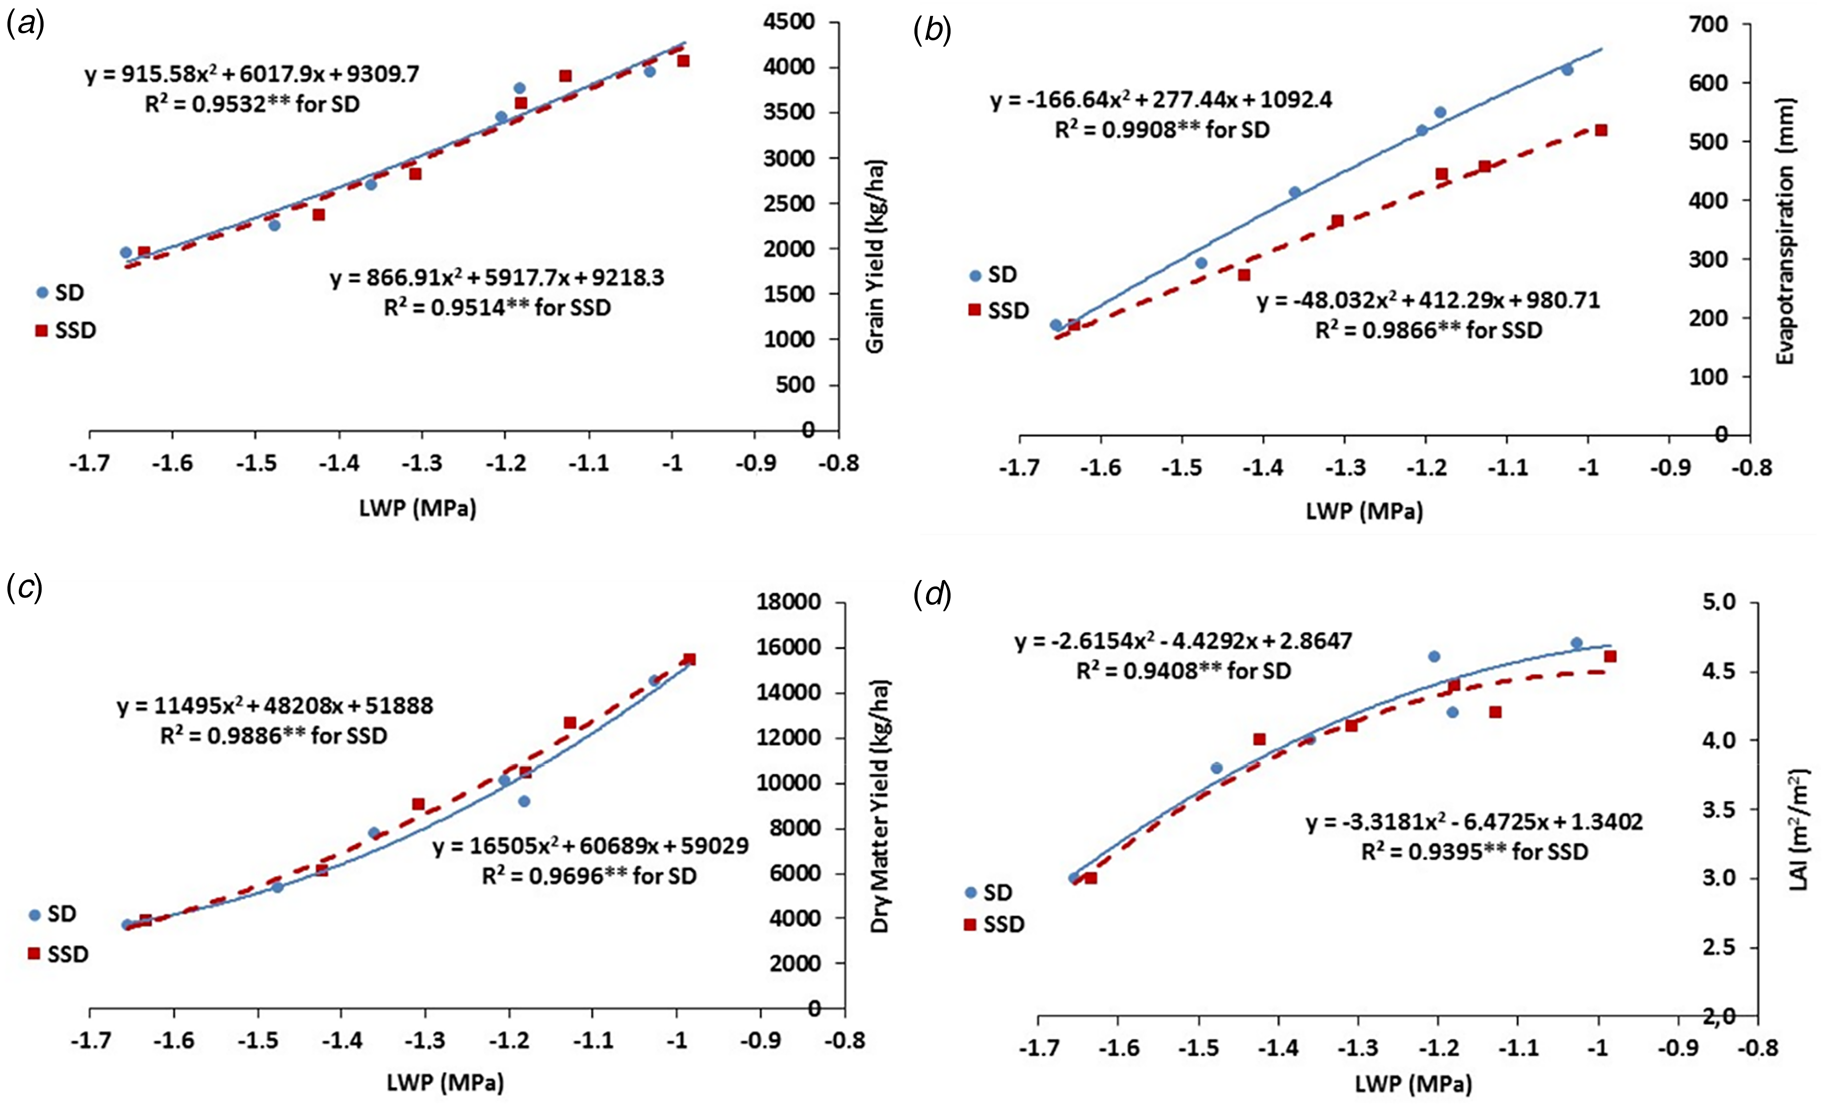
Figure 5. Relationships between LWP and yield (a), ETa (b), DM yield (c) and maximum LAI (d) in the 2019 growing season. SD, surface drip irrigation; SSD, subsurface drip irrigation.
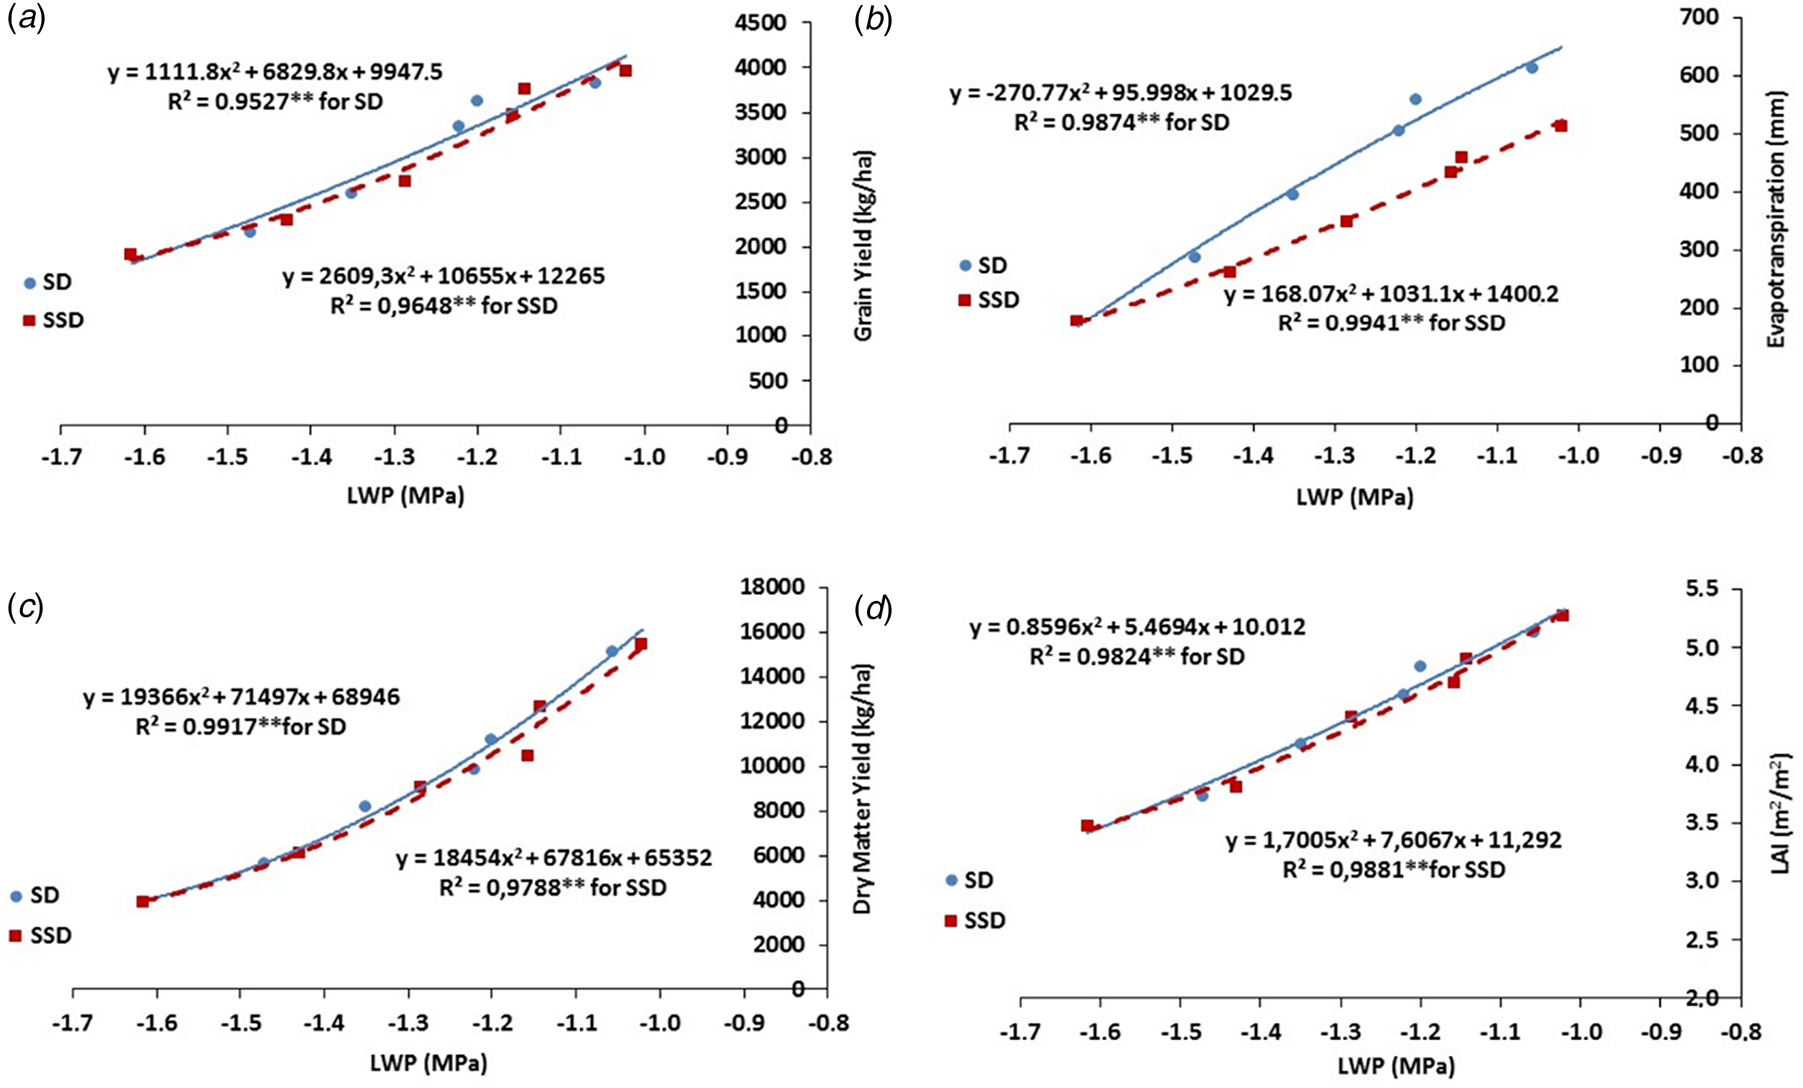
Figure 6. Relationships between LWP and yield (a), ETa (b), DM yield (c) and maximum LAI (d) in the 2020 growing season. SD, surface drip irrigation; SSD, subsurface drip irrigation.
Relationships between CWSI, grain yield, DM yield, LAI and ETa
Figures 7(a)–(d) and 8(a)–(d) show the correlations between CWSI (the independent variable) and grain yield, ETa, DM yield and maximum LAI (the dependent variable) in the experimental years. Overall, there was a significant (P < 0.01) negative correlation between CWSI and DM yield, grain yield, ETa and LAI, indicating that grain yield of amaranth decreased when CWSI values increased. Second-order polynomial equations are best to describe all these relationships. In the first- and second-growing seasons, the correlation between CWSI and grain yield was found to have good coefficients of determination with R 2 = 0.99 for SD and 0.99 for SSD; the corresponding values were R 2 = 0.96 and 0.98, respectively. In the experimental years, the coefficients of determination of CWSI with DM, LAI and ETa were all greater than 0.86.

Figure 7. Relationships between CWSI and yield (a), ETa (b), DM yield (c) and maximum LAI (d) in the 2019 growing season. SD, surface drip irrigation; SSD, subsurface drip irrigation.
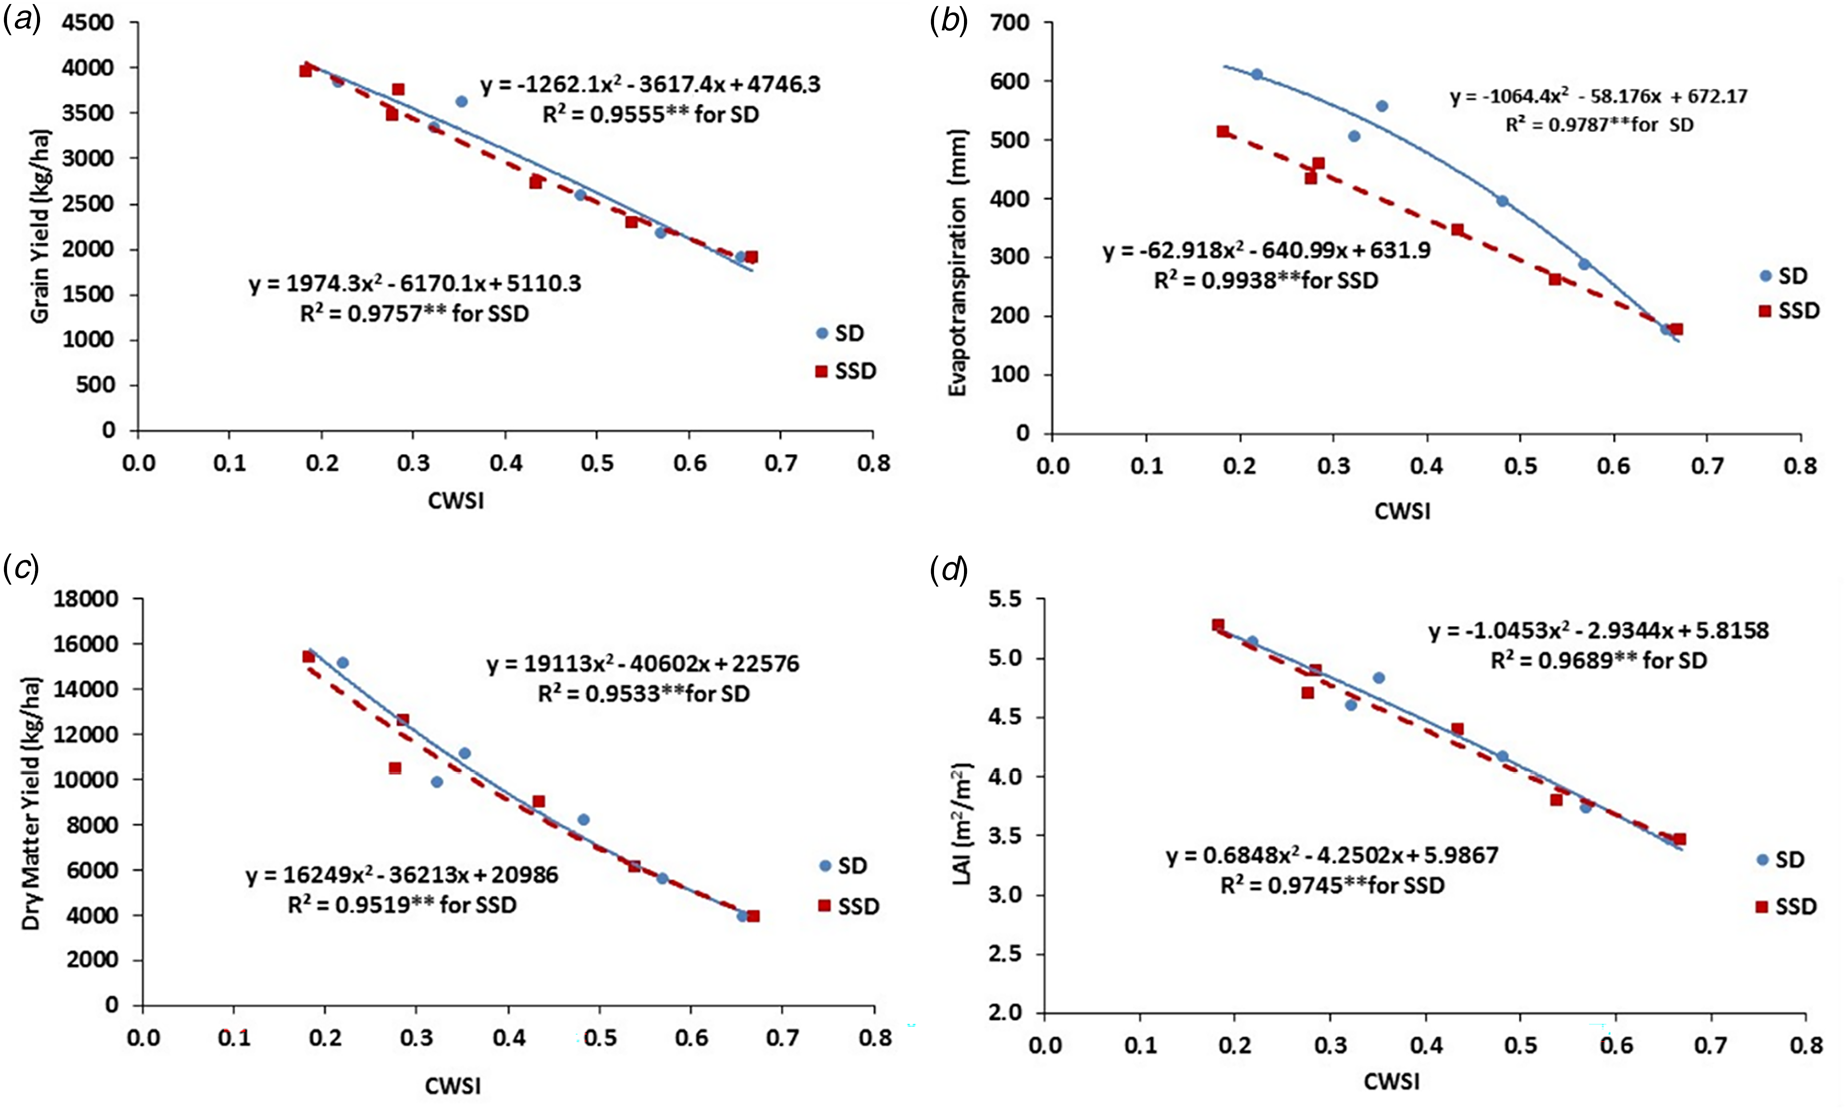
Figure 8. Relationships between CWSI and yield (a), ETa (b), DM yield (c) and maximum LAI (d) in the 2020 growing season. SD, surface drip irrigation; SSD, subsurface drip irrigation.
Relationships between CWSI and LWP
Figures 9(a) and (b) show the correlations between CWSI and LWP for the different treatments under SSD and SD systems in the experimental years. With high coefficients of determination of R 2 = 0.96 for SD and 0.98 for SSD in 2019 and the corresponding values of 0.99 and 0.98 for SD and SSD plots in 2020, significant second-order polynomial relationships were found between CWSI and LWP for the drip systems. These relationships can be used for amaranth irrigation scheduling.

Figure 9. Relationships between CWSI and LWP in the 2019–20 growing season in all treatments: (a) 2019 and (b) 2020. SD, surface drip irrigation; SSD, subsurface drip irrigation.
Water productivity and irrigation water productivity
Table 3 shows the IWP and WP for different treatments under SD and SSD systems in the experimental years. Statistical assessment of the results for WP and IWP according to the combined variance analysis results was carried out (Table 4). In the 2019 growing season, the FI had the lowest WP, while the RF and DI25 treatments had significantly higher WP values than the other treatments. In the first year, WP values varied from 0.63 in FI to 0.77 in DI25 under SD; and changed between 0.77 in DI50 and 0.87 in DI25 under SSD. In the second year, WP increased from 0.63 kg/m3 in FI to 0.76 kg/m3 in DI25 under SD and WP values varied from 0.77 in FI to 1.30 in DI25 under SSD. RF resulted in higher WP values of 1.04 in the first year and produced 1.08 in the second year. The interaction between irrigation systems and regimes was statistically significant at the level (P < 0.01) based on statistical analysis of IWP values in both experimental years under SD treatments.
IWP values varied from 0.18 kg/m3 in DI25 to 0.44 kg/m3 in RDI and, under SSD, IWP values changed from 0.30 kg/m3 in DI25 to 0.56 kg/m3 in RDI. In the second year, IWP values varied from 0.24 kg/m3 in DI25 to 0.51 kg/m3 in RDI in SSD; they also varied between 0.13 kg/m3 in DI25 and 0.38 kg/m3 in RDI under SD treatments. IWP values were highest in RDI and lowest in DI25 found. There is no significant difference in IWP values between the two drip systems. The interaction between irrigation systems and irrigation regimes was found to be statistically insignificant.
Economic analyses
In 2019, net income varied between 4.50 and 12.00 USD/ha in the SD irrigation system for different irrigation treatments, based on the results of the economic analysis, which includes investment, operation and production costs. Among the different irrigation levels, FI had the highest net income of 12.00 USD/ha, followed by RDI at 11.06 USD/ha. Treatments with SSD irrigation resulted in net benefit values ranging from 4.50 to 12.05 USD/ha. Among the different irrigation levels, the highest net income for FI was recorded at 12.05 USD/ha, while RDI was second at 1.11 USD/ha. For RF without irrigation, a net income of 3.13 USD/ha was achieved. According to the results of the economic analysis the net income for different irrigation treatments varied between 4.64 and 12.75 USD/ha for SD irrigation in the 2020 year of the trial. Under various irrigation treatments, FI had the highest net income of 12.75 USD/ha, followed by RDI's 11.89 USD/ha. Treatments with SSD irrigation ranged from 5.30 to 13.44 USD/ha. At various irrigation levels, FI had the highest net income of 13.44 USD/ha, followed by RDI's 12.71 USD/ha. For non-irrigation RF, a net income of 3.73 USD/ha was achieved in 2020. Over the research years, net income decreased as the amount of irrigation was reduced.
The economic analysis led to the derivation of marginal yields from FI for both irrigation techniques. In comparison, SSD irrigation methods achieved higher net income than SD irrigation methods. After FI, high net incomes were calculated for the DI75 and RDI treatments. A decrease in irrigation water resulted in a decrease in marginal income values. These factors make RDI and DI75 treatments a viable substitute for the FI under Mediterranean climatic conditions.
Discussion
In regions where water is scarce, assessing the potential of new crops requires an understanding of water use. Although considered a drought-tolerant crop, grain amaranth plants showed a significant response when exposed to water stress during the growing season (Table 3). The results of the study showed that grain and DM production decreased with increasing moisture stress. Irrigation with a water deficit led to a lower grain yield than FI. The higher the water stress, as in the case of DI25 and non-irrigated RF cropping, the higher the yield losses. Compared to the FI treatment, the average yield reductions over 2 years ranged from 5% for RDI to 60% for DI25. Drought stress during flowering seed formation and grain filling as in DI25 and DI50 as well as RF, had a negative effect on grain yield. As the degree of water stress decreased the yield reductions are also reduced. FI under both the drip systems produced the highest grain yield, followed by RDI, where irrigation was reduced by 50% during the vegetative growth stage until flowering and then fully irrigated until physiological maturity. The DI75 treatment produced higher grain yields than the DI50 and DI25 treatments, but lower than the FI and RDI treatments in both the drip systems in the experimental years. This could be due to the fact that the higher values of yield attributes resulted in larger seeds and better seed formation under adequate moisture conditions, which improved assimilate transfer from source to sink (seed). As a result, larger seeds were acquired, ultimately leading to higher grain and DM yields. The SSD system generally resulted in statistically higher grain yields than the SD system (P < 0.01) (Table 3). Irrigation of FI in the SSD system used 18% less water than FI in the SD system. The RDI treatment resulted in a yield reduction of about 5% compared to the FI treatment, with both the drip systems saving 15% irrigation water, while the DI75 treatment resulted in a 12% lower grain yield compared to the FI treatment, leading to a water saving of 23%. From these results it can be concluded that both RDI and DI75 could be good alternatives to FI under the conditions of water scarcity in the Mediterranean region.
It is well known that water deficit is one of the most important abiotic stress factors for plants, as it hinders plant development and photosynthetic processes (Cechin and Valquilha, Reference Cechin and Valquilha2019). FI under SSD produced significantly higher DM yield than the other treatments, followed by FI under SD plots. DI75 under SSD resulted in significantly higher DM yield in the first year compared to surface RDI, DI75, DI50 and DI25 treatments. RDI under SSD resulted in higher DM yield than RDI under SSD in the first year, and vice versa in the second year. RF produced the lowest DM yield in all experimental years. The DM yield in the RF treatment was only 25% of the DM yield in the FI under SSD. The treatments with DI led to a significant reduction in the DM yield of the above-ground part of the plants. DM yield reduction was 31 and 37% in DI75 and RDI under SD, respectively, and the corresponding values were 22 and 39% for DI75 and RDI under SSD in the first year. The corresponding values for DM yield reduction in the second year were 28 and 36% for RDI and DI75 under SD, and 18 and 32% for RDI and DI75 under SSD in the second year. In general DM yield increased with the amount of irrigation water. Compared to the RDI, DI75 and FI treatments, the RF, DI50 and DI25 treatments had reduced DM yields due to water stress. In contrast to other treatments, FI produced higher DM yields. This could be due to remarkable improvements in yield qualities, such as the primary inflorescence length, as well as better development of various growth traits, such as plant height, number of leaves per plant and DM accumulation. The results support the findings of Patel et al. (Reference Patel, Patel, Patel, Patel, Patel and Patel2012), Keraliya et al. (Reference Keraliya, Desai, Patel and Kanara2017) and Parmar and Patel (Reference Parmar and Patel2009).
Sustainability in agriculture increasingly depends on reducing water use for irrigation and increasing water-use efficiency and WP without compromising production (Molden et al., Reference Molden, Oweis, Steduto, Bindraban, Hanjra and Kijne2010). According to the WP values of the study, FI had the lowest WP value in 2019, while the RF and DI25 treatments produced the highest WP value. Among the two drip systems, the DI25 treatment had the highest WP value in 2020, while FI had the lowest WP value. Similar grain yields in the second year, but comparatively lower ET values, resulted in higher WP values. The WP values found under the SSD system were significantly higher than those under the SD plots.
The water status of the plants varied between treatments due to differences in water supply. Interestingly, there was a considerable difference between the water statuses of the plants as determined by LWP. In both the drip systems, the FI treatment plots had higher LWP values than the plots with DI. The LWP values generally decreased as the water stress increased. The lowest LWP values were found in the RF plots. The LWP values in RF were −1.65 MPa in the first year and −1.62 MPa in the second year. In both the drip systems, the FI treatment plots showed higher LWP values than the plots with DI. The LWP values in the SSD plots were slightly higher than the SD plots, but there was no statistically significant difference between the two irrigation systems. The LWP values generally decreased as the season progressed in contrast to the values at the beginning of the season. The leaves suffered from shortage of water due to the increasing water deficit in the soil, and the LWP decrease. According to Ommami and Hammes (Reference Ommami and Hammes2006), salt stress, water stress or salt + water stress may lead to gradual decline in LWP. Eight days after transplanting, LWP decreased by −0.5 to −0.8 MPa in amaranth variety Amaranthus tricolor and by −0.4 to −0.7 MPa in the amaranth variety Amaranthus cruentus at the end of the first stress cycle. In the second stress cycle, there was a significant (P = 0.05) decrease in LWP, and on the last day of the experiment, plants under water stress showed the lowest values (−1.9 MPa for A. cruentus and −2.2 MPa for A. tricolor). In well-watered and drought-stressed plants, mid-day LWP, leaf osmotic potential and relative water content were monitored during soil drying until all soil water available for uptake was consumed. According to the evaluation of the LWP of four different amaranth species by Liu and Stützel (Reference Liu and Stützel2002), the LWP of the control plants was between −0.4 and −0.9 MPa during the entire experiment. According to our results, irrigation had a major effect on the water status of the amaranth plant as measured by LWP, while water stress had a modest effect on LWP.
Although amaranth is considered drought resistant, it can suffer from water stress. The results of the 2-year trial showed that CWSI values increased with increasing water stress. Higher values were found in DI25 and RF, while the lowest CWSI values were found in FI and followed by RDI and DI75 for both irrigation systems. The amplitude of the fluctuations also increased with increasing water stress. During the growing seasons, CWSI values under the SSD and SD systems fluctuated consistently before irrigation, but generally in a fairly similar way. CWSI values were lower at the beginning of the season and increased as the season progressed. When scheduling irrigations for amaranth, an average CWSI value of about 0.25 should be used to ensure high yields. Significant second-order polynomial relationships with high coefficients of determination between CWSI and LWP were found for the drip systems. These relationships can be used for amaranth irrigation scheduling.
Conclusion
The effects of irrigation treatments were significant not only on CWSI and LWP, but also on grain and DM production. The FI treatments under SSD systems had the highest grain production, followed by FI under SD and RDI under both the drip systems. Under SD and SSD systems, RDI saved 23 and 21% water, respectively, and produced a yield statistically comparable to that of FI. In both the drip irrigation systems, the FI plots had lower values of the CWSI and higher values for LWP compared to the DI plots. With increasing drought, the LAI, LWP and CWSI decreased. The study revealed a significant (P < 0.01) negative correlation between CWSI and mean SWC, DM yield, grain yield and LAI. This suggests that as CWSI values increased, grain yield of amaranth decreased. The results show that, amaranth should be irrigated at an LWP value of 1.0 MPa and an average CWSI value of about 0.25 for maximum grain yields.
Author contributions
Conceptualization: E. G., Y. B. Ç. and A. Y.; methodology: E. G. and Y. B. Ç.; formal analysis: E. G., Y. B. Ç. and M. O.; investigation: E. G., Y. B. Ç. and M. O.; resources: E. G.; data curation: E. G., Y. B. Ç. and M. O.; writing – original draft preparation: E. G., Y. B. Ç. and A. Y.; writing – review and editing: A. Y., Y. B. Ç. and E. G.; supervision: Ç. T.; project administration: E. G.; funding acquisition: E. G. All authors have read and agreed to the published version of the manuscript.
Funding statement
The authors acknowledge the Turkish Scientific and Technical Research Council (TUBITAK) for its financial support for the project TUBITAK 1001-118O832.
Competing interests
None.


