Excess abdominal fat is associated with increased mortality and risk of diabetes, hyperlipidaemia, hypertension and atherosclerosis(Reference Wajchenberg, Giannella-Neto and da Silva1). Abdominal fat is composed of both subcutaneous and visceral fat. The detrimental influence of abdominal obesity on metabolic processes seems to be mediated by the visceral adipose tissue (VAT) depot, although there is some debate on the role of subcutaneous adipose tissue in these abnormalities, specifically the deep subcutaneous layers(Reference Wajchenberg, Giannella-Neto and da Silva1, Reference Kelley, Thaete and Troost2).
Factors that influence VAT have not been clearly defined in young adult populations(Reference Hoffman, Policastro and Quick3, Reference Anderson, Shapiro and Lundgren4). Sex, genetics and sex hormones appear to play a role in the preferential deposition of VAT(Reference Katzmarzyk, Perusse and Bouchard5, Reference Lemieux, Pascot and Lamarche6). Physical activity may also play a role in VAT accumulation, especially in men(Reference Abe, Sakurai and Kurata7, Reference Riechman, Schoen and Weissfeld8). While diet plays an obvious role in the accumulation of VAT, the complete role of diet on VAT has not been well described. Studies indicate that there is a positive relationship between energy consumption and VAT, but not all studies demonstrate a strong relationship(Reference Bouchard, Despres and Mauriege9, Reference Bouchard, Tremblay and Despres10). Less is known about other components of the diet including macronutrient and micronutrient composition. The purpose of the present study was to examine the relationship between diet and VAT area in overweight young adults.
Methods
Design
This is a cross-sectional study using baseline data from participants who were originally recruited for the Midwest Exercise Trial(Reference Donnelly, Hill and Jacobsen11). There were four cohorts of participant that took part in the Midwest Exercise Trial. The time between cohorts was roughly 6 months between cohorts 1 and 2, 18 months between cohorts 2 and 3 and 12 months between cohorts 3 and 4. Participants were included in the study once and were not allowed to take part in subsequent cohorts.
Participants
Participants were aged between 17 and 35 years, sedentary, did not exceed 2093 kJ (500 kcal) of physical activity per week, and had a BMI between 25·0 and 34·9 kg/m2(Reference Blair, Haskell and Ho12). Participants were healthy with no history of chronic disease. Additionally, all participants met or exceeded the 85th percentile for triceps skinfold thickness of the Second National Health and Nutrition Examination Survey. This measurement helped to eliminate subjects who were short and muscular rather than overweight. The present study was conducted according to the guidelines laid down in the Declaration of Helsinki and all procedures involving human participants were approved by the Institutional Review Board of the University. Written informed consent was obtained from all participants.
Assessments
Body weight and composition
Body weight was measured using a digital scale accurate to within 0·1 kg. Body composition was estimated by hydrostatic weighing using measured residual volume(Reference Donnelly, Hill and Jacobsen11). VAT area was determined using computed tomography (CT) at the L4-5 vertebral space. The CT examinations were performed using a CTi scanner (General Electric, Waukashau, WI, USA) at the University of Colorado Hospital (Denver, CO, USA)(Reference Donnelly, Hill and Jacobsen11).
Energy intake and diet composition
Diet intake was ad libitum and was assessed for 14 d in the university cafeteria. All food and beverages consumed in the cafeteria were measured using observer-recorded weighed plate waste(Reference Hise, Sullivan and Jacobsen13). Food consumption outside the cafeteria was assessed by multiple-pass 24 h diet recall procedures(Reference Hise, Sullivan and Jacobsen13). This method of evaluating dietary intake was validated against doubly labelled water in fifty-two of the participants in the present study. Results from this validation showed that the participants were in energy balance during the assessment period(Reference Hise, Sullivan and Jacobsen13).
The cafeteria featured a food court where different stations offered specialised items such as stir-fry, pasta, salads, sandwiches, pizza and grilled foods. Participants could typically choose from between eight and ten entrées at each meal. The cafeteria was open for a total of 9·5 h on weekdays and 5·5 h (brunch and dinner) on the weekends.
Results from the plate waste and from diet recalls were entered into a computerised nutrition database for analysis (Food Processor, version 7.1; ESHA Research, Salem, OR, USA).
Data analysis
Means and standard deviations were calculated for all independent and dependent variables. Stepwise regression was used to determine the best model for predicting visceral and subcutaneous adiposity for men and women. Variables included in the stepwise regression included total energy intake, dietary fat, dietary protein, dietary carbohydrate, saturated fat, Fe, vitamin A, folic acid, dietary fibre, Ca, alcohol, and Ca:protein ratio. Pearson product moment correlations were calculated to determine the relationship between diet components and VAT or subcutaneous adipose tissue. Independent t tests were used to determine differences between the sexes in descriptive and dietary variables. Significance was set at P < 0·05. Statistical analysis was performed using SAS (version 8.2; SAS Institute, Inc., Cary, NC, USA).
Results
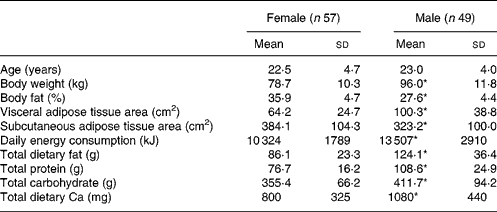
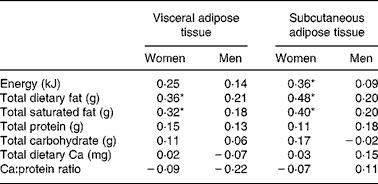
Descriptive characteristics of the participants in the study are reported in Table 1. In general, men were heavier than women and had more lean tissue and less fat tissue (P < 0·05). Men had a higher VAT area, while women had a higher subcutaneous adipose tissue area (P < 0·05). Diet intake of the participants is reported in Table 2. Men consumed more energy and a greater percentage of the energy was from fat (34·6 v. 31·4 %) and protein (13·7 v. 12·4 %), while women consumed a greater percentage of their energy from carbohydrate (57·6 v. 51 %). In general, men consumed more Ca but had a similar Ca:protein ratio compared with women.
Table 1 Demographic information by sex
(Mean values and standard deviations)

* Mean value was significantly different from that of the females (P ≤ 0·05).
Table 2 Pearson correlations (r) of nutrients and visceral adiposity

* P ≤ 0·05.
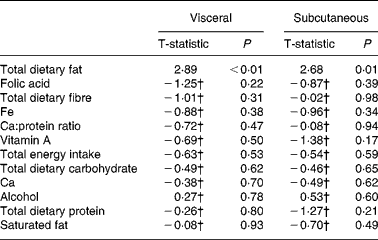
Stepwise regression demonstrated that total dietary fat was the best predictor of both VAT and subcutaneous adipose tissue area (r 0·36 and r 0·48; P < 0·05) in women (see Table 3). Saturated fat was similarly associated with both VAT and subcutaneous adipose tissue area in women (r 0·32 and r 0·40; P < 0·05), while total energy intake only predicted subcutaneous adipose tissue area (r 0·36; P < 0·05).
Table 3 Stepwise summary table: dietary predictors of visceral and subcutaneous fat in women

† Variables that did not enter the model with total dietary fat.
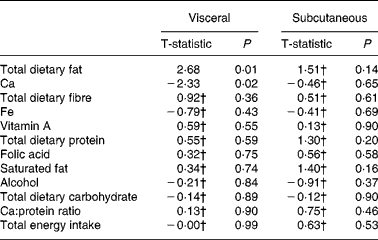
There was no single dietary component that predicted VAT area or subcutaneous adipose tissue area in men. Stepwise regression demonstrated that total dietary fat and Ca consumption in combination predicted VAT area (r 0·36; P < 0·05) in men (see Table 4).
Table 4 Stepwise summary table: dietary predictors of visceral and subcutaneous fat in men

† Variables that did not enter the model with total dietary fat and Ca.
Discussion
Total dietary fat predicted VAT in women but did not independently predict VAT in men. While dietary fat did not independently predict VAT in men, a synergistic relationship was observed between dietary fat consumption and Ca intake. If fat intake was similar, men who consumed more Ca had a lower VAT area.
Cross-sectional studies are generally in agreement that dietary fat is associated with excess body weight(Reference Lissner and Heitmann14). Less is known about the relationship between dietary fat and VAT. Greenfield et al. demonstrated a relationship between dietary fat and weight in adult women but failed to show a relationship with VAT(Reference Greenfield, Samaras and Jenkins15). It is unclear why there is a lack of agreement between these findings and the findings from the present study. It could be the result of methodological differences in assessing diet and VAT between the studies. In the Greenfield study, diet was assessed using the Oxford FFQ and VAT was assessed using dual-energy X-ray absorptiometry. These measurements may lack the precision necessary to determine the relationship between dietary fat and VAT.
In contrast, Dutia et al. in a published abstract showed a positive relationship between MUFA consumption and VAT accumulation in sedentary men and women(Reference Dutia, Wrobleski and Bacher16). Diet was measured using a 3 d food record and VAT was assessed using MRI. Based on the abstract, it is unclear if there were any sex differences or what nutrients were examined in addition to MUFA. The findings from the present study seem to support the role of fat consumption in the accumulation of VAT.
In addition to dietary fat, there is a growing body of literature demonstrating a negative association between increased Ca consumption and adiposity. The impact of Ca on adiposity may be especially important for visceral adiposity, since visceral fat is more metabolically active and sensitive to lipolysis than other adipose tissue(Reference Wajchenberg, Giannella-Neto and da Silva1). It has been reported that increasing dietary Ca accelerates weight and fat loss in energy restricted obese adults, with preferential loss of trunk fat as measured by dual-energy X-ray absorptiometry(Reference Zemel, Thompson and Milstead17). It has been further shown that elevated Ca consumption alters plasma 1,25-dihydroxyvitamin D3, which in turn alters local cortisol levels that may have an impact on the preferential loss of visceral adiposity(Reference Morris and Zemel18).
The influence of Ca on VAT for men is consistent with the proposed mechanism. It is not clear why this same effect was not seen in women. In general, women have a lower VAT area and it seems to be less metabolically active than in men(Reference Wajchenberg, Giannella-Neto and da Silva1, Reference Bouchard, Despres and Mauriege9). This is specifically true for the population of women in the present study, who were all young adults and less prone to deposit fat in the viscera. It has also been observed in another study in women of a similar age that Ca consumption was related to total body fat in participants who consumed less than 7853 kJ, but not in women who consumed more than 7853 kJ(Reference Lin, Lyle and McCabe19). Only six women in the present study consumed less than 7853 kJ/d and this could be one of the reasons why no relationship was observed in women. In addition, Ca consumption was 800 (sd 325) mg in women, which is below the recommended intake and was roughly 280 mg lower than men in the study. This level of Ca consumption may be too low to influence fat metabolism and the accumulation of VAT in these women.
There are some limitations that should be considered when interpreting the results of the present study. It should be pointed out that the data available for this investigation did not include MUFA or PUFA. These dietary components may have an impact on VAT and deserve future consideration. In addition, because of the cross-sectional nature of the present investigation, causation cannot be established and caution should be taken in drawing conclusions from the data presented. Finally, because the dietary assessment took place in the cafeteria it is impossible to be sure that dietary patterns remained consistent with patterns established under normal eating conditions. While this is a limitation, the dietary assessment methodology employed in the study directly measured food intake over 14 d and results from fifty-two of the participants demonstrated that they were in energy balance during the dietary assessment period when compared with doubly labelled water(Reference Hise, Sullivan and Jacobsen13).
Conclusion
Total dietary fat is the best predictor of VAT area in both men and women. While this relationship was independent in women, in men there was a synergistic relationship between dietary fat consumption and Ca consumption in predicting VAT.
Acknowledgements
The present study was supported by grant NIHDK49181 from the National Institute of Diabetes and Digestive and Kidney Diseases and by grant M01 RR0051 from the Clinical Research Center of the University of Colorado Health Sciences Center.
The institution where the present study was performed at is the University of Kansas, Energy Balance Laboratory (Lawrence, KS, USA).
B. W. B. was the primary author of the manuscript and participated in all aspects of the study. D. K. S. served as the study dietitian and assisted in the collection and analysis of data, as well as the writing of the manuscript. E. P. K. assisted in data collection and database management, and helped write the methods and proofed the entire paper. J. E. D. was responsible for acquiring the initial funding for this project and also was involved in running the study and writing the manuscript.
There are no conflicts of interest.


