Introduction
The dominant economic growth model in East and Southeast Asia has been of low-wage exports supported by large supplies of low-skilled workers. This growth model has led to high growth rates, a growing middle class in many countries and, at first glance, a strong decline in poverty. These outcomes have allowed some countries such as Indonesia to transit to ‘middle-income country’ status. But the rates of economic growth have not been matched by rates of job creation – typically 6%–7% growth rates have led to only 1%–2% rates of employment growth. The unemployment rates continue to remain relatively low because of the lack of social protection measures: arguably, many workers are at best in ‘disguised unemployment’ in the informal and agricultural sectors. Furthermore, where employment has grown, its quality has been in question – most of it in the low-income informal segments, characterised by poor working conditions, lack of job security, lack of social safety nets for those who become unemployed and limited to no prospects for receiving a retirement pension. Thus, poor job quality has contributed to a rise in income inequality in a number of Asian countries (Reference Kanbur, Rhee and ZhuangKanbur et al., 2014).
These observed dynamics hold true for Indonesia. The gap between the growth of gross domestic product (GDP) and employment growth after the late 1990s Asian Financial Crisis (AFC) was larger than the corresponding gap during the pre-crisis era of the New Order economy (Reference Dhanani, Islam and ChowdhuryDhanani et al., 2009). Additionally, the post-AFC reduction in the unemployment rate was not followed by a comparable improvement in the quality of employment, as the size of the formally employed workforce remained relatively stagnant despite a continuous decline in the unemployment rate (Reference TadjoeddinTadjoeddin, 2014a). Furthermore, there is an early indication that earning levels did not keep pace with growth in either GDP or labour productivity (Reference TadjoeddinTadjoeddin, 2015). Earnings are defined here to include the wages and incomes of self-employed workers, regular waged employees and casual workers, while labour productivity is defined as GDP per employed population.Footnote 1
Wage/earning levels are central to the efficient operation of the labour market as they signify the price of labour. They are also closely linked to social welfare and equality, being the most important source of income for the majority of people. Following mainstream economic theory, wages should follow productivity; in other words, the marginal productivity of labour determines its price. However, a predominant trend identified in countries around the world, including many in East and Southeast Asia, has been the de-linking between earning growth and productivity growth – Indonesia is not an exception (International Labour Organization (ILO), 2015).
This article argues that the declining income share of labour, or declining wage–productivity ratio, could help explain the continuous rise in economic inequality in Indonesia since the late 1990s Asian crisis. The level of economic inequality has been rising sharply since the lowest level in 2000 after the AFC. Between 2000 and 2013, the Gini index of expenditure inequality increased by 32% and is now at the record high of 0.41, while according to the Palma index, inequality has increased by 66% (Reference YusufYusuf, 2014).Footnote 2 The rise in inequality and declining income share of labour, however, are not unique in Indonesia; this has been a global trend attracting worldwide concerns (ILO, 2015). Rising inequality not only undermines social justice objectives but can also have adverse economic consequences, as shown in recent research, especially at the International Monetary Fund (Reference Dabla-Norris, Kochhar and RickaDabla-Norris et al., 2015). The sharp rise in inequality amid democratisation and decentralisation reform is against public expectations, and such unfulfilled public expectations can be socially explosive (Reference Tadjoeddin, Yumna and GultomTadjoeddin et al., 2016). Economic growth with rising inequality can be defined as non-quality growth.
Previous studies on earnings in Indonesia have tended to focus on wage and income determinants. Reference Comola and De MelloComola and De Mello (2013) concentrate on explaining the effect of individual characteristics on earnings of salaried workers only in a single 2004 Sakernas (the National Labour Force Survey).Footnote 3 Reference PirmanaPirmana (2006) used four waves of Sakernas between 1996 and 2004 to estimate earning differentials among groups of workers. Others studies have focused on the impact of minimum wage on earnings and employment. Using firm-level data during 1993–2006, Reference Del Carpio, Nguyen and WangDel Carpio et al. (2012) found a positive and significant association between minimum wages and actual wages, but the magnitude of the association was larger for small firms and less so in larger firms. Utilising the Indonesian Family Life Survey (IFLS) data, Reference Chun and KhorChun and Khor (2010) found that higher minimum wages were significantly correlated with higher wages for the population earning less than the minimum wages in the formal sector. Using a panel of Sakernas data from 1988 to 2000, Social Monitoring and Early Response Unit (SMERU, 2001) found a statistically insignificant positive effect of minimum wage on average wages. This study is different from these previous studies on earnings or wages as it concerns earnings inequality and macro relationships among earnings, productivity and employment across economic sectors during 2001–2012.
This article links the widening wage–productivity gap with rising inequality and then argues that a positive effect of productivity on wages would eventually lead to expanding employment through a simultaneous equation model. The rest of the article proceeds as follows. To set the overall scene, section ‘Trends in real wage-earning’ highlights the trend of real earnings across economic sectors and employment status. Section ‘Earnings and productivity’ examines the gap between earning and productivity and its trend over time, showing a case for de-linking between earning and productivity in the post-crisis Indonesia. The following three sections (‘Wage-earning inequality’, ‘Employment function’ and ‘ The quality of growth’) discuss the consequences of this de-linking between earnings and productivity with regard to rising earning inequality, the relationship between real wages and employment and the quality of growth. A conclusion is offered in the last section. Overall, the article finds that the de-linking between productivity and wages could explain the rising inequality, the negative association between wages and employment and the low-quality growth. As a consequence, making sure of the alignment between rising productivity and rising wages is an important prerequisite for dealing with inequality, expanding employment and achieving high-quality growth.
Trends in real wage-earning
Wage-earning is taken in this study to refer to net wage/income earned by the following employment categories: (1) self-employed, (4) regular waged employees and (5 and 6) casual workers in agriculture and non-agriculture.Footnote 4 The four employment categories accounted for 63% of total employment in 2012 (Table 1). The National Labour Force Survey (Sakernas) does not collect earning data for the remaining three employment statuses: (2) self-employed assisted by casual/unpaid family workers, (3) employers and (7) unpaid family workers. The ordering number of the employment statuses follows the Sakernas’ order. This would allow for generating the overall figure of earning as well as disaggregated figures across the four employment categories.
Table 1. Employment status, 2001 and 2012 (%).

Source: Calculated from the Sakernas (National Labour Force Survey).
It is interesting to note an increase in the share of regular waged employees, while the shares of other employment categories either declined or remained constant. Despite the increase, however, other indicators reflecting the quality of employment did not equally improve.
Real wage-earnings in post-crisis, democratic and decentralised Indonesia are, at best, stagnant if not declining. Average real earnings increased in the early and later part of this period, namely, 2001–2004, and again in 2008–2012. They declined rather steeply in the period 2004–2008. By 2012, monthly real average earning was IDR 432,000 (in 2000 prices, based on the GDP deflator), lower than the average monthly earnings in 2001 (IDR 440,000). A roughly consistent trend was found across employment categories (Figure 1). Median earnings mimicked the trend of average real earnings.Footnote 5 The average monthly real minimum wage displayed a clear increasing trend between 2001 and 2004Footnote 6 but showed a near-stagnant trend thereafter (Figure 1). The timeframe of the increasing trend coincided with a series of reforms to labour legislation, culminating in the adoption of the 2003 Manpower Act. Figure 1, however, also reveals a disturbing fact regarding the level of minimum wage vis-à-vis average and median earnings. While the minimum wage is applicable only to the category of regular waged employees (status 4), the level of the real minimum wage was nearly similar to the median earnings of regular waged employees, indicating that the minimum wage was in effect the default wage. That is, a high proportion of wages were paid close to the minimum wage level. Moreover, the level of the minimum wage was higher than the overall median earnings and median earnings of self-employed and casual workers, pointing to a significantly low level of earnings for the other employment categories.
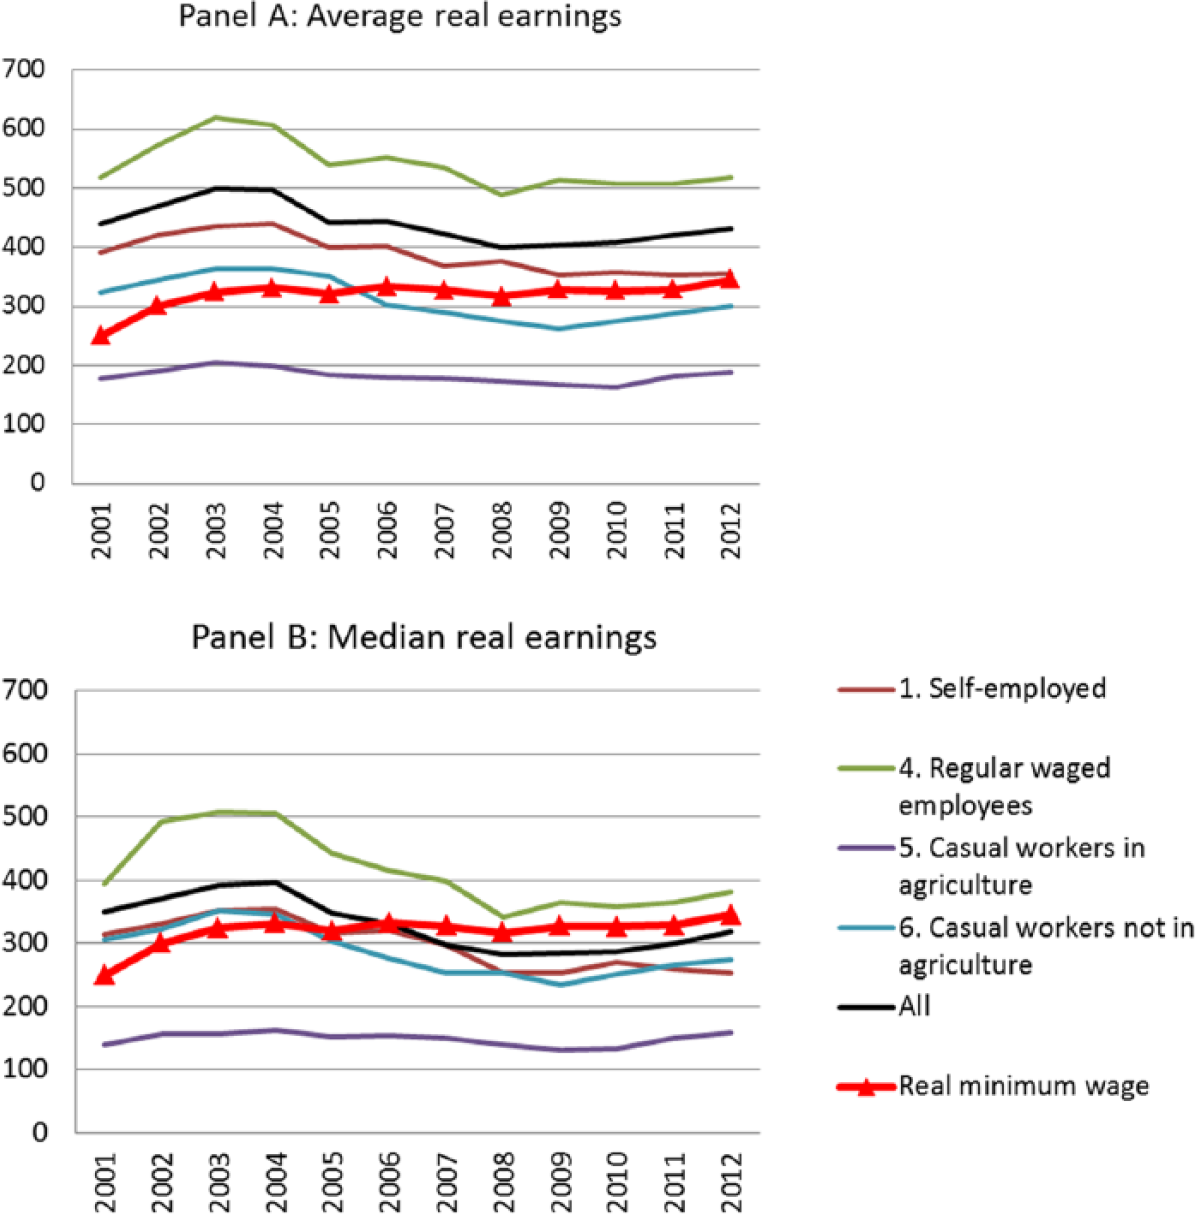
Figure 1. Real average and median earnings and real minimum wage (IDR 000/month) by employment status, 2001–2012.
Source: Calculated from the Sakernas.
Figure 1 shows a clearer decreasing trend of median real earning than the average earning across employment categories for which we have data. This is an early indication of increasing earning inequality. Figure 2 confirms the rising earnings inequality trend by depicting the declining trend in the ratio of median to mean real earnings. The declining ratio is clearly discernible for overall earnings and the earnings of all employment categories, except for casual labourers in agriculture.
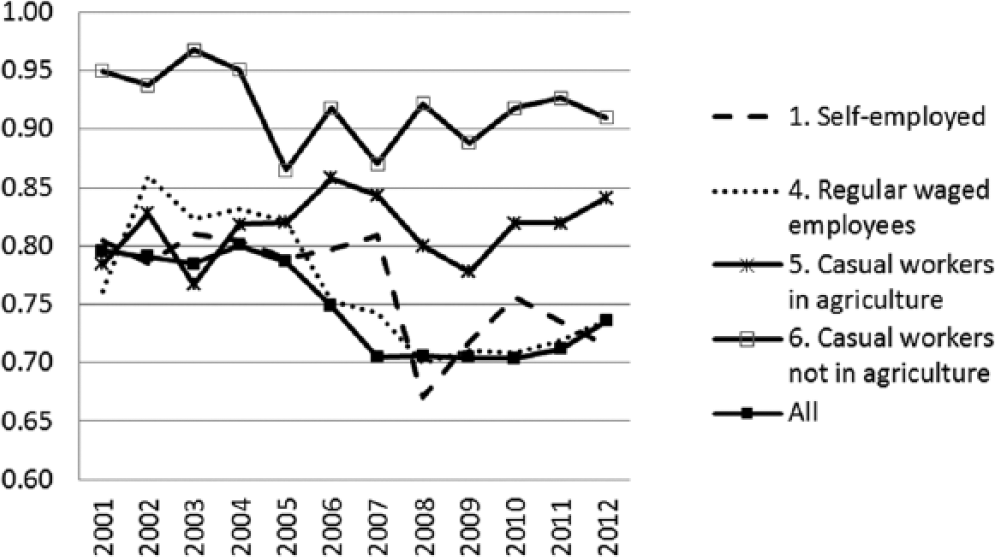
Figure 2. Median to mean ratio of real earnings across employment status, 2001–2012.
Source: Calculated from the Sakernas.
The declining trends in real earnings are found in most economic sectors (Figure 3). Real earnings declined in the agriculture and service sectors, stagnated in the manufacturing sector and increased only slightly in the trade sector. However, as will be shown later, the de-linking between earning and productivity is evident in all four economic sectors which absorb most of the labour force (agriculture, manufacturing, trade and services).
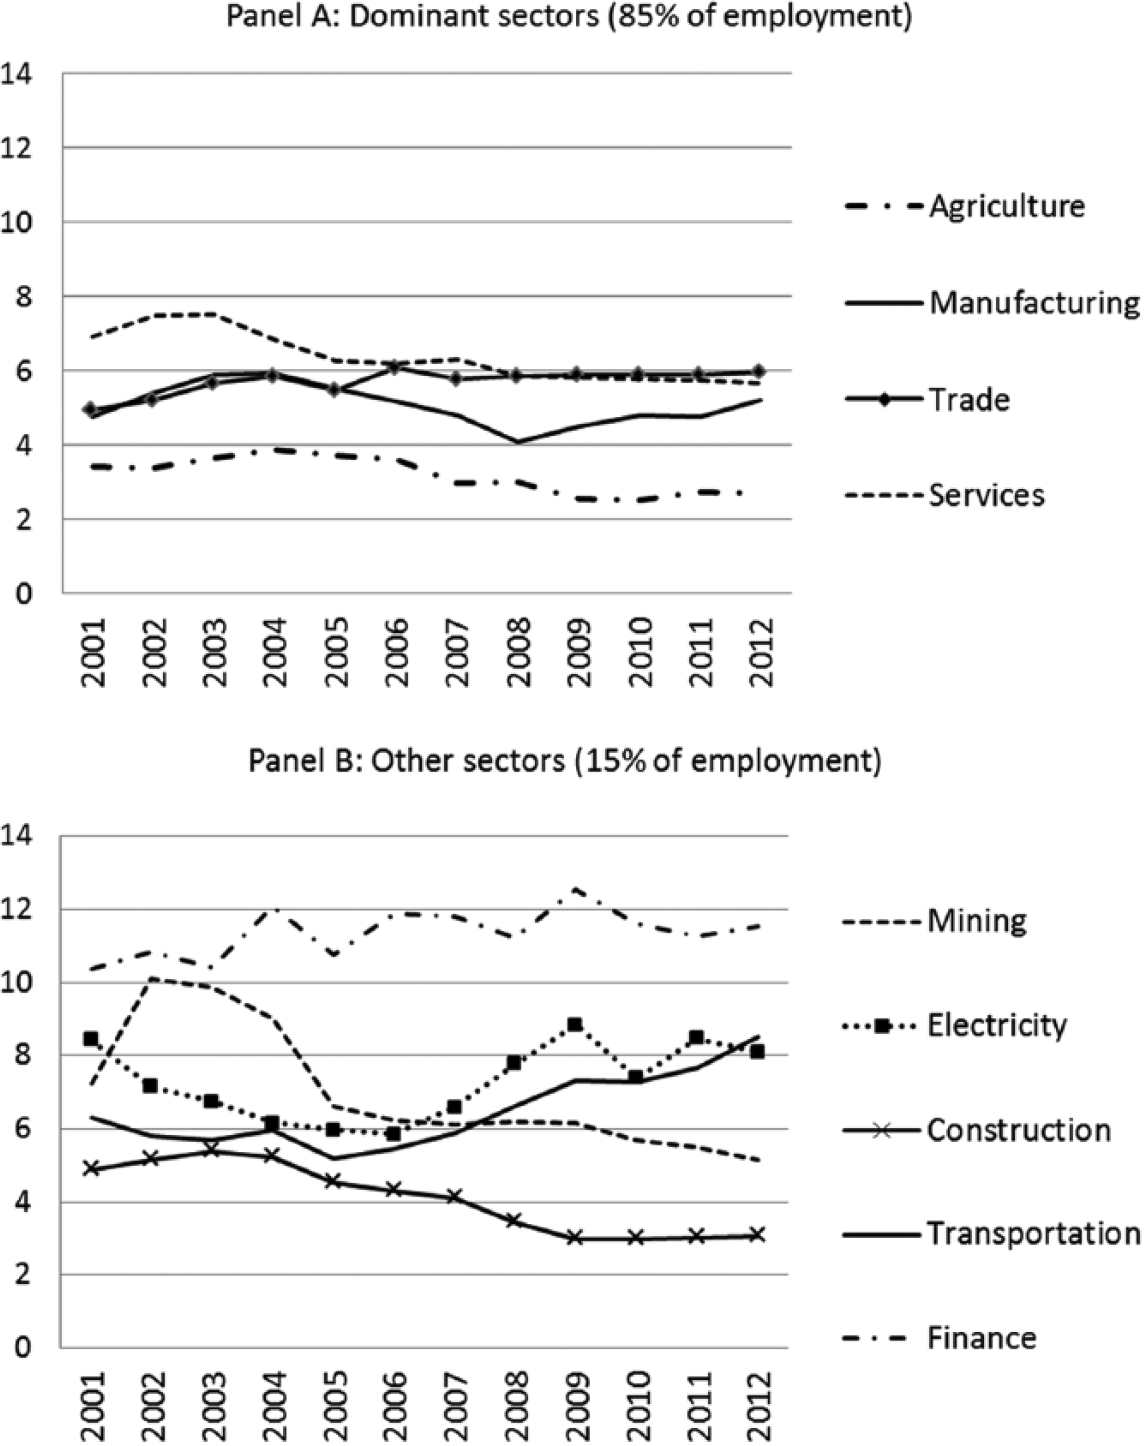
Figure 3. Declining real earnings in most sectors, 2001–2012 (average yearly earning, IDR million).
Source: Calculated from the Sakernas.
A sharp increase in real earning is noticeable only in the transport and communication sector. But this sector’s contribution to overall employment was not significant, absorbing only 4.5% of total employment in 2012, declining from 4.9% in 2001. This sector also recorded the highest growth in labour productivity. It seems that the transport and communication sector has been the main beneficiary of the country’s economic growth during the past decade.
Figure 4 depicts the gender gap in real earnings. In general, female workers received around a little bit over three-quarter of their male counterparts. The gap has improved during the last decade. The female to male ratio of real earnings in overall employment increased from 0.67 to 0.77. However, the improvement of the gender gap of real earnings was somewhat slower in the formal sector of regular wage employment.
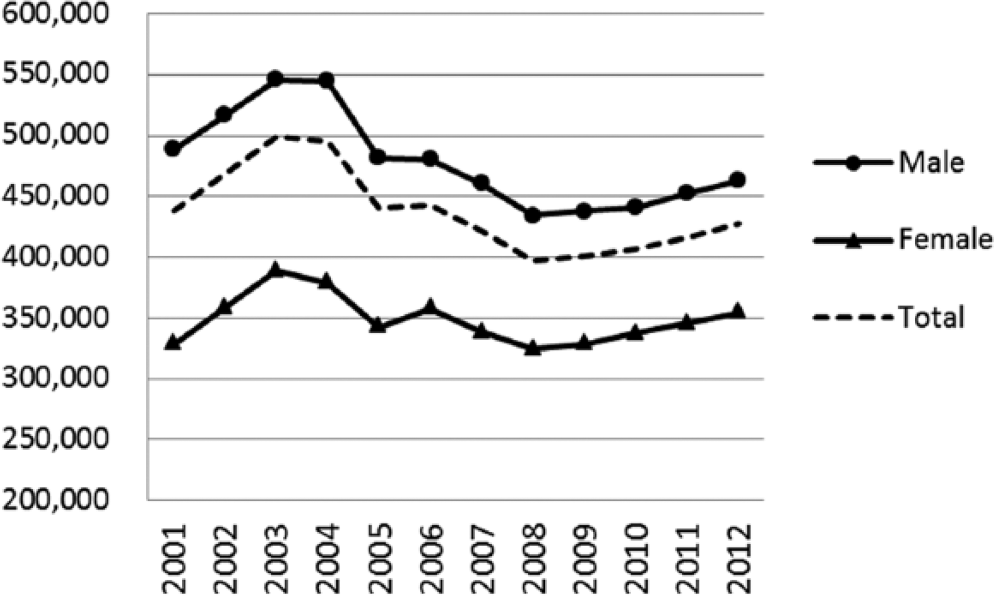
Figure 4. Gender gap in real average earnings (monthly, IDR, 2000 constant prices), 2001–2012.
Source: Calculated from the Sakernas.
Earnings and productivity
Earnings can be defined as the price of labour and productivity as GDP per employed population. As has been well anchored in economic theory, earning and labour productivity should move in a similar direction, assuming that the labour supply is not infinitely elastic as assumed by Keynes in the context of the great depression (Reference FabricantFabricant, 1959). Higher labour productivity should lead to higher earning and vice versa, as predicted by the marginal productivity theory and efficiency wage theory (Reference GohGoh, 2009). The wage push would come from both sides: employers and employees. Employers would be willing to pay their employees more; at the same time, labourers would demand higher reward as their productivity increases. This would mean an upward (vertical) shift of the labour demand curve, meaning higher wages for the same amount of work.
Higher productivity should also lead to higher wages, more employment and expansion of the economy. Theoretically, this would happen when higher earnings lead to increased consumption demand and higher profit leads to increase in investment so that there is an overall increase in effective demand: ‘When wages rise in line with productivity increases they are both sustainable and create a stimulus for further economic growth by increasing households’ purchasing power’ (ILO, 2013: v). This would imply a rightward (horizontal) shift in the labour demand curve, meaning more employment at a given wage.
The reality, however, does not always follow the above logic. At the global level, recently published Global Wage Reports (ILO, 2013, 2015) highlight the de-linking between earnings and productivity. This de-linking has occurred not only as a result of the recent global recession but, in fact, has been observable since the past decade.
The situation in Indonesia was consistent with this observation. The de-linking between earnings and productivity was evident in post-crisis Indonesia from an economy-wide perspective, as well as across sectors and across provinces. While growth in wage-earnings had kept pace with productivity growth before the 1997/1998 economic crisis (Reference Dhanani, Islam and ChowdhuryDhanani et al., 2009), the story is very different after the crisis. During 2001–2012, real earnings only grew at 0.2% annually, while productivity grew at an annual rate of 5.4%, a rate comparable to that of the pre-crisis period.
Figure 5 clearly depicts the evidence on this de-linking of wages and productivity. The earning to productivity ratio consistently declined, both for the overall economy and across six out of the nine economic sectors, covering 96% of the total employed workforce. The decline was greatest in the agricultural sector that has the largest share of informal employment. A possible cause is the decreasing earnings of the largely less educated and unskilled agricultural sector workforce, relative to other dominant sectors such as manufacturing, trade and services. The three sectors that did not show the de-linking trend were mining, finance and electricity–gas–water, comprising only 4% of total employment. Sectoral disaggregation is particularly important since looking at the issue only at the level of the overall economy hides variations across economic sectors and hampers analysis of causes and possible remedies. Figure 6 demonstrates the de-linking trend in a slightly different way by showing the divergent trend in the earning index vis-à-vis the productivity index for the overall economy and the four main economic sectors absorbing 85% of total employment. It has to be noted that the de-linking between labour productivity and real earnings took place during a relatively short period of 4 years between 2004 and 2008. In that period, these two indicators moved in opposite directions, labour productivity rising and real earnings declining. Following this short period, real earnings rose again, however at a slower pace than labour productivity.
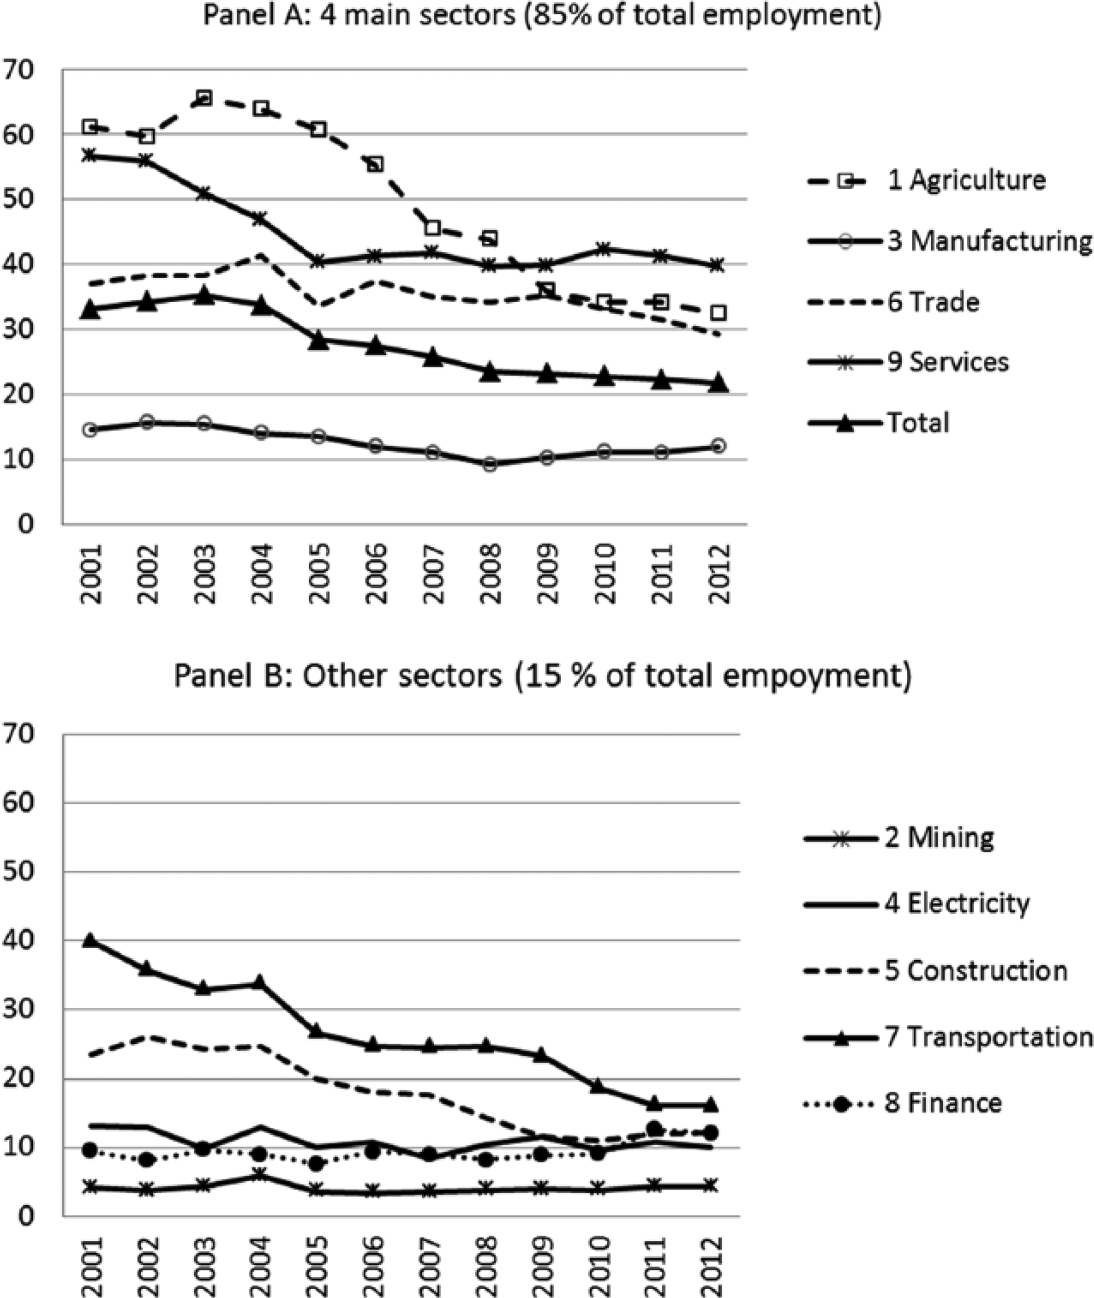
Figure 5. Wage-earnings–productivity ratio (%) across sectors, 2001–2012.
Source: Calculated from the Sakernas.
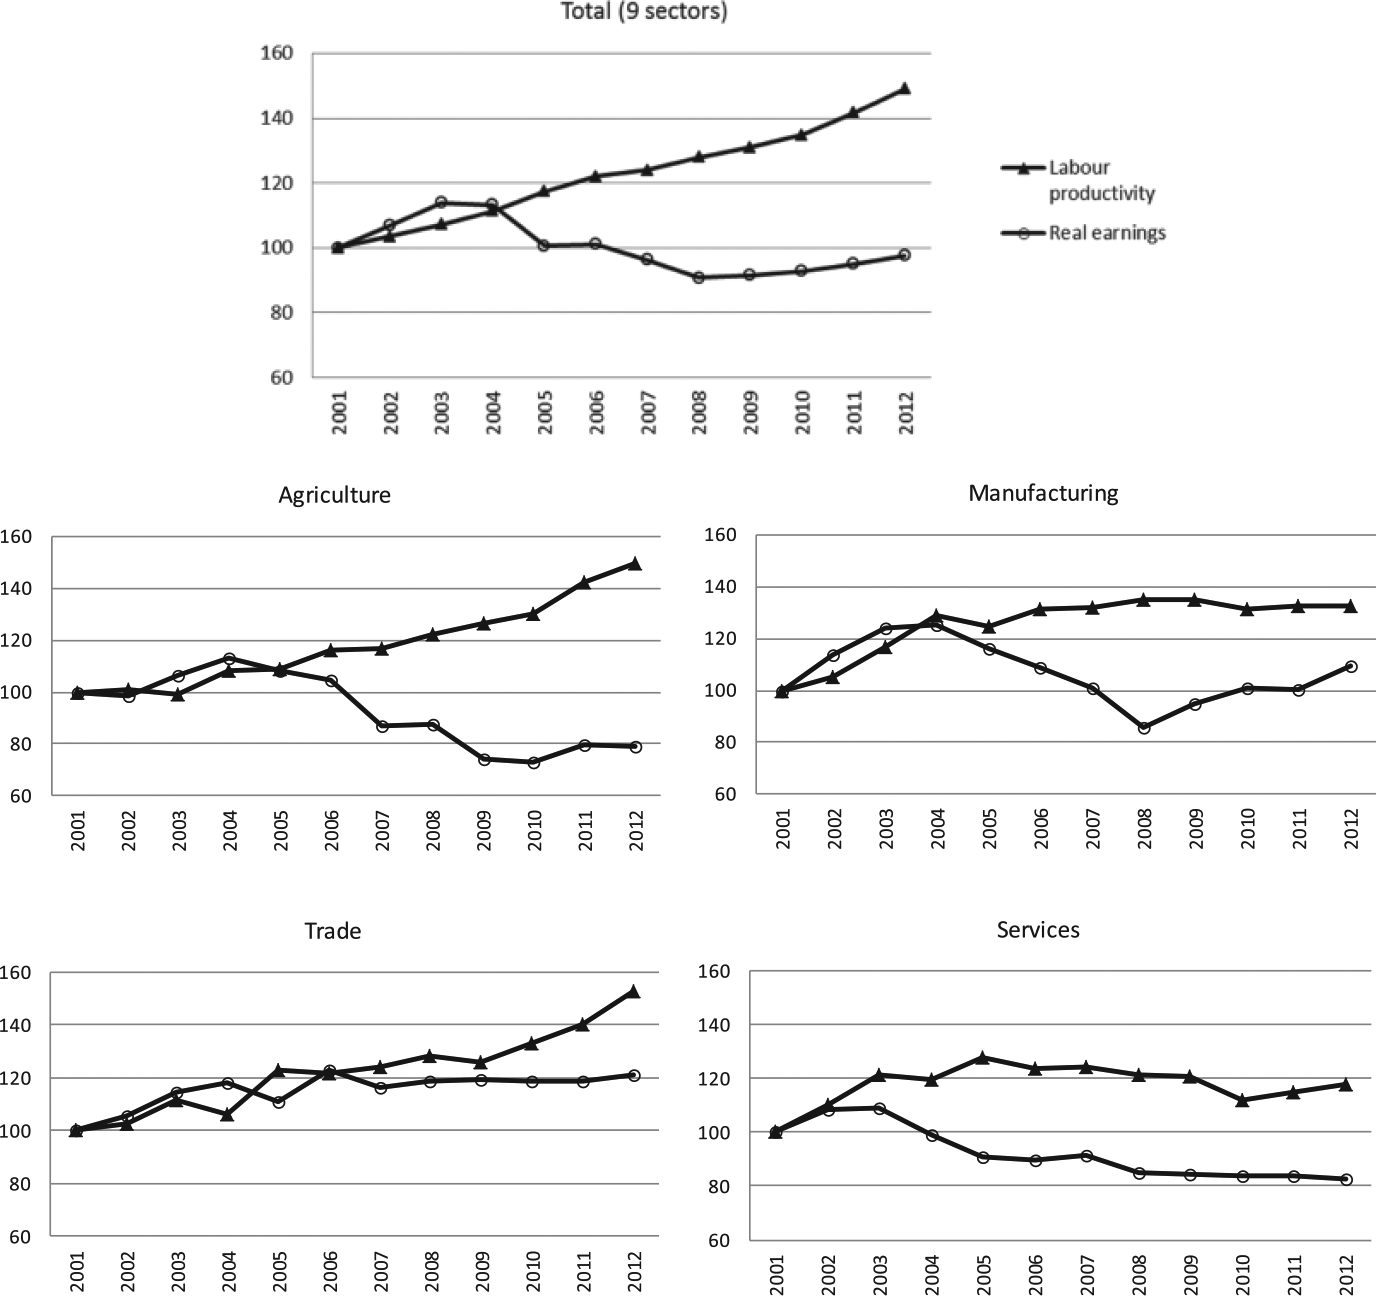
Figure 6. Labour productivity and real earnings (2001 = 100).
Source: Calculated from the Sakernas (annual: 2001–2012) and the National Account (annual: 2001–2012).
From a regional perspective, the de-linking between earnings and productivity is noticeable in the majority of Indonesian provinces. In order to see the differences in the de-linking trend across the 33 provinces, the earnings–productivity ratio trends of each province from 2001 to 2011 are plotted. Based on the slopes of the trend in each province, the provinces are classified into the following three groups:
-
• Group 1: 17 provinces with decreasing earnings–productivity ratio (slope ⩽ −0.20);
-
• Group 2: 8 provinces with constant earnings–productivity ratio (−0.20 < slope < 0.20);
-
• Group 3: 8 provinces with increasing earnings–productivity ratio (slope ⩾ 0.20).
The details of the provinces grouping are presented in Table 2.
Table 2. Provinces grouping based on earnings–productivity slope.

Source: Calculated from the Sakernas and National Account.
The above groupings are used to calculate the average earnings–productivity ratio, the average growth of real GDP (RGDP) and the average growth of their share in the national GDP. The results indicate distinctive characteristics of each provincial group. By graphing the average trend in each group, as shown in Figure 7, provinces in Group 1 turn out to be the best performing economies, showing increasing trends in economic growth and in the growth of their RGDP share in the national GDP over the past decade. However, the earnings–productivity ratio in these Group 1 provinces was decreasing, indicating the de-linking between earnings and productivity. This is an unfortunate correspondence, as good economic performance has been achieved at the cost of labour since their real earnings did not keep pace with labour productivity growth.
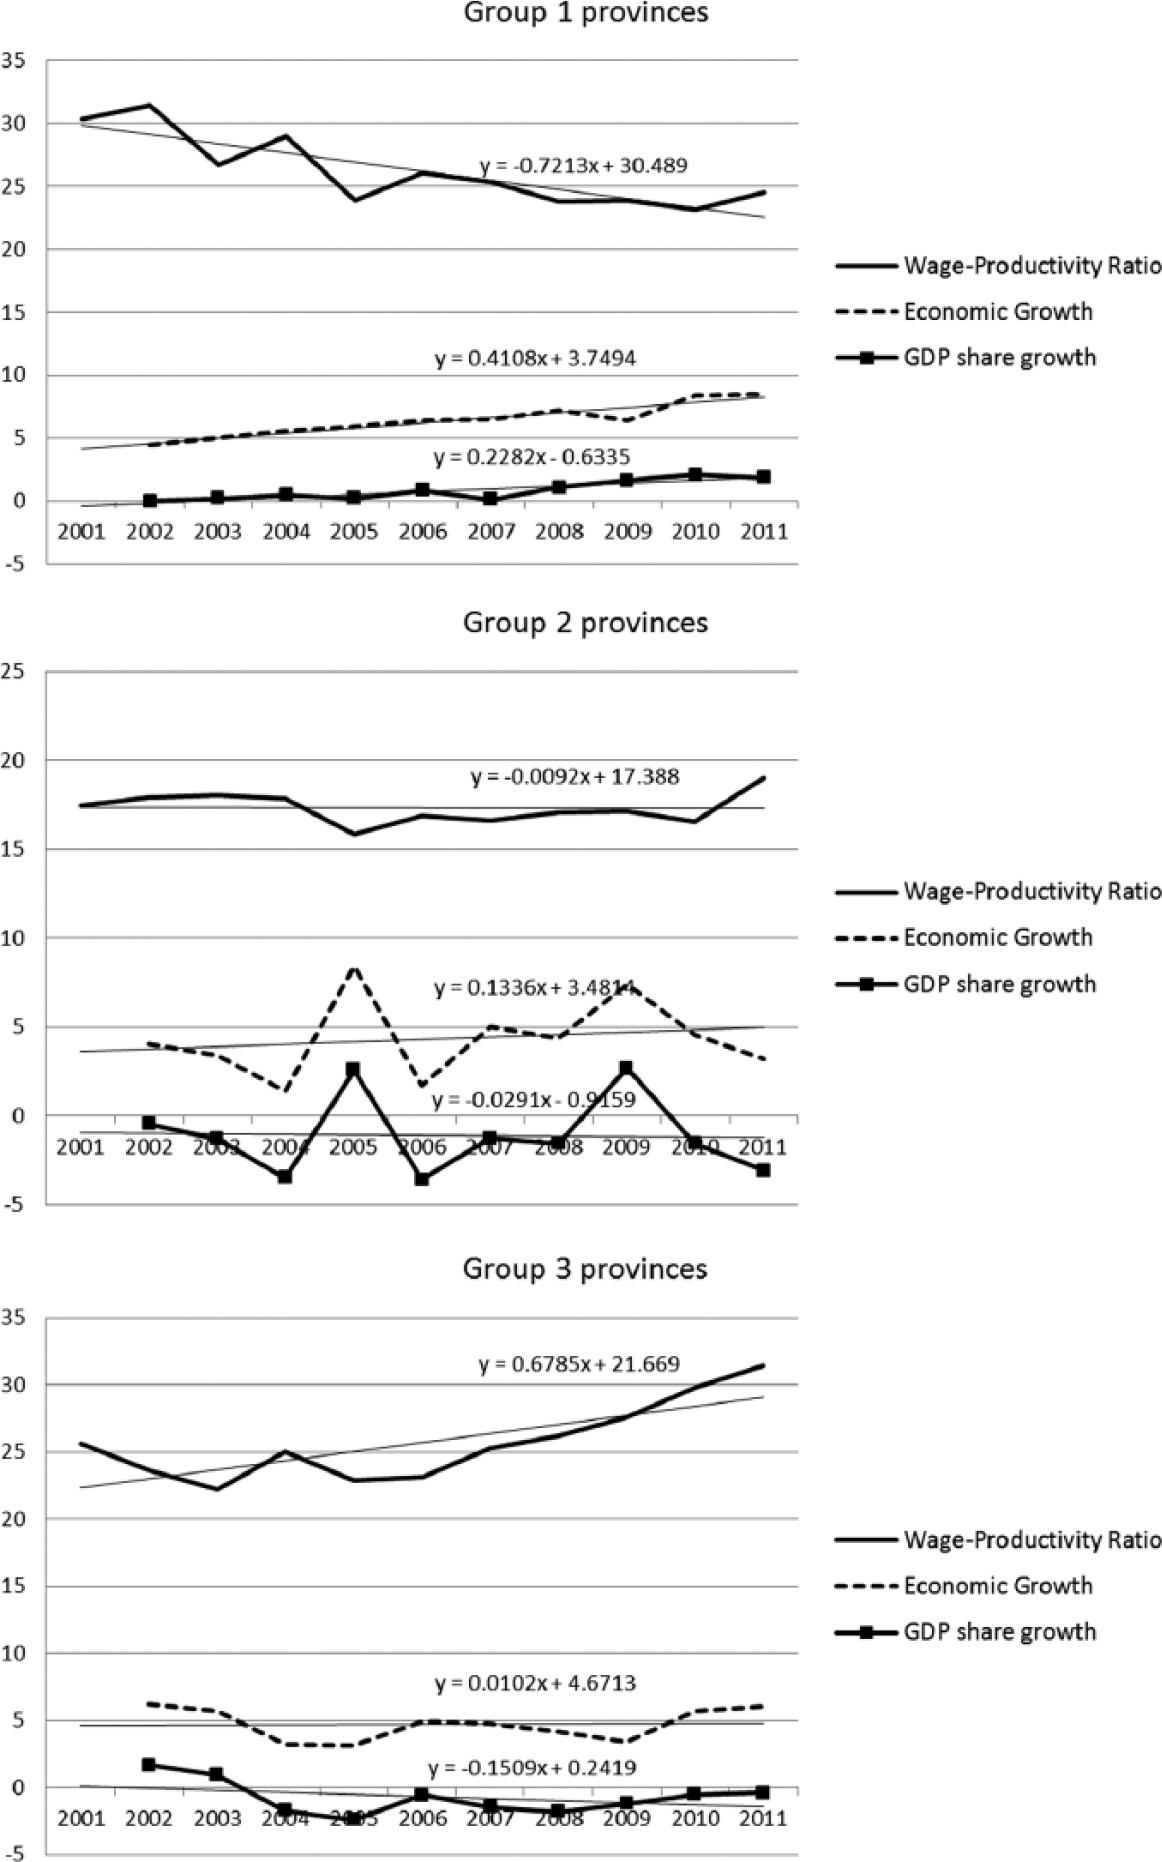
Figure 7. Average earnings–productivity ratio, average economic growth and average growth of GDP share for each provincial group (%).
Source: Calculated from the Badan Pusat Statistik (BPS) data (Sakernas and National Account).
GDP: gross domestic product.
Ordinary Least Squares (OLS) regressions are used to estimate the trend lines.
In contrast, provinces in Group 2, where the earnings–productivity ratio was relatively constant during the last 10 years, exhibit a fairly small increasing trend in their RGDP growth and even a decreasing trend in their average share in the national GDP. Group 3 provinces, where the earnings–productivity ratio shows an increasing trend (meaning that real earnings increased while productivity decreased), show an even smaller increasing (in fact, almost constant) trend compared to Group 2 in terms of average economic growth. Moreover, the growth of their shares in the national GDP shows a decreasing trend.
In short, the 17 provinces in Group 1 were the best performing economically, with the highest positive slope for their economic growth and increasing share in the national GDP. In 2011, this group comprised more than 70% of total employment and contributed nearly 60% of total GDP. These 17 provinces were the backbone of the country’s economic growth. The worst economic performance was found in the eight provinces of Group 3 that experienced the increasing earnings–productivity ratio. The employment and GDP shares of Group 3 provinces were only 12% and 10%, respectively, and most were located in remote outer islands.
Therefore, it seems that increasing earnings–productivity ratio, implying ‘catching up’ of earnings against productivity, is not a good sign. In South Africa, for example, Reference KleinKlein (2012) found that that the rapid growth of real earnings, which outpaced labour productivity growth in most sectors, played an important role in suppressing employment creation. Furthermore, Reference KleinKlein (2012) observed a significant negative effect of excess real earnings on overall employment and employment in the formal sector. Excess real earnings is designated an ‘earnings gap’, referring to the gap between real earnings and labour productivity. In South Africa, the fact that levels of real earnings have surpassed those of labour productivity has proved very damaging to employment creation (Reference KleinKlein, 2012). However, the situation in the eight Indonesian provinces in Group 3 is different from that in South Africa. The rising earnings–productivity ratio in these Indonesian provinces is not due to earnings level surpassing the productivity level. Rather, it is attributable to actual declines in labour productivity. In Indonesia, in general, real earnings are still far below labour productivity.
The above finding on the de-linking between earnings and productivity indicates that, despite the relatively good performance of the Indonesian economy, the post-crisis growth pattern has been increasingly unfavourable for most Indonesians. The de-linking brings at least three implications: first, it leads to an increase in overall inequality; second, it should be factored into any discussion/estimation on employment elasticities, mainly concerning the employment effect of economic growth; third, the quality of economic growth should be questioned, especially from the employment perspective. The next sections discuss these three issues in turn.
Wage-earning inequality
Concerns with overall (vertical) inequality in Indonesia, so far, have been driven primarily by the evolution of the Gini coefficient of per capita household expenditure, derived from the National Socio-economic Survey (Survei Sosial Ekonomi Nasional – Susenas). During the period of the East Asian miracle before the 1997 Asian crisis, it was said that the Indonesian economy did not follow the Kuznets prediction of a trade-off between income and equality in early stages of development (Reference AsraAsra, 2000). The three decades of sustained high growth were achieved while maintaining a relatively constant overall inequality level measured by the Gini coefficient (around 0.33) of household expenditure (World Bank, 1993). However, the story is different in post-crisis Indonesia. While the economy recovered fairly quickly from the AFC and the growth has been assessed to be quite robust amid the Global Financial Crisis (GFC) of 2008/2009, overall inequality has increased. In 2011, the expenditure Gini reached its peak at 0.41, a level that had never been seen before.
In general, during the past decade, wage-earnings inequality has also been on the rise, which is consistent with the better-known Gini measures of household expenditure. In fact, the overall wage-earning Gini is higher than that of expenditure, on average by 22%. The lower level of the expenditure Gini can be explained partly by the smoothing effect of consumption, where saving and dissaving play a role. The wage-earning Gini peaked earlier in 2009 at a staggering level of 0.46. Figure 8 depicts the movement of the expenditure and wage-earning Gini coefficients during the past decade. This is probably the first estimate of wage-earning Gini in Indonesia. Earning inequality increased in the period 2004–2008, stabilised in the period 2008–2010 and then began to narrow during 2010–2012. The trend of an increasing Gini of overall earnings is also consistently found in the disaggregated data across economic sectors.Footnote 7

Figure 8. Gini coefficients of wage-earnings and household expenditure, 2001–2012.
Source: Wage-earning Gini is calculated by the author from the Sakernas, expenditure Gini is from Badan Pusat Statistik (BPS).
Employment function
Model, data and method
The three variables (earnings, productivity and employment) are brought together in a two-step regression process for an employment function. In the first step, it is postulated that earnings are a function of productivity, as earnings are the reward for workers in the production process, and therefore the two should be positively related. In the second step, employment is a function of real earnings, following the usual formulation of any employment function. What is new in this study is the treatment of real earnings (in the second step regression) as a function of productivity (in the first step regression). This makes the three variables (earnings, productivity and employment) systematically related. This is a significant improvement in the latest model of the employment function for Indonesia offered by Reference Tadjoeddin and ChowdhuryTadjoeddin and Chowdhury (2012).Footnote 8 Key to the improvement is to treat real earnings as an endogenous variable by postulating real wage-earnings as the function of productivity expressed in the first step regression, while Reference Tadjoeddin and ChowdhuryTadjoeddin and Chowdhury (2012) assumed real earning to be exogenous.
The two-step equations to model the employment are specified below:
-
First step
-
Second step
The first step regression specifies real wage-earning (LnRW) as a function of labour productivity (LnPROD) and real earnings in the previous year.Footnote 9 It has to be noted that ‘real earnings’ refers to the real earnings of self-employed workers, regular wage employment and casual workers. This regression is a more systematic test for the postulated de-linking between earning and productivity, which is expected to be indicated by an insignificant or negative value of α 1. In the second step regression, the dependent variable LnEMPi,t is the natural log of the number of those in (sectoral) employment in province i at time t and LnEMPi,t −1 is a one-period lagged value of this variable. RW stands for real earning as an endogenous independent variable. Here, we use the predicted value of LnRW taken from the first step regression. The remaining components in the model are the error terms: ui represents time-invariant heterogeneity across provinces and εi,t is the time-variant error term. The relationship between wage level and productivity is denoted by α 1 and earnings elasticity with respect to employment output is shown by β 1. Therefore, employment (EMP) will increase/decrease by β 1% if real earnings (RW) decrease/increase by 1%.
Employment and real earnings data are taken from the annual publications of Sakernas (August series), while provincial RGDP data are from the regional accounts publications of the BPS (Badan Pusat Statistik – Central Statistical Agency). Sectoral real earning is obtained by deflating sectoral nominal earning by sectoral output deflators.Footnote 10
The model is estimated for all nine sectors in the economy, namely, (1) agriculture, fisheries and forestry; (2) mining and quarrying; (3) manufacturing; (4) electricity, gas and water; (5) construction; (6) trade, hotel and restaurant; (7) transportation and communication; (8) finance; and (9) services. Since we have panel data observations with province-year as the unit of analysis, each regression is estimated using the system generalised method of moment (GMM) regression, where by default the lag dependent variable is included as an independent variable in each regression.Footnote 11 The estimation method is suitable for the panel data that we have with many cross-sectional observations during a limited number of periods, that is, 33 provinces during 2001–2011. The two regressions are run separately. The predicted value of LnRW from the first step regression is treated as an independent variable for the second step regression. For comparison, a separate system GMM regression similar to the second step regression is also run, but real earnings are treated as exogenous. Then, the coefficient of real earnings of the endogenous setting is compared with that of the exogenous one.
Results
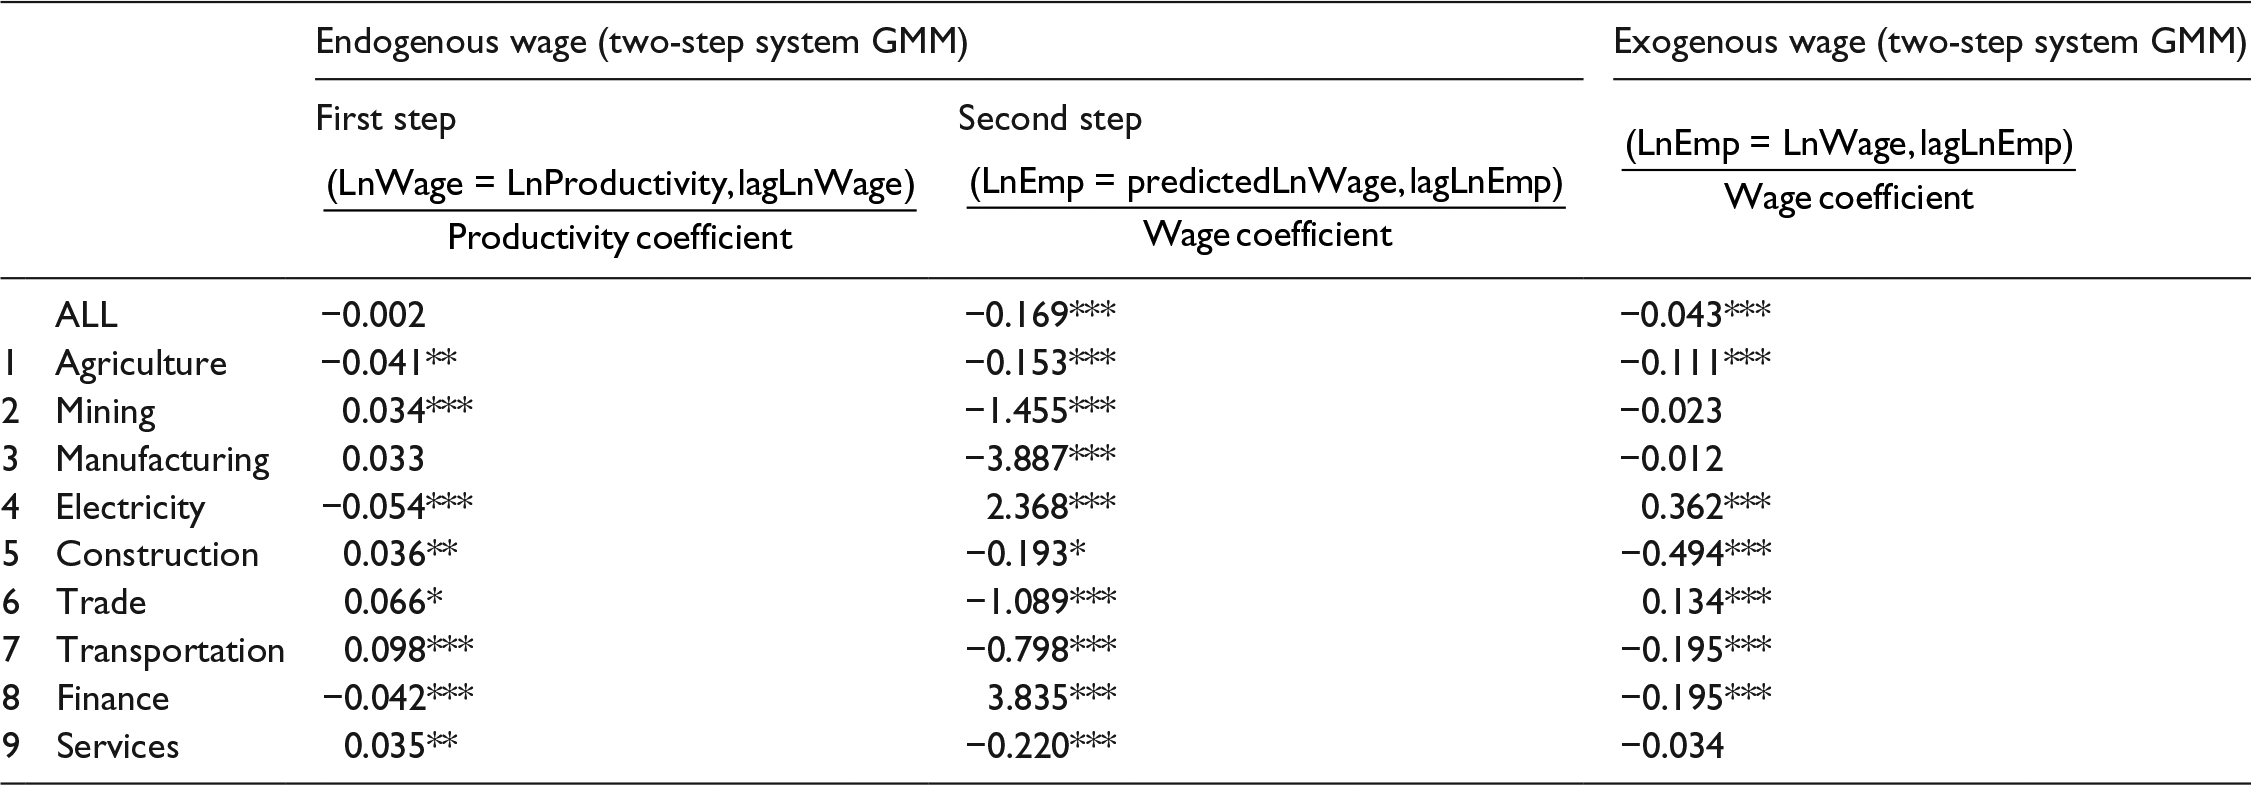
Results of the system GMM regression for the overall economy as well as the nine economic sectors are summarised and simplified in Table 3.Footnote 12 Support for the de-linking hypotheses between earnings and productivity is further found for the overall economy and across sectors, as can be seen from the first step regressions. While the productivity coefficient is insignificantly negative for the overall economy, the situation across sectors is not homogeneous. In five sectors, the productivity coefficients are significantly positive but the magnitude is negligible. Therefore, in most cases, productivity has no meaningful relationship with real earnings, pointing to a situation where the two are not moving in a similar direction, or are doing very marginally.
Table 3. Employment functions: endogenous versus exogenous wage-earnings, 2001–2011.
GMM: generalised method of moment.
*** , ** and * indicate 1%, 5% and 10% levels of significance, respectively; detail regression results are provided in Supplementary Appendices 1 and 2.
In a previous estimation, Reference Tadjoeddin and ChowdhuryTadjoeddin and Chowdhury (2012) treated real earnings as an exogenous independent variable and found significant negative relationships between real earning and employment, indicating that one way to increase employment is through a decline in real earnings. This study uses earnings data for the four employment statuses (1, 4, 5 and 6), covering a much larger share of employment compared to the earnings coverage of the previous studies that used wage data for regular wage employment only.
In the regression, we compare the effect of real earnings on employment in two scenarios: endogenous earnings and exogenous earnings. In general, similar to the previous studies, a negative relationship between earnings and employment is found. However, the strength of the negative coefficient of real earnings is greater in the endogenous setting of earnings rather than in the exogenous one. The finding is consistent for the overall economy and most sectors. Not all economic sectors display a similar trend, as earnings and employment in the electricity and finance sectors are positively and significantly related. However, we argue that the decoupling between earnings and productivity in the first step regression serves to affect the negative coefficient of real earnings in the second step regression. If the increase in productivity is strongly followed by a similar movement of real earnings, we could expect a more ideal positive association between earnings and employment.
However, the ideal situation of a positive relationship between earnings and employment, strengthened by a positive correlation between real earnings and productivity, is found in the large and medium (LM) firms of the manufacturing sector. In this case, a similar regression is conducted exclusively for the LM firms.Footnote 13 We exploit the variation across sub-sectors of LM firms at International Standard Industrial Classification of all Economic Activities (ISIC) 3 level, and surprisingly we find a different result: namely, the de-linking story is no longer valid (Table 4, row 2). In the first step regression, the coefficient of productivity variable is significantly positive (0.24), meaning that 1% increase in productivity leads to 0.24% increase in real wage. As a consequence, in the second step regression, the predicted real wage variable is significantly and positively related to employment with a coefficient of 0.55. In other words, this could be interpreted as indicating that a 1% increase in real wage leads to 0.55% increase in employment. In contrast to the previous finding, an increase in real wages can lead to higher employment in more modern and better organised LM sectors of the manufacturing industry. This is what we refer earlier as the ideal situation.
Table 4. Employment function – manufacturing.

GMM: generalised method of moment.
*** , ** and * indicate 1%, 5% and 10% levels of significance, respectively; regression results of the overall manufacturing sector are taken from Table 4; detailed regression results can be found in Supplementary Appendixes 3 and 4.
The quality of growth
This section brings together the previous discussion by framing it within the broader issue of ‘quality of growth’. The recent direction of Indonesia’s development policy has been sealed by the so-called triple-track strategy.Footnote 14 It combines the traditional pro-growth focus of the development policy with a pro-poor and pro-jobs orientation, meaning that the primary focus on achieving high (quantity) economic growth should, at the same time, reduce poverty and open up employment rates. The policy circle and some academic quarters have defined such characteristics of economic growth as quality growth.Footnote 15 This approach echoes the globally dominant narrative such as that put forward by the World Bank (2008: 6), which defines quality of growth in terms of ‘aspects of growth that especially reduce extreme poverty, narrow structural inequalities, protect the environment, and sustain the growth process itself’.Footnote 16 Through an examination of the quality of growth from the employment perspective, this section argues that such a construct of quality growth in Indonesia seems insufficient.Footnote 17
Since Indonesia has been elevated to the status of a middle-income country by the World Bank, has survived the recent GFC and has been hailed as the most stable democracy in Southeast Asia, it cannot afford to concentrate only on achieving the 5%–6% targeted unemployment rate by 2014 (in addition to lowering the national poverty rate to 10%–11%). The unemployment rate is not a good indicator to use in monitoring development progress in developing countries.Footnote 18 As this measure, in addition to the poverty rate, also indicates the bottom line of deprivation, Indonesia should instead focus on the quality of those that have managed to escape the lowest threshold of deprivation. Emphasis should be placed on the quality improvement of the employment rather than mere reducing the open unemployment rate. This is in accordance with the ILO’s (2014) interpretation of quality growth referring to growth that does not only leave employment behind but expands quality employment or decent work coverage. Relevant monitoring indicators, among others, could include declining in informal employment and underemployment, rising real wage and increasing social security coverage (Reference TadjoeddinTadjoeddin, 2015).
From an employment perspective, during the last decade progress with regard to quality of growth has been very modest, if not stagnant, despite the (quantity) growth recovery the country has achieved since the 1997/1998 AFC. To substantiate this claim, the following arguments are made. First – this is the most important one – real earnings have been at best stagnant if not declining, as shown in the previous section. Second, the relative size of formal employment representing quality employment was stagnant during 2001–2010 and increased only in 2011 and 2012). Third, as has been argued earlier, the de-linking between earnings and productivity has been a dominant trend of the overall economy as well as most sectors and regions. Fourth, earnings inequality is on the rise, as has been clearly shown by different measures. Adding to this point, despite the growing economy, the labour share of GDP has been stagnant at a low level during the past four decades. Fifth, union membership and social security coverage among employed population is very low at 11.2% and 9.8%, respectively; this is based on the 2007 Sakernas data and this situation is unlikely to have dramatically changed since then.
In short, the above five points call into question the dominance of open unemployment as a measure for gauging employment progress and quality growth viewed from the employment perspective. As a last note, the disconnection between the quality of employment, on one hand, and unemployment reduction and economic growth, on the other, is observable when the quality of growth is viewed through the triple-track development strategy.
Conclusion
This article has examined real wage-earnings, productivity and earning inequality in Indonesia and across economic sectors. It finds that post-crisis, democratic Indonesia displays the global trend of the disconnection between earnings and productivity: labour productivity continues to rise while real wage-earnings stagnate. This is different from the trend during the New Order development. The de-linking trend has brought, at least, three implications. First, the trend should affect income or earnings distribution as confirmed by rising overall earnings inequality. In dealing with this, the policy to raise the minimum wage could be seen as a way to address the problem of rising inequality. This, however, is far from sufficient. The problem lies in the fact that the minimum wage is treated as the default wage rather than as the fall back wage or the lowest living wage. The shifting perception and practice of the minimum wage, away from the default wage and towards the lowest living wage, is a key policy implication of the finding.
Second, the de-linking trend helps explain the conventional wisdom of a negative relationship between real earnings and employment, while in an ideal situation such a trade-off should not be the case and the two (real earnings and employment) should move in the same direction. This finding would challenge policy makers who traditionally assume that a rising real wage level is detrimental to employment expansion.
Third, the trend opens a new discussion on the broader issue of quality of growth, as the data show that robust economic growth in the post-crisis Indonesia has not been accompanied by parallel improvement with regard to the quality of employment. This finding implies that policy-makers should think beyond unemployment reduction as a key development target and emphasise other targets reflecting the quality of employment, such as expansion of the formal sector, raising of the real wage level and reduction in underemployment.
It is interesting to push the analysis to a further question: what does rising inequality mean for average Indonesians and their vulnerability to economic shocks in a democratic setting? Two things emerge: rising inequality and the fact that the recent trends on the de-linking between earnings and productivity are not in favour of workers who form the majority of the Indonesian society. Inequality is considered a major factor that contributes to conflict in fragile states and young democracies (Reference Cederman, Gleditsch and BuhaugCederman et al., 2013; Reference TadjoeddinTadjoeddin, 2014b). The increase in labour activism could be also attributed to their rising awareness of these trends. These concerns should have implications for future growth and stability.
Inequality is also found to correlate positively with current account deficits and household debts (Reference GodaGoda, 2013; Reference Kumhof and RancièreKumhof and Rancière, 2010; United Nations Conference on Trade and Development (UNCTAD), 2012). Both are sources of macroeconomic instability. Therefore, sustainability of growth becomes difficult in an increasingly unequal society, not only owing to the possible social and political instability that it may trigger but also as a result of macroeconomic instability through balance of payments and financial crises.
Acknowledgements
This study is based on a research project with the International Labour Organization (ILO), Jakarta. A previous version of this article was presented at the third World Social Science Forum (WSSF), Durban, 12–16 September 2015. I thank Ilmiawan Auwalin for excellent research assistance. I also thank Emma Allen, Anis Chowdhury and Neven Knezevic for their helpful comments. The usual caveats apply.
Funding
This study was funded by the International Labour Organization (ILO), Jakarta.

