The pathogenesis of schizophrenia remains unclear. Is the underlying disease process mainly neurodevelopmental, with early neurobiological lesions interacting with later normal development (Reference Murray and LewisMurray & Lewis, 1987)? Or does the fact that patients with schizophrenia often have signs of changes in brain structure, such as reduced brain volume, reduced grey-matter volume and increased extracerebral (sulcal) cerebrospinal fluid, indicate a later neurobiological regressive process such as the loss of synaptic connectivity (Reference McGlashan and HoffmanMcGlashan & Hoffman, 2000)? A more detailed understanding of premorbid functioning might help us address this question by identifying subtypes within the heterogeneous syndrome of schizophrenia. A number of scales have been developed to describe the premorbid phase. The Premorbid Adjustment Scale (PAS), which defines the premorbid phase as the time from birth until 6 months before onset of psychosis, is probably the most widely used premorbid scale for psychosis (Reference Cannon-Spoor, Potkin and WyattCannon-Spoor et al, 1982).
In this study we combined the PAS data from four samples of patients with first-episode non-affective psychosis, collected in Norway and Denmark between 1993 and 2001, and used cluster analysis to identify distinctive patterns of premorbid course. Our hypothesis was that some patterns would suggest a neurodevelopmental pathophysiology whereas others would suggest a neuroregressive process.
METHOD
Study sample
Patients were recruited from two studies of first-episode non-affective psychosis: the first was our 1993-1994 study in Rogaland County on the west coast of Norway (Reference Larsen, McGlashan and MoeLarsen et al, 1996a ) and the second was the Early Treatment and Intervention in Psychosis (TIPS) project, which includes patients from three sites - Rogaland County in Norway, Ullevå sector in Oslo, Norway, and Fjorden mid-sector, Roskilde, Denmark (Reference Melle, Larsen and HaahrMelle et al, 2004). The two projects have identical inclusion and exclusion criteria and the data were pooled. The DSM-III-R diagnoses from the first study were converted into DSM-IV diagnoses (American Psychiatric Association, 1987, 1994) by one of us (T.K.L.); for details, see Larsen et al (Reference Larsen, McGlashan and Johannessen2001). The criteria for inclusion were:
-
(a) a first episode of a non-affective psychosis, i.e. schizophrenia, schizophreniform psychosis, schizoaffective psychosis, delusional disorder, brief psychosis, affective disorder with mood-incongruent delusions and psychosis not otherwise specified;
-
(b) living in the catchment area;
-
(c) age 18-65 years;
-
(d) IQ>70;
-
(e) experiencing a first episode of psychosis.
The exclusion criteria were a history of prior first psychosis, receiving adequate prior neuroleptic treatment, and organic or substance-induced psychosis. Written informed consent was obtained from all participants and the study was approved by the regional research ethics committees.
The mean age of the total sample of 335 patients was 27.9 years (s.d.=9.5), 59.1% were male and 84% were hospitalised at start of treatment. The majority had a diagnosis of schizophrenia spectrum disorder (34% schizophrenia, 19.4% schizophreniform, 11.9% schizoaffective disorder). The distribution of non-schizophrenia psychosis was 11.6% affective disorders with mood-incongruent psychosis, 6.3% delusional disorder, 6.3% brief psychosis and 10.4% other psychosis.
Measures
Premorbid Adjustment Scale
The Premorbid Adjustment Scale (PAS) comprises 36 items describing levels of functioning before the onset of psychosis. These items cover sociability and withdrawal, peer relationships, scholastic performance, adaptation to school and capacity to establish socio-sexual relationships, assessed during four periods in life: childhood (up to 11 years), early adolescence (12-15 years), late adolescence (16-18 years) and adulthood (19 years and beyond). The rating is based on interviews with the patient and/or with family members. The scoring range of each item is 0-6, with 0 indicating the best level of functioning and 6 the worst. Onset of psychosis is defined by the presence of delusions, hallucinations, thought disorder, inappropriate or bizarre behaviour or gross psychomotor behaviour in which the symptoms are not apparently due to organic causes (Reference Cannon-Spoor, Potkin and WyattCannon-Spoor et al, 1982).
The PAS has been used in several studies, yet there is no consensus as to how to present the data. In several studies the mean scores for all four originally defined time periods have been presented (Reference Haas, Garratt and SweeneyHaas et al, 1998; Reference Robinson, Woerner and AlvirRobinson et al, 1999; Reference Apiquian, Ulloa and PaezApiquian et al, 2002). Other studies report overall mean scores (Reference Levitt, O'Donnell and McCarleyLevitt et al, 1996), but most studies select items for certain dimensions. For example, Hien et al (Reference Hien, Haas and Cook1998) combined the items measuring social functioning to calculate an overall (mean) social dimension score. In another study the items for social withdrawal and peer relationships were summed to a single dimension (‘peers’), and the same was done for school functioning and school performance (‘school’) (Reference Fennig, Putnam and BrometFennig et al, 1995). Three studies have carried out a principal component analysis with varimax rotation. In two of these a ‘social’ and a ‘school’ factor were identified (Reference Van Kammen, Kelley and Gilbertsonvan Kammen et al, 1994; Reference Cannon, Jones and GilvarryCannon et al, 1997). Krauss et al (Reference Krauss, Marwinski and Held1998) identified two ‘social’ factors, one for childhood/early adolescence and the other for late adolescence, and a separate factor for ‘school’ (containing performance and adjustment). Allen and colleagues calculated a sum-score including all applicable age periods for each of the five items: sociability; peer relationships; school performance; school adaptation; and socio-sexual functioning (Reference Allen, Kelley and MiyatakeAllen et al, 2001). On the basis of the work by van Kammen and Cannon, they carried out confirmatory factor analysis and identified a social and an academic factor.
In some studies a ‘change score’ has been used. Kelley et al (Reference Kelley, Gilbertson and Mouton1992) and Cannon et al (Reference Cannon, Jones and Gilvarry1997) calculated this by subtracting childhood scores from early-adolescence scores. Haas & Sweeney defined three patterns of PAS in the following manner: deteriorating PAS was defined as ‘a pattern of worsening scores from childhood over the remaining premorbid periods and the equivalent of a two-point change over four premorbid stages’ (Reference Haas and SweeneyHaas & Sweeney, 1992: p. 376); the remaining cases were divided into ‘stable good’ and ‘stable poor’, split by the median score. The sample consisted of 71 patients and no statistical analysis was presented to support this subtyping. This study is the first to subtype premorbid functioning in a longitudinal manner. Hien et al (Reference Hien, Haas and Cook1998) used the median to split the sample into good and poor adjustment, but no longitudinal measure was considered.
In our own study of patients with a first episode of non-affective psychosis attending for treatment in Rogaland County, Norway, in 1993-1994, we calculated change scores as the difference between the mean score for one period and the mean score for the previous period (early adolescence minus childhood; late adolescence minus early adolescence; adulthood minus late adolescence; Reference Larsen, McGlashan and JohannessenLarsen et al, 1996b ). We thus identified a subgroup with deteriorating course. Like Haas et al (Reference Haas, Garratt and Sweeney1998), we used the median scores to divide the remaining patients into ‘stable good’ and ‘stable poor’ subgroups.
Published research appears to identify two basic dimensions in the PAS: social and academic. The time patterns are much less clear. A major problem with using the median scores to separate the stable good and stable poor subgroups is that a skewed distribution of data may make one of the groups heterogeneous. Furthermore, such a procedure cannot identify groups of patients with a deteriorating course. The identification of such a group would be important, because a substantial neuroregressive element in schizophrenia should imply a deteriorating course, whereas a predominantly neurodevelopmental element would probably be expressed as a stable course, even if poor. In this study we aimed to replicate the identification of a social and an academic dimension, to identify clusters of patients with different time patterns for each of the dimensions, and to test the validity of the clusters by comparing them on characteristics at start of treatment.
Other instruments
The Structured Clinical Interview for DSM-IV (SCID; Reference Spitzer, Williams and GibbonSpitzer et al, 1992) was used for diagnostic purposes. Symptom levels were measured using the Positive and Negative Syndrome Scale (PANSS; Reference Kay, Fiszbein and OplerKay et al, 1987). Eight neuropsychological tests were used for assessing neurocognitive function, described in detail by Friis et al (Reference Friis, Sundet and Rund2002). We identified five dimensions that explained 72% of the variance: working memory/fluency, executive function, verbal learning, impulsivity and motor speed (Reference Friis, Larsen and MelleFriis et al, 2003; Reference Rund, Melle and FriisRund et al, 2004).
Global functioning was measured by the Global Assessment of Functioning (GAF) scale (American Psychiatric Association, 1994); the scores were split into symptom scores (GAF-S) and function scores (GAF-F) to improve psychometric properties.
The duration of untreated psychosis was measured as the time from the first onset of positive psychotic symptoms (the first week with a PANSS score of 4 or more on at least one of the Positive Scale items 1, 3, 5, 6 or General Scale item 9) to the start of first adequate treatment of psychosis (i.e. admission to the study). Multiple sources, including personal interviews with patients and relatives, were used to ascertain the length of this period. Relatives were interviewed when the patient was unable to give reliable information.
Drug and alcohol misuse was measured with the Clinician Rating Scale (Reference Drake, Osher and NoordsyDrake et al, 1990). Social functioning (number of friends and participation in meaningful activities) during the year before start of treatment were measured with the Strauss-Carpenter scale (Reference Strauss and CarpenterStrauss & Carpenter, 1974).
All raters were trained in the use of study instruments by rating pre-prepared case notes and audio/videotapes before joining the study assessment teams. We achieved good reliability for all major variables such as PANSS, GAF, duration of untreated psychosis, and diagnosis (see Reference Friis, Larsen and MelleFriis et al, 2003). No specific reliability test was done for the PAS in the TIPS study, but a test-retest on a subsample of the patients (1993-1994) with a masked rater showed good reliability, with an intraclass coefficient of 0.84-0.87 (Reference Larsen, McGlashan and JohannessenLarsen et al, 1996b ).
Statistical analysis
Correlations were calculated as Pearson product moment coefficients, and chisquared tests were used for relationships between categorical variables. K-mean cluster analyses were used to identify groups. We chose to include patients who, owing to early start of psychosis, had missing scores for late adolescence and/or adulthood. (Technically, this was done by using the ‘delete cases pairwise’ option of the Statistical Package for the Social Sciences. We explored the alternative option ‘delete cases likewise’, which dropped all cases with one or more missing values: 65 for social function and 19 for academic. This option gave basically the same clustering, but with a considerable number of patients lost to further analysis.) To compare clusters we used t-tests or one-way analysis of variance.
RESULTS
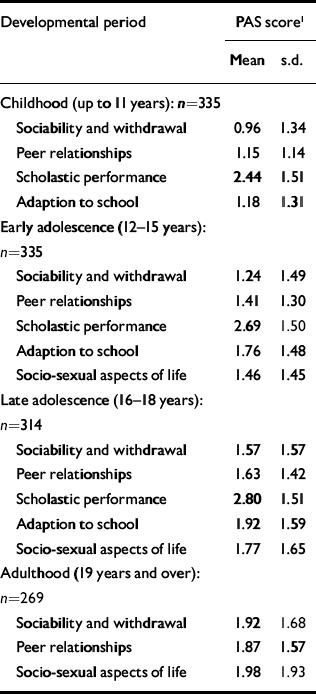
Table 1 lists the PAS scores on all items for each age period. The mean scores increase with increasing age, as do the standard deviations. The changes in mean scores indicate that for many patients premorbid functioning becomes worse as the patients approach the onset of psychosis. However, the increase in variability indicates that this deterioration is not uniform.
Table 1 Premorbid Adjustment Scale (PAS) scores in the four life periods
| Developmental period | PAS score1 | |
|---|---|---|
| Mean | s.d. | |
| Childhood (up to 11 years): n=335 | ||
| Sociability and withdrawal | 0.96 | 1.34 |
| Peer relationships | 1.15 | 1.14 |
| Scholastic performance | 2.44 | 1.51 |
| Adaption to school | 1.18 | 1.31 |
| Early adolescence (12-15 years): n=335 | ||
| Sociability and withdrawal | 1.24 | 1.49 |
| Peer relationships | 1.41 | 1.30 |
| Scholastic performance | 2.69 | 1.50 |
| Adaption to school | 1.76 | 1.48 |
| Socio-sexual aspects of life | 1.46 | 1.45 |
| Late adolescence (16-18 years): n=314 | ||
| Sociability and withdrawal | 1.57 | 1.57 |
| Peer relationships | 1.63 | 1.42 |
| Scholastic performance | 2.80 | 1.51 |
| Adaption to school | 1.92 | 1.59 |
| Socio-sexual aspects of life | 1.77 | 1.65 |
| Adulthood (19 years and over): n=269 | ||
| Sociability and withdrawal | 1.92 | 1.68 |
| Peer relationships | 1.87 | 1.57 |
| Socio-sexual aspects of life | 1.98 | 1.93 |
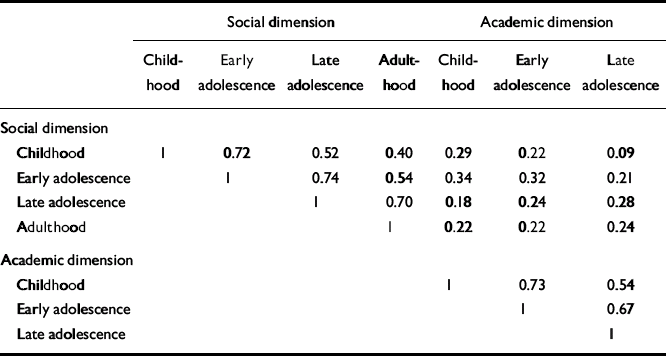
Pearson correlations between social withdrawal and peer relationships were strongly correlated (childhood 0.64, early adolescence 0.70, late adolescence 0.66, adulthood 0.69). So, too, were the correlations between adaptation to school and school performance (childhood 0.58, early adolescence 0.60, late adolescence 0.54). Because of this we calculated two sum dimension variables for each age level - one social (combining the social withdrawal and peer relationship items) and one academic (combining adaptation to school and school performance). In the PAS, school functioning and adaptation to school are not rated during adulthood and therefore the academic sum variable could not be calculated for this period. In Table 2, correlations between the social and academic dimensions are shown. For both dimensions there were strong correlations with the nearest time period (Pearson correlations 0.67-0.74), and an almost 50% reduced correlation with the next period (0.52-0.54) and (for social) another 50% reduction to the adult period. The social and academic dimensions proved to be weakly intercorrelated.
Table 2 Correlations between premorbid dimensions
| Social dimension | Academic dimension | ||||||
|---|---|---|---|---|---|---|---|
| Childhood | Early adolescence | Late adolescence | Adulthood | Childhood | Early adolescence | Late adolescence | |
| Social dimension | |||||||
| Childhood | 1 | 0.72 | 0.52 | 0.40 | 0.29 | 0.22 | 0.09 |
| Early adolescence | 1 | 0.74 | 0.54 | 0.34 | 0.32 | 0.21 | |
| Late adolescence | 1 | 0.70 | 0.18 | 0.24 | 0.28 | ||
| Adulthood | 1 | 0.22 | 0.22 | 0.24 | |||
| Academic dimension | |||||||
| Childhood | 1 | 0.73 | 0.54 | ||||
| Early adolescence | 1 | 0.67 | |||||
| Late adolescence | 1 | ||||||
We carried out separate K-mean cluster analyses for the social and academic dimensions. For both dimensions the analyses suggested four or five clusters. We chose the four-cluster solutions as they seemed to give the clearest picture (Figs 1 and 2). For both dimensions we defined a starting level as good (<1.50), intermediate (1.50-2.99) or poor (≥3.00). The courses were defined by change scores over the time periods as clearly stable (<1.00), slightly deteriorating (1.00-1.99) and clearly deteriorating (≥2.00). Clusters were labelled according to this definition, but as none of them occupied the ‘slightly deteriorating’ category, only the terms ‘stable’ and ‘deteriorating’ are used to describe course. Even though we do not have a normal control group, the PAS score of 0 is defined as normal. Furthermore, we feel confident that the naming of the groups is reasonable, taking into consideration that (for example) the good stable group on average had ‘many friends’ for all periods and the poor stable group per definition had almost ‘no friends’ for all periods.
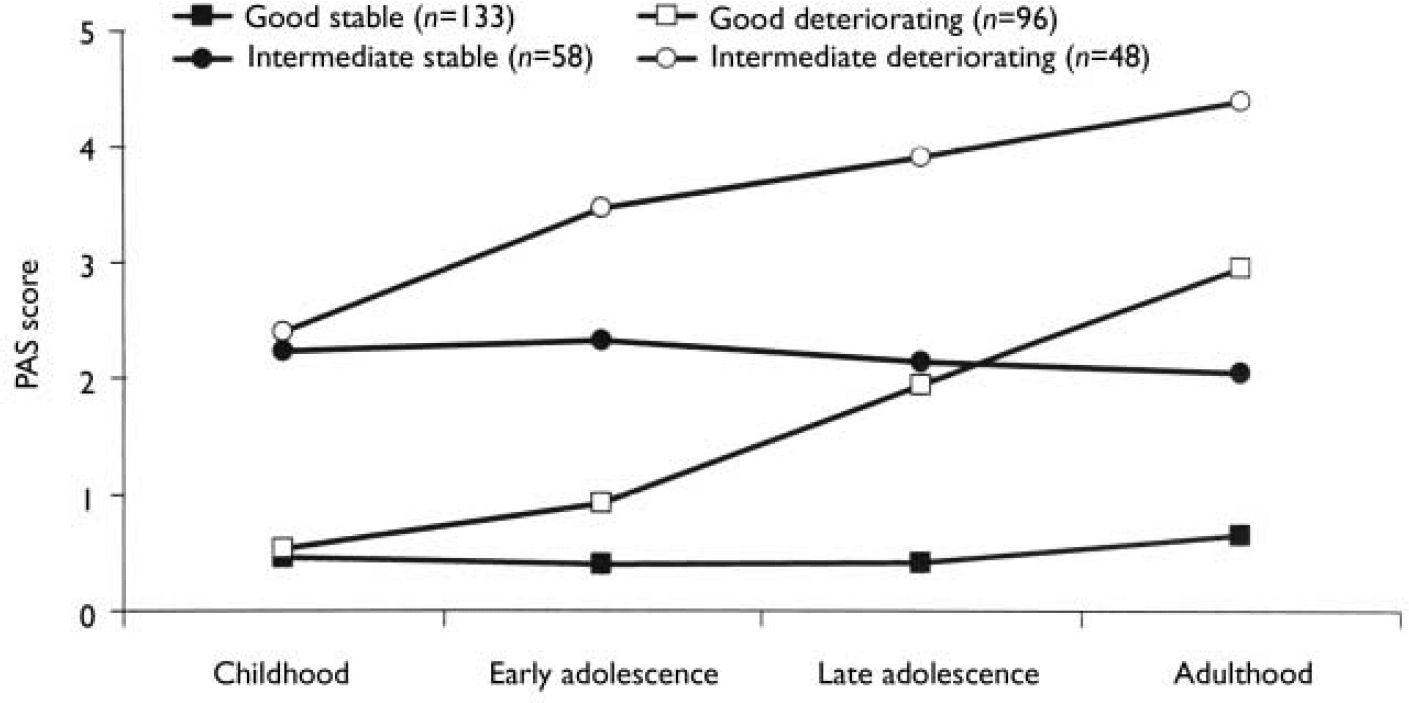
Fig. 1 Premorbid Adjustment Scale (PAS) scores for the social dimension clusters.
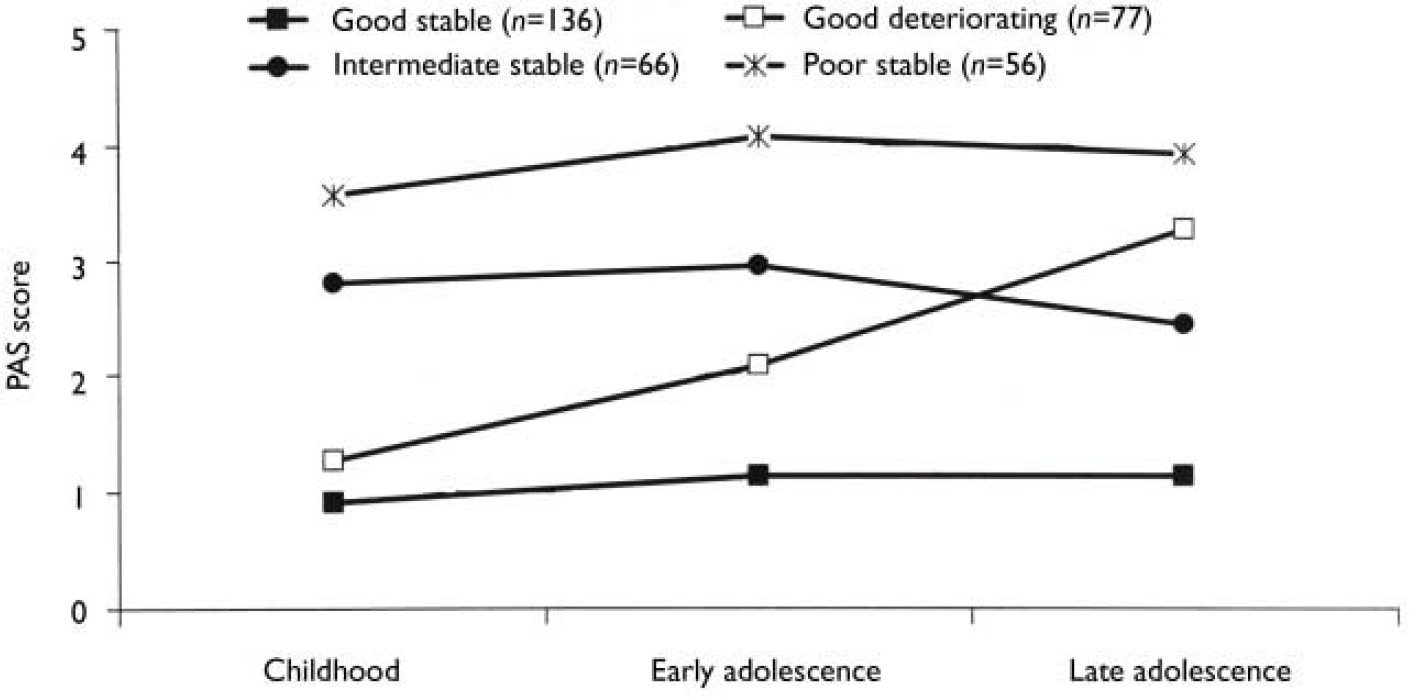
Fig. 2 Premorbid Adjustment Scale (PAS) scores for the academic dimension clusters.
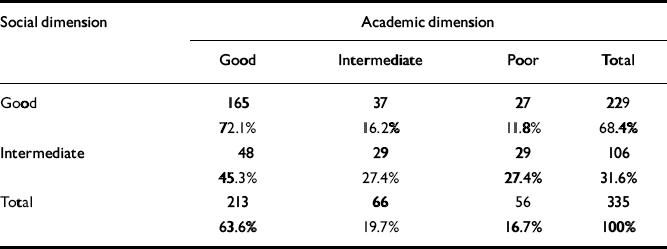
As seen in Table 3, there was a significant relationship between social and academic levels (χ2=23.3, d.f.=2; P<0.0005). However, for a considerable proportion of patients there was a discrepancy between the clusters of the two dimensions. For example, 12% of the patients with good social functioning had poor academic functioning. Although none of the patient groups had poor social functioning in childhood, nearly 17% of patients already had poor academic functioning at that age.
Table 3 Relationship between the levels of functioning in the academic and social dimensions
| Social dimension | Academic dimension | |||
|---|---|---|---|---|
| Good | Intermediate | Poor | Total | |
| Good | 165 | 37 | 27 | 229 |
| 72.1% | 16.2% | 11.8% | 68.4% | |
| Intermediate | 48 | 29 | 29 | 106 |
| 45.3% | 27.4% | 27.4% | 31.6% | |
| Total | 213 | 66 | 56 | 335 |
| 63.6% | 19.7% | 16.7% | 100% | |
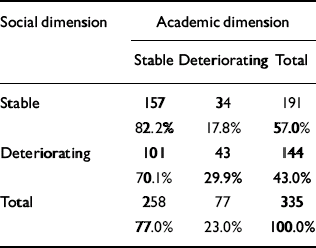
The distribution of course is given in Table 4. There is a significant relationship between the course of the two dimensions (χ2=6.75, d.f.=1; P=0.009), but a considerable number of patients had a stable course on one dimension and a deteriorating course on the other. It is worth noting that a deteriorating course was much less common for the academic dimension than for the social dimension, probably because many patients had a poor academic functioning as children.
Table 4 Relationship between the course of academic and social dimensions
| Social dimension | Academic dimension | ||
|---|---|---|---|
| Stable | Deteriorating | Total | |
| Stable | 157 | 34 | 191 |
| 82.2% | 17.8% | 57.0% | |
| Deteriorating | 101 | 43 | 144 |
| 70.1% | 29.9% | 43.0% | |
| Total | 258 | 77 | 335 |
| 77.0% | 23.0% | 100.0% | |
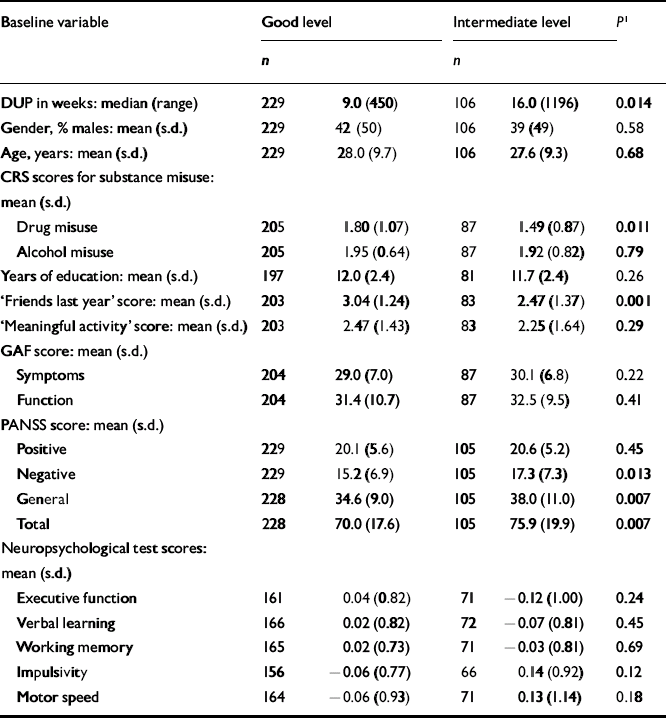
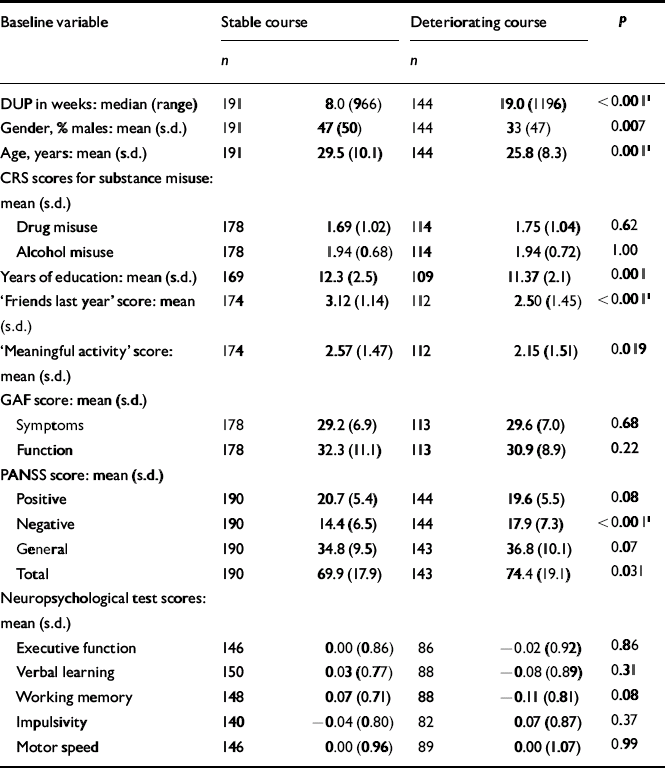
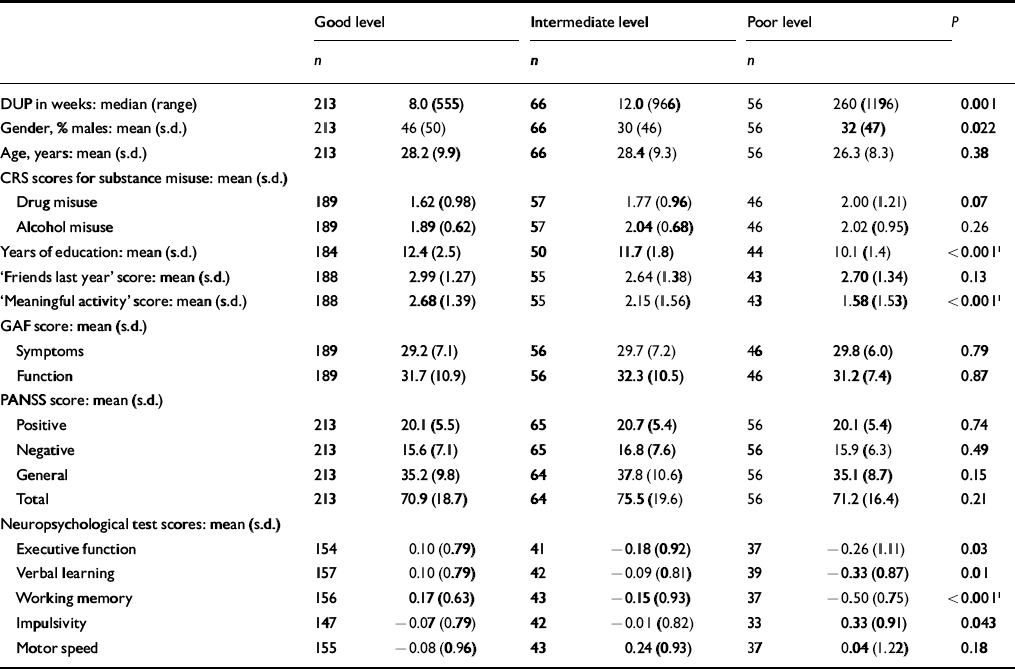
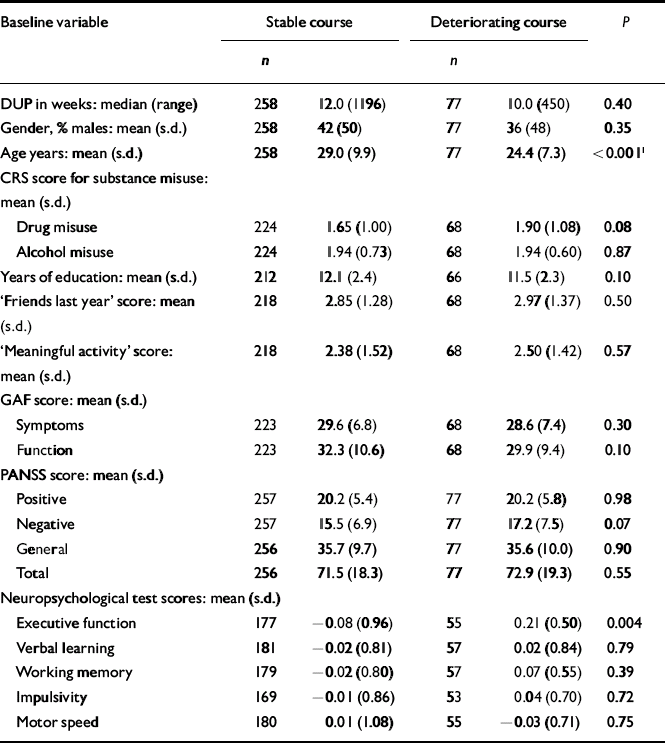
The next step was to conduct separate analyses of childhood levels and course for the social and academic clusters with baseline demographic, clinical and neurocognitive variables. Since multiple comparisons were made (76 in number) we chose a Bonferroni correction of P=0.0006 as equivalent to an uncorrected P<0.05 (Tables 5, 6, 7, 8). In Table 5 the baseline variables are related to childhood social cluster levels; no significant relationship was found. In Table 6 the baseline variables are related to social cluster course; patients with a deteriorating course had longer duration of untreated psychosis, lower age, fewer friends and higher negative PANSS scores. Tables 7 and 8 show similar analyses for the academic dimension: patients with a poorer level had fewer years of education, less meaningful activity and poorer working memory; patients with a deteriorating course had a lower age at study entry.
Table 5 Baseline variables by childhood social cluster levels
| Baseline variable | Good level | Intermediate level | P 1 | ||
|---|---|---|---|---|---|
| n | n | ||||
| DUP in weeks: median (range) | 229 | 9.0 (450) | 106 | 16.0 (1196) | 0.014 |
| Gender, % males: mean (s.d.) | 229 | 42 (50) | 106 | 39 (49) | 0.58 |
| Age, years: mean (s.d.) | 229 | 28.0 (9.7) | 106 | 27.6 (9.3) | 0.68 |
| CRS scores for substance misuse: mean (s.d.) | |||||
| Drug misuse | 205 | 1.80 (1.07) | 87 | 1.49 (0.87) | 0.011 |
| Alcohol misuse | 205 | 1.95 (0.64) | 87 | 1.92 (0.82) | 0.79 |
| Years of education: mean (s.d.) | 197 | 12.0 (2.4) | 81 | 11.7 (2.4) | 0.26 |
| ‘Friends last year’ score: mean (s.d.) | 203 | 3.04 (1.24) | 83 | 2.47 (1.37) | 0.001 |
| ‘Meaningful activity’ score: mean (s.d.) | 203 | 2.47 (1.43) | 83 | 2.25 (1.64) | 0.29 |
| GAF score: mean (s.d.) | |||||
| Symptoms | 204 | 29.0 (7.0) | 87 | 30.1 (6.8) | 0.22 |
| Function | 204 | 31.4 (10.7) | 87 | 32.5 (9.5) | 0.41 |
| PANSS score: mean (s.d.) | |||||
| Positive | 229 | 20.1 (5.6) | 105 | 20.6 (5.2) | 0.45 |
| Negative | 229 | 15.2 (6.9) | 105 | 17.3 (7.3) | 0.013 |
| General | 228 | 34.6 (9.0) | 105 | 38.0 (11.0) | 0.007 |
| Total | 228 | 70.0 (17.6) | 105 | 75.9 (19.9) | 0.007 |
| Neuropsychological test scores: mean (s.d.) | |||||
| Executive function | 161 | 0.04 (0.82) | 71 | − 0.12 (1.00) | 0.24 |
| Verbal learning | 166 | 0.02 (0.82) | 72 | − 0.07 (0.81) | 0.45 |
| Working memory | 165 | 0.02 (0.73) | 71 | − 0.03 (0.81) | 0.69 |
| Impulsivity | 156 | − 0.06 (0.77) | 66 | 0.14 (0.92) | 0.12 |
| Motor speed | 164 | − 0.06 (0.93) | 71 | 0.13 (1.14) | 0.18 |
Table 6 Baseline variables by social cluster course
| Baseline variable | Stable course | Deteriorating course | P | ||
|---|---|---|---|---|---|
| n | n | ||||
| DUP in weeks: median (range) | 191 | 8.0 (966) | 144 | 19.0 (1196) | <0.0011 |
| Gender, % males: mean (s.d.) | 191 | 47 (50) | 144 | 33 (47) | 0.007 |
| Age, years: mean (s.d.) | 191 | 29.5 (10.1) | 144 | 25.8 (8.3) | 0.0011 |
| CRS scores for substance misuse: mean (s.d.) | |||||
| Drug misuse | 178 | 1.69 (1.02) | 114 | 1.75 (1.04) | 0.62 |
| Alcohol misuse | 178 | 1.94 (0.68) | 114 | 1.94 (0.72) | 1.00 |
| Years of education: mean (s.d.) | 169 | 12.3 (2.5) | 109 | 11.37 (2.1) | 0.001 |
| ‘Friends last year’ score: mean (s.d.) | 174 | 3.12 (1.14) | 112 | 2.50 (1.45) | <0.0011 |
| ‘Meaningful activity’ score: mean (s.d.) | 174 | 2.57 (1.47) | 112 | 2.15 (1.51) | 0.019 |
| GAF score: mean (s.d.) | |||||
| Symptoms | 178 | 29.2 (6.9) | 113 | 29.6 (7.0) | 0.68 |
| Function | 178 | 32.3 (11.1) | 113 | 30.9 (8.9) | 0.22 |
| PANSS score: mean (s.d.) | |||||
| Positive | 190 | 20.7 (5.4) | 144 | 19.6 (5.5) | 0.08 |
| Negative | 190 | 14.4 (6.5) | 144 | 17.9 (7.3) | <0.0011 |
| General | 190 | 34.8 (9.5) | 143 | 36.8 (10.1) | 0.07 |
| Total | 190 | 69.9 (17.9) | 143 | 74.4 (19.1) | 0.031 |
| Neuropsychological test scores: mean (s.d.) | |||||
| Executive function | 146 | 0.00 (0.86) | 86 | − 0.02 (0.92) | 0.86 |
| Verbal learning | 150 | 0.03 (0.77) | 88 | − 0.08 (0.89) | 0.31 |
| Working memory | 148 | 0.07 (0.71) | 88 | − 0.11 (0.81) | 0.08 |
| Impulsivity | 140 | − 0.04 (0.80) | 82 | 0.07 (0.87) | 0.37 |
| Motor speed | 146 | 0.00 (0.96) | 89 | 0.00 (1.07) | 0.99 |
Table 7 Baseline variables by childhood academic cluster levels
| Good level | Intermediate level | Poor level | P | ||||
|---|---|---|---|---|---|---|---|
| n | n | n | |||||
| DUP in weeks: median (range) | 213 | 8.0 (555) | 66 | 12.0 (966) | 56 | 260 (1196) | 0.001 |
| Gender, % males: mean (s.d.) | 213 | 46 (50) | 66 | 30 (46) | 56 | 32 (47) | 0.022 |
| Age, years: mean (s.d.) | 213 | 28.2 (9.9) | 66 | 28.4 (9.3) | 56 | 26.3 (8.3) | 0.38 |
| CRS scores for substance misuse: mean (s.d.) | |||||||
| Drug misuse | 189 | 1.62 (0.98) | 57 | 1.77 (0.96) | 46 | 2.00 (1.21) | 0.07 |
| Alcohol misuse | 189 | 1.89 (0.62) | 57 | 2.04 (0.68) | 46 | 2.02 (0.95) | 0.26 |
| Years of education: mean (s.d.) | 184 | 12.4 (2.5) | 50 | 11.7 (1.8) | 44 | 10.1 (1.4) | <0.0011 |
| ‘Friends last year’ score: mean (s.d.) | 188 | 2.99 (1.27) | 55 | 2.64 (1.38) | 43 | 2.70 (1.34) | 0.13 |
| ‘Meaningful activity’ score: mean (s.d.) | 188 | 2.68 (1.39) | 55 | 2.15 (1.56) | 43 | 1.58 (1.53) | <0.0011 |
| GAF score: mean (s.d.) | |||||||
| Symptoms | 189 | 29.2 (7.1) | 56 | 29.7 (7.2) | 46 | 29.8 (6.0) | 0.79 |
| Function | 189 | 31.7 (10.9) | 56 | 32.3 (10.5) | 46 | 31.2 (7.4) | 0.87 |
| PANSS score: mean (s.d.) | |||||||
| Positive | 213 | 20.1 (5.5) | 65 | 20.7 (5.4) | 56 | 20.1 (5.4) | 0.74 |
| Negative | 213 | 15.6 (7.1) | 65 | 16.8 (7.6) | 56 | 15.9 (6.3) | 0.49 |
| General | 213 | 35.2 (9.8) | 64 | 37.8 (10.6) | 56 | 35.1 (8.7) | 0.15 |
| Total | 213 | 70.9 (18.7) | 64 | 75.5 (19.6) | 56 | 71.2 (16.4) | 0.21 |
| Neuropsychological test scores: mean (s.d.) | |||||||
| Executive function | 154 | 0.10 (0.79) | 41 | − 0.18 (0.92) | 37 | − 0.26 (1.11) | 0.03 |
| Verbal learning | 157 | 0.10 (0.79) | 42 | − 0.09 (0.81) | 39 | − 0.33 (0.87) | 0.01 |
| Working memory | 156 | 0.17 (0.63) | 43 | − 0.15 (0.93) | 37 | − 0.50 (0.75) | <0.0011 |
| Impulsivity | 147 | − 0.07 (0.79) | 42 | − 0.01 (0.82) | 33 | 0.33 (0.91) | 0.043 |
| Motor speed | 155 | − 0.08 (0.96) | 43 | 0.24 (0.93) | 37 | 0.04 (1.22) | 0.18 |
Table 8 Baseline variables by academic cluster course
| Baseline variable | Stable course | Deteriorating course | P | ||
|---|---|---|---|---|---|
| n | n | ||||
| DUP in weeks: median (range) | 258 | 12.0 (1196) | 77 | 10.0 (450) | 0.40 |
| Gender, % males: mean (s.d.) | 258 | 42 (50) | 77 | 36 (48) | 0.35 |
| Age years: mean (s.d.) | 258 | 29.0 (9.9) | 77 | 24.4 (7.3) | <0.0011 |
| CRS score for substance misuse: | |||||
| mean (s.d.) | |||||
| Drug misuse | 224 | 1.65 (1.00) | 68 | 1.90 (1.08) | 0.08 |
| Alcohol misuse | 224 | 1.94 (0.73) | 68 | 1.94 (0.60) | 0.87 |
| Years of education: mean (s.d.) | 212 | 12.1 (2.4) | 66 | 11.5 (2.3) | 0.10 |
| ‘Friends last year’ score: mean | 218 | 2.85 (1.28) | 68 | 2.97 (1.37) | 0.50 |
| (s.d.) | |||||
| ‘Meaningful activity’ score: | 218 | 2.38 (1.52) | 68 | 2.50 (1.42) | 0.57 |
| mean (s.d.) | |||||
| GAF score: mean (s.d.) | |||||
| Symptoms | 223 | 29.6 (6.8) | 68 | 28.6 (7.4) | 0.30 |
| Function | 223 | 32.3 (10.6) | 68 | 29.9 (9.4) | 0.10 |
| PANSS score: mean (s.d.) | |||||
| Positive | 257 | 20.2 (5.4) | 77 | 20.2 (5.8) | 0.98 |
| Negative | 257 | 15.5 (6.9) | 77 | 17.2 (7.5) | 0.07 |
| General | 256 | 35.7 (9.7) | 77 | 35.6 (10.0) | 0.90 |
| Total | 256 | 71.5 (18.3) | 77 | 72.9 (19.3) | 0.55 |
| Neuropsychological test scores: mean (s.d.) | |||||
| Executive function | 177 | − 0.08 (0.96) | 55 | 0.21 (0.50) | 0.004 |
| Verbal learning | 181 | − 0.02 (0.81) | 57 | 0.02 (0.84) | 0.79 |
| Working memory | 179 | − 0.02 (0.80) | 57 | 0.07 (0.55) | 0.39 |
| Impulsivity | 169 | − 0.01 (0.86) | 53 | 0.04 (0.70) | 0.72 |
| Motor speed | 180 | 0.01 (1.08) | 55 | − 0.03 (0.71) | 0.75 |
DISCUSSION
Patterns of premorbid functioning
Considering the premorbid period overall, our sample demonstrated a process of gradually worsening functioning on all variables as the onset of psychosis approached. This finding has been reported in other studies (Reference Kelley, Gilbertson and MoutonKelley et al, 1992; Reference Fennig, Putnam and BrometFennig et al, 1995). We also found that social and academic functioning form fairly independent dimensions of premorbid functioning; this finding too is a replication of other studies (Reference Van Kammen, Kelley and Gilbertsonvan Kammen et al, 1994; Reference Cannon, Jones and GilvarryCannon et al, 1997; Reference Allen, Kelley and MiyatakeAllen et al, 2001). Our central finding, however, was the identification of longitudinal patterns defined by different starting levels in childhood and different courses over development. In childhood, the patient groups varied more in academic than in social functioning, with a subgroup having poor academic functioning even at that stage. However, most patients had a fairly stable academic functioning over time, whereas a large group had a deteriorating social course. The patients with social deterioration were detected later (longer duration of untreated psychosis), had a lower age at admission, few friends and many negative symptoms. The level of social functioning was not significantly related to any baseline characteristics. In contrast, the level of academic functioning was strongly related to less years of education, less meaningful activity and poorer neuropsychological functioning (working memory). Deteriorating academic functioning was strongly related to younger age at admission.
We postulate that these patterns might be the product of two different but developmentally linked neurobiological processes. Levels of social and academic functioning in childhood may be determined early in life, largely by neurodevelopmental processes related to genetics and perinatal forces (Reference Murray and LewisMurray & Lewis, 1987). Levels of social and academic functioning that decline later on, especially in adolescence, may be determined by neuroregressive processes such as developmentally determined reductions in cortical synaptic connectivity (Reference McGlashan and HoffmanMcGlashan & Hoffman, 2000). The latter processes have traditionally been labelled as deterioration (dementia) and have been thought to arise from loss of brain neurons (neurodegeneration). We consider the latter term to be misleading, because more recent post-mortem studies have found loss of neuropil but no loss of neurons in the cortex of patients with schizophrenia (Reference Selemon, Rajkowska and Goldman-RakicSelemon et al, 1995; Reference Garey, Ong and PatelGarey et al, 1998; Reference Rajkowska, Selemon and Goldman-RakicRajkowska et al, 1998; Reference HarrisonHarrison, 1999; Reference Selemon and Goldman-RakicSelemon & Goldman-Rakic, 1999); we therefore prefer the term ‘neuroregression’ for this process.
Our results clearly illustrate that the heterogeneity of schizophrenia begins early, long before the onset of psychosis. The variety of longitudinal premorbid patterns is interesting from several points of view. In our fairly representative sample of patients with first-episode psychosis, as many as 40% reported ‘good stable’ social functioning. This is an argument against seeing schizophrenia as an entirely neurodevelopmental disorder with social dysfunction being an obligatory early manifestation (Reference RundRund, 1998; Reference Weinberger and McClureWeinberger & McClure, 2002). Second, it seems that having social problems, especially when they worsen over time, is a risk factor for late detection of psychosis. It may be that the social network has adapted to the person having problems and thus does not react when the transition to psychosis is taking place, or it may be that the person's social network is so small that the likelihood of someone becoming worried is greatly reduced.
We postulate from the observed premorbid patterns that the academic dimension is the more neurodevelopmentally determined. More than three-quarters of patients are stable over time in their childhood level of functioning, especially when that level is either poor or intermediate. This is consistent with the repeated finding that neurocognitive deficits are present in people with first-episode schizophrenia by the time of onset, and do not change much with time and ongoing disorder - the so-called static encephalopathy (Reference Hoff, Riordan and O'DonnellHoff et al, 1992; Reference Saykin, Shtasel and GurSaykin et al, 1994; Reference RundRund, 1998; Reference Fucetola, Seidman and KremenFucetola et al, 2000). The strong relationship between poor childhood academic functioning and poor working memory at baseline assessment supports the validity of this hypothesis. On the other hand, it appears that social functioning is more neuroregressively determined. Only 57% of patients are stable at their original childhood level of social functioning. Deterioration describes a relatively high fraction of the sample and affects both levels of childhood social functioning (intermediate and good). This suggests that it is important to assess young adults displaying a marked drop in social functioning as soon as possible for signs of early psychosis. The specific nature of these neurobiological processes, both static and progressive, require further elucidation, but premorbid adjustment patterns may provide direction to the inquiry. For example, social functioning should be targeted if one wishes to track the process of neuroregression.
Regarding gender differences, we have previously reported that men have poorer premorbid functioning and more deterioration, especially closer to the onset of psychosis (Reference Larsen, McGlashan and JohannessenLarsen et al, 1996b ). This has also been reported by other research teams (e.g. Reference Van Mastrigt and Addingtonvan Mastrigt & Addington, 2002). We did not replicate these findings in a much larger sample and with a new method for describing patterns of premorbid functioning. Our conclusion must be that the gender differences in premorbid functioning are not significant.
Limitations of the study
A weakness of the study is the retrospective description of the premorbid phase. Recall bias might be a problem insofar as the patients are experiencing their first psychotic episode at the time of the interview. It is also possible that the relatives will give a description of the premorbid period coloured by the present experience with psychosis. Another possible confound is the ‘halo effect’, in which the PAS rater's knowledge of the scores of previous periods influences the current rating. In this study we had no possibility of avoiding this problem.
In order to learn more about the validity of the premorbid dimensions and subtypes we describe, a follow-up is needed. We are conducting a follow-up study with 1-year, 2-year and 5-year assessment of all patients, and are also planning a 10-year follow-up. We report few significant correlations between the premorbid subtypes and both GAF and neurocognitive variables. Some of the correlations are on trend level, but we have avoided discussing trends because of the large number of analyses in the study. We also cannot rule out the possibility that the small size of some of the subgroups results in low statistical power.
Clinical implications
First and foremost, these data suggest that premorbid functioning is extremely heterogeneous, and that two separate dimensions - social and academic - should be considered. Most early intervention initiatives focus on rapid changes in symptoms, such as sudden social withdrawal or problems at school. Our findings emphasise the importance of considering the possibility of psychotic development in people with long-lasting social or academic dysfunction. Our study also supports the idea that schizophrenia is a heterogeneous disorder with neurodevelopmental and neuroregressive pathways to psychosis, processes that may be qualitatively distinct in their neurobiological origins but interactive in their contribution to the pathophysiology of schizophrenia.
Clinical Implications and Limitations
CLINICAL IMPLICATIONS
-
▪ Social and academic functioning constitute fairly independent dimensions of premorbid adjustment. On each dimension patients vary both in childhood level and in course.
-
▪ It is important to look for the presence of psychotic symptoms in people with long-lasting social or academic dysfunction (not only in cases with rapid changes).
-
▪ Schizophrenia is a heterogeneous disorder with both neurodevelopmental and neuroregressive pathways to psychosis.
LIMITATIONS
-
▪ Premorbid functioning was assessed retrospectively.
-
▪ Academic functioning was not assessed by a systematic study of school records or interviews with teachers.
-
▪ We did not have the possibility of testing our hypothesis regarding neuroregressive v. developmental pathways with more solidly biological assessments such as brain scanning.
Acknowledgements
This study was supported by the Norwegian National Research Council (133897/320), the Norwegian Department of Health and Social Affairs, the National Council for Mental Health/Health and Rehabilitation (1997/41 and 2002/306), Rogaland County and Oslo County (P.V., J.O.J., S.F., T.K.L., I.M., S.O.). It was also funded by the Theodore and Vada Stanley Foundation, the Regional Health Research Foundation for Eastern Region, Denmark; Roskilde County, Denmark, Helsefonden Lundbeck Pharma, Eli Lilly and Janssen - Cilag Pharmaceuticals (E.S., U.H.), and by a National Alliance for Research on Schizophrenia and Depression (NARSAD) Distinguished Investigator Award and NIMH grant MH-01654 (T.H.M.) and a NARSAD Young Investigator Award (T.K.L.).
This paper is part of the Tidlig Intervensjon ved Psykoser (TIPS; Early Treatment Intervention in Psychosis) project with the following research group: Thomas McGlashan, MD (Principal Investigator), Per Vaglum, MD (Principal Investigator), Svein Friis, MD, Ulrik Haahr, MD, Jan Olav Johannessen, MD, Tor K. Larsen, MD, Ingrid Melle, MD, Stein Opjordsmoen, MD, Bjørn Rishovd Rund, PhD and Erik Simonsen, MD.


eLetters
No eLetters have been published for this article.