1 Introduction
Recently, high-power single-frequency/narrow linewidth single-transverse-mode linearly polarized fiber lasers have become the highlight in various application regimes, such as gravitational wave detection, remote sensing, beam combining and nonlinear frequency conversion (NFC)[Reference Jeong, Nilsson, Sahu, Payne, Horley, Hickey and Turner1–Reference Fu, Shi, Feng, Zhang, Yang, Xu, Zhu, Norwood and Peyghambarian3]. However, due to small core and long fiber length, nonlinear effects, especially stimulated Brillouin scattering (SBS), become obstacles to the power scaling of single-frequency/narrow linewidth fiber amplifiers[Reference Fu, Shi, Feng, Zhang, Yang, Xu, Zhu, Norwood and Peyghambarian3, Reference Ma, Zhou, Ma, Su, Xu and Liu4]. Several techniques have been used to suppress SBS in fiber lasers and amplifiers, such as specially designed gain fiber[Reference Robin, Dajani and Pulford5], large mode area fiber with high dopant concentration[Reference Wang, Zhou, Xiao, Ma, Xu and Liu6], and temperature or strain gradient on gain fiber[Reference Gray, Liu, Walton, Wang, Li, Chen and Zenteno7–Reference Huang, Wu, Li, Li, Ma, Wang, Leng and Zhou9]. Another promising technique which can be used in conjunction with aforementioned methods is adopting the multifrequency-driven amplifier[Reference Zeringue, Vergien and Dajani10]. Generally, there are two kinds of way to achieve multifrequency laser system. One way is to spectrally combine severe single-frequency lasers through coupler or grating (which is called multitone laser generally)[Reference Wang, Leng, Zhou, Ma, Xu and Liu11] and the other way is to phase modulate a single-frequency laser to obtain multiple-frequency components from one seed source[Reference Flores, Lu, Robin, Naderi, Vergien and Dajani12]. Compared with the multifrequencies from different lasers, the phase-modulated signal is generated from the identical seed laser; therefore, this multifrequency laser preserves the coherent property to some extent[Reference Han, Xu and Liu13] and the frequency separation is well stable and continuously tunable from MHz to GHz. As a result, precise optical path control of the amplifier chain is not necessary in a coherent beam combining (CBC) system[Reference Han, Xu and Liu13] and this multifrequency laser can obtain a higher power than single-frequency source while not affecting the lock of optical resonator in a second harmonic generation (SHG) system[Reference Zhang, Jiang, Cui, Hu and Feng14].
For the triple-frequency laser, over 300 W laser power with large mode area (LMA) Yb-doped fiber of
![]() $30~\unicode[STIX]{x03BC}\text{m}$
core diameter was achieved and it was used in a CBC system obtaining more than 85% of the interference pattern[Reference Wang, Zhou, Leng, Du and Xu15]. Combining two tone phase-modulated signals to generate nine frequencies, Engin et al. reported a 1 kW Yb-doped fiber amplifier with a
$30~\unicode[STIX]{x03BC}\text{m}$
core diameter was achieved and it was used in a CBC system obtaining more than 85% of the interference pattern[Reference Wang, Zhou, Leng, Du and Xu15]. Combining two tone phase-modulated signals to generate nine frequencies, Engin et al. reported a 1 kW Yb-doped fiber amplifier with a
![]() $35~\unicode[STIX]{x03BC}\text{m}$
core diameter LMA fiber[Reference Engin, Lu, Akbulut, McIntosh, Verdun and Gupta16]. However, complicated mode-control technology is needed due to using multimode fibers and high-order spatial modes would be existed in the output laser. In addition, the polarization states of the laser outputs are uncertain, as a result degenerating the beam quality of CBC and the efficiency of NFC[Reference Goodno, Shih and Rothenberg17, Reference Zhang, Hu, Wang and Feng18]. Due to higher SBS gain in polarization maintaining (PM) and small mode area fiber, power scaling of PM and single-mode narrow linewidth amplifiers is more challenging.
$35~\unicode[STIX]{x03BC}\text{m}$
core diameter LMA fiber[Reference Engin, Lu, Akbulut, McIntosh, Verdun and Gupta16]. However, complicated mode-control technology is needed due to using multimode fibers and high-order spatial modes would be existed in the output laser. In addition, the polarization states of the laser outputs are uncertain, as a result degenerating the beam quality of CBC and the efficiency of NFC[Reference Goodno, Shih and Rothenberg17, Reference Zhang, Hu, Wang and Feng18]. Due to higher SBS gain in polarization maintaining (PM) and small mode area fiber, power scaling of PM and single-mode narrow linewidth amplifiers is more challenging.
In this paper, we present a triple-frequency, linearly polarized, all-fiber amplifier with a
![]() $10~\unicode[STIX]{x03BC}\text{m}$
core diameter PM active fiber. This kind of fiber is a single-transverse-mode fiber which does not need mode-control technology. Triple-frequency seed with equal amplitude is generated through phase modulating a single-frequency seed by sinusoidal signal and then it is amplified by a master oscillator power amplifier (MOPA) structure. In addition, a designed step-distribution strain is applied on the active fiber in the main amplifier for SBS suppression. Considering the overlap among the broaden SBS spectra of the three frequencies, we analyze the influence of the frequency separation on the effect of SBS suppression. When the separation of 1.6 GHz is chosen, up to 302 W output power is achieved and the SBS threshold is scaled up to 12 dB compared to the single-frequency amplification. The polarization extinction ratio (PER) of higher than 18 dB and a beam quality factor
$10~\unicode[STIX]{x03BC}\text{m}$
core diameter PM active fiber. This kind of fiber is a single-transverse-mode fiber which does not need mode-control technology. Triple-frequency seed with equal amplitude is generated through phase modulating a single-frequency seed by sinusoidal signal and then it is amplified by a master oscillator power amplifier (MOPA) structure. In addition, a designed step-distribution strain is applied on the active fiber in the main amplifier for SBS suppression. Considering the overlap among the broaden SBS spectra of the three frequencies, we analyze the influence of the frequency separation on the effect of SBS suppression. When the separation of 1.6 GHz is chosen, up to 302 W output power is achieved and the SBS threshold is scaled up to 12 dB compared to the single-frequency amplification. The polarization extinction ratio (PER) of higher than 18 dB and a beam quality factor
![]() $M^{\text{2}}$
of 1.04 are obtained at maximum output power. To the best of our knowledge, this is the highest output power of multifrequency laser using a single-mode PM fiber.
$M^{\text{2}}$
of 1.04 are obtained at maximum output power. To the best of our knowledge, this is the highest output power of multifrequency laser using a single-mode PM fiber.
2 Experimental setup
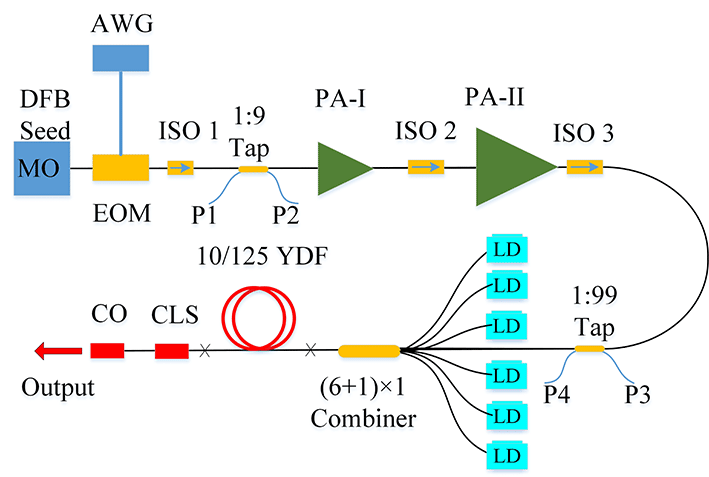
The experimental setup of the multistage amplifier is illustrated in Figure 1, based on the fiber MOPA structure. A single-frequency linearly polarized seed laser with wavelength of 1064 nm is followed by an LiNbO
![]() $_{3}$
electro-optic phase modulator (EOPM), which is driven by an arbitrary waveform generator (AWG). A 10% coupler is placed after the EOPM to monitor the modulated signal. The laser is amplified to 3 W by two-stage PM Yb-doped double-cladding fiber (YDF) pre-amplifier chain. Between the pre-amplifier and the main amplifier, a high-power PM isolator (ISO3) is inserted to block off the backward powers from the main amplifier and a coupler with 99:1 coupling ratio is used to monitor the power and spectrum of the backscattering light. The 3 W signal laser and 370 W pump power from six laser diodes (LDs) with 976 nm central wavelength are combined to the gain fiber through a
$_{3}$
electro-optic phase modulator (EOPM), which is driven by an arbitrary waveform generator (AWG). A 10% coupler is placed after the EOPM to monitor the modulated signal. The laser is amplified to 3 W by two-stage PM Yb-doped double-cladding fiber (YDF) pre-amplifier chain. Between the pre-amplifier and the main amplifier, a high-power PM isolator (ISO3) is inserted to block off the backward powers from the main amplifier and a coupler with 99:1 coupling ratio is used to monitor the power and spectrum of the backscattering light. The 3 W signal laser and 370 W pump power from six laser diodes (LDs) with 976 nm central wavelength are combined to the gain fiber through a
![]() $(6+1)\times 1$
fused fiber combiner. The gain fiber in the main amplifier is 3.7 m PM YDF with a core/inner cladding diameter of
$(6+1)\times 1$
fused fiber combiner. The gain fiber in the main amplifier is 3.7 m PM YDF with a core/inner cladding diameter of
![]() $10/125~\unicode[STIX]{x03BC}\text{m}$
and numerical aperture (NA) of
$10/125~\unicode[STIX]{x03BC}\text{m}$
and numerical aperture (NA) of
![]() $0.075/0.46$
. About 0.5 m long PM cladding light stripper (CLS) and a high-power fiber end-cap are successively fused to the active fiber for residual cladding light stripping and power delivering. The delivering laser is then collimated into free space by a high-power beam collimator. A beam splitter is used to split 0.1% of the collimated laser to an optical spectrum analyzer (OSA) and a Fabry–Perot interferometer (FPI) to detect the output spectrum and the frequency characteristic.
$0.075/0.46$
. About 0.5 m long PM cladding light stripper (CLS) and a high-power fiber end-cap are successively fused to the active fiber for residual cladding light stripping and power delivering. The delivering laser is then collimated into free space by a high-power beam collimator. A beam splitter is used to split 0.1% of the collimated laser to an optical spectrum analyzer (OSA) and a Fabry–Perot interferometer (FPI) to detect the output spectrum and the frequency characteristic.

Figure 1. Experimental setup of monolithic fiber amplifier system (MO: master oscillator; PA, pre-amplifier; CO, collimator).
3 Results and discussion
3.1 Triple-frequency generation
To obtain a triple-frequency and linearly polarized seed laser, the single-frequency seed is coupled into a PM LiNO
![]() $_{3}$
phase modulator, which is driven by the modulation signal generated from the AWG. Supposing the single-frequency signal is
$_{3}$
phase modulator, which is driven by the modulation signal generated from the AWG. Supposing the single-frequency signal is
The modulation signal with mod depth
![]() $r$
and modulation frequency
$r$
and modulation frequency
![]() $v_{m}$
is given by
$v_{m}$
is given by
The output optical signal exhibits the following form:
 $$\begin{eqnarray}\displaystyle E(t) & = & \displaystyle E_{0}\cos [2\unicode[STIX]{x1D70B}v_{0}t+\unicode[STIX]{x1D711}(t)]\nonumber\\ \displaystyle & = & \displaystyle E_{0}\left\{J_{0}(r)\cos (2\unicode[STIX]{x1D70B}v_{0}t)+J_{1}(r)\cos [2\unicode[STIX]{x1D70B}(v_{0}+v_{m})t]\right.\nonumber\\ \displaystyle & & \displaystyle \left.-\,J_{1}(r)\cos [2\unicode[STIX]{x1D70B}(v_{0}-v_{m})t]+\cdots \,\right\},\end{eqnarray}$$
where
![]() $v_{0}$
is the optical frequency of the input signal and
$v_{0}$
is the optical frequency of the input signal and
![]() $J_{n}(r)$
is the
$J_{n}(r)$
is the
![]() $n$
th of Bessel function[Reference Zhang, Cui, Liu, Zhou and Feng8].
$n$
th of Bessel function[Reference Zhang, Cui, Liu, Zhou and Feng8].
In order to observe the sidebands of phase-modulated seed, the fundamental frequency signal of 200 MHz is taking as an example. When the mod depth
![]() $r$
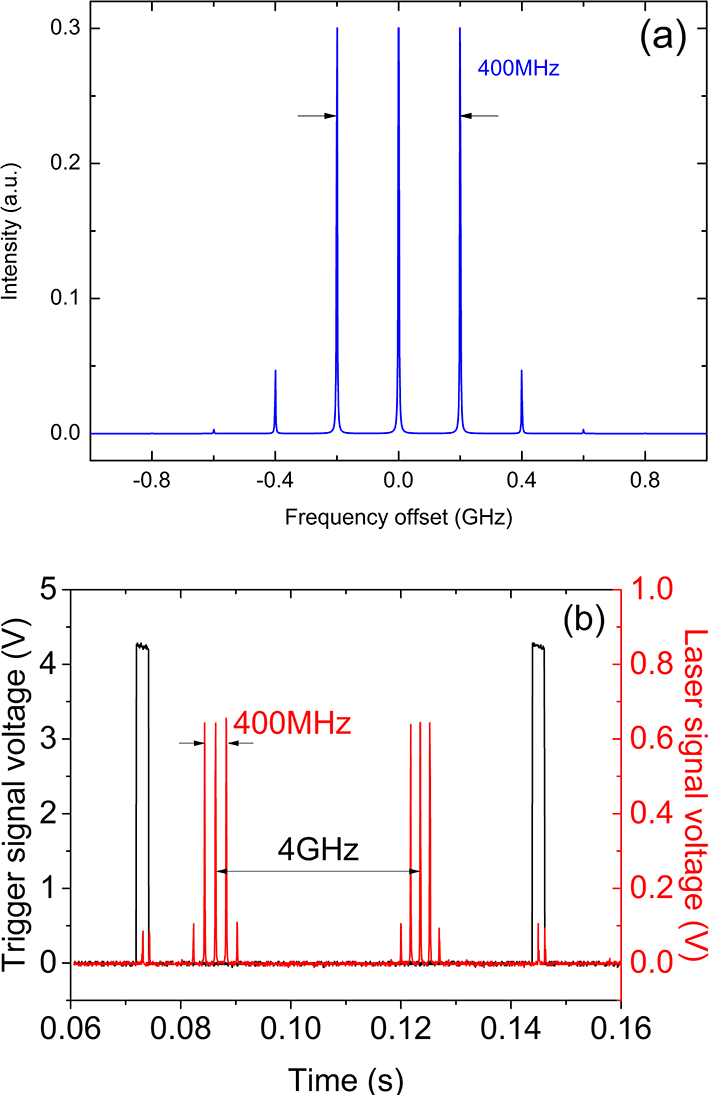
is 1.435, we simulate the lower 3 order modulated sidebands with the single frequency of 2 MHz in Figure 2(a). In experiment, the spectrum of modulated light is measured by an FPI with a free spectral range (FSR) of 4 GHz and a resolution of 2 MHz, as shown in Figure 2(b). The black line is a trigger signal of the saw-tooth wave which is used to repetitively scan the FPI cavity in order to sweep through at least one FSR of the interferometer. Three separate peaks with a frequency gap of 200 MHz which is displayed by the red line correspond to the frequencies of the phase-modulated signal. A triple frequency with equal amplitude can be achieved when the modulation voltage is set to 1.61 V (mod depth of 1.435 at half-wave voltage of 5 V) and the intensity ratio to other sidebands is beyond 8 dB. Compared with Figure 2(a), the experimental spectrum pattern of three equal-amplitude spectral lines agrees well with the theoretical result.
$r$
is 1.435, we simulate the lower 3 order modulated sidebands with the single frequency of 2 MHz in Figure 2(a). In experiment, the spectrum of modulated light is measured by an FPI with a free spectral range (FSR) of 4 GHz and a resolution of 2 MHz, as shown in Figure 2(b). The black line is a trigger signal of the saw-tooth wave which is used to repetitively scan the FPI cavity in order to sweep through at least one FSR of the interferometer. Three separate peaks with a frequency gap of 200 MHz which is displayed by the red line correspond to the frequencies of the phase-modulated signal. A triple frequency with equal amplitude can be achieved when the modulation voltage is set to 1.61 V (mod depth of 1.435 at half-wave voltage of 5 V) and the intensity ratio to other sidebands is beyond 8 dB. Compared with Figure 2(a), the experimental spectrum pattern of three equal-amplitude spectral lines agrees well with the theoretical result.
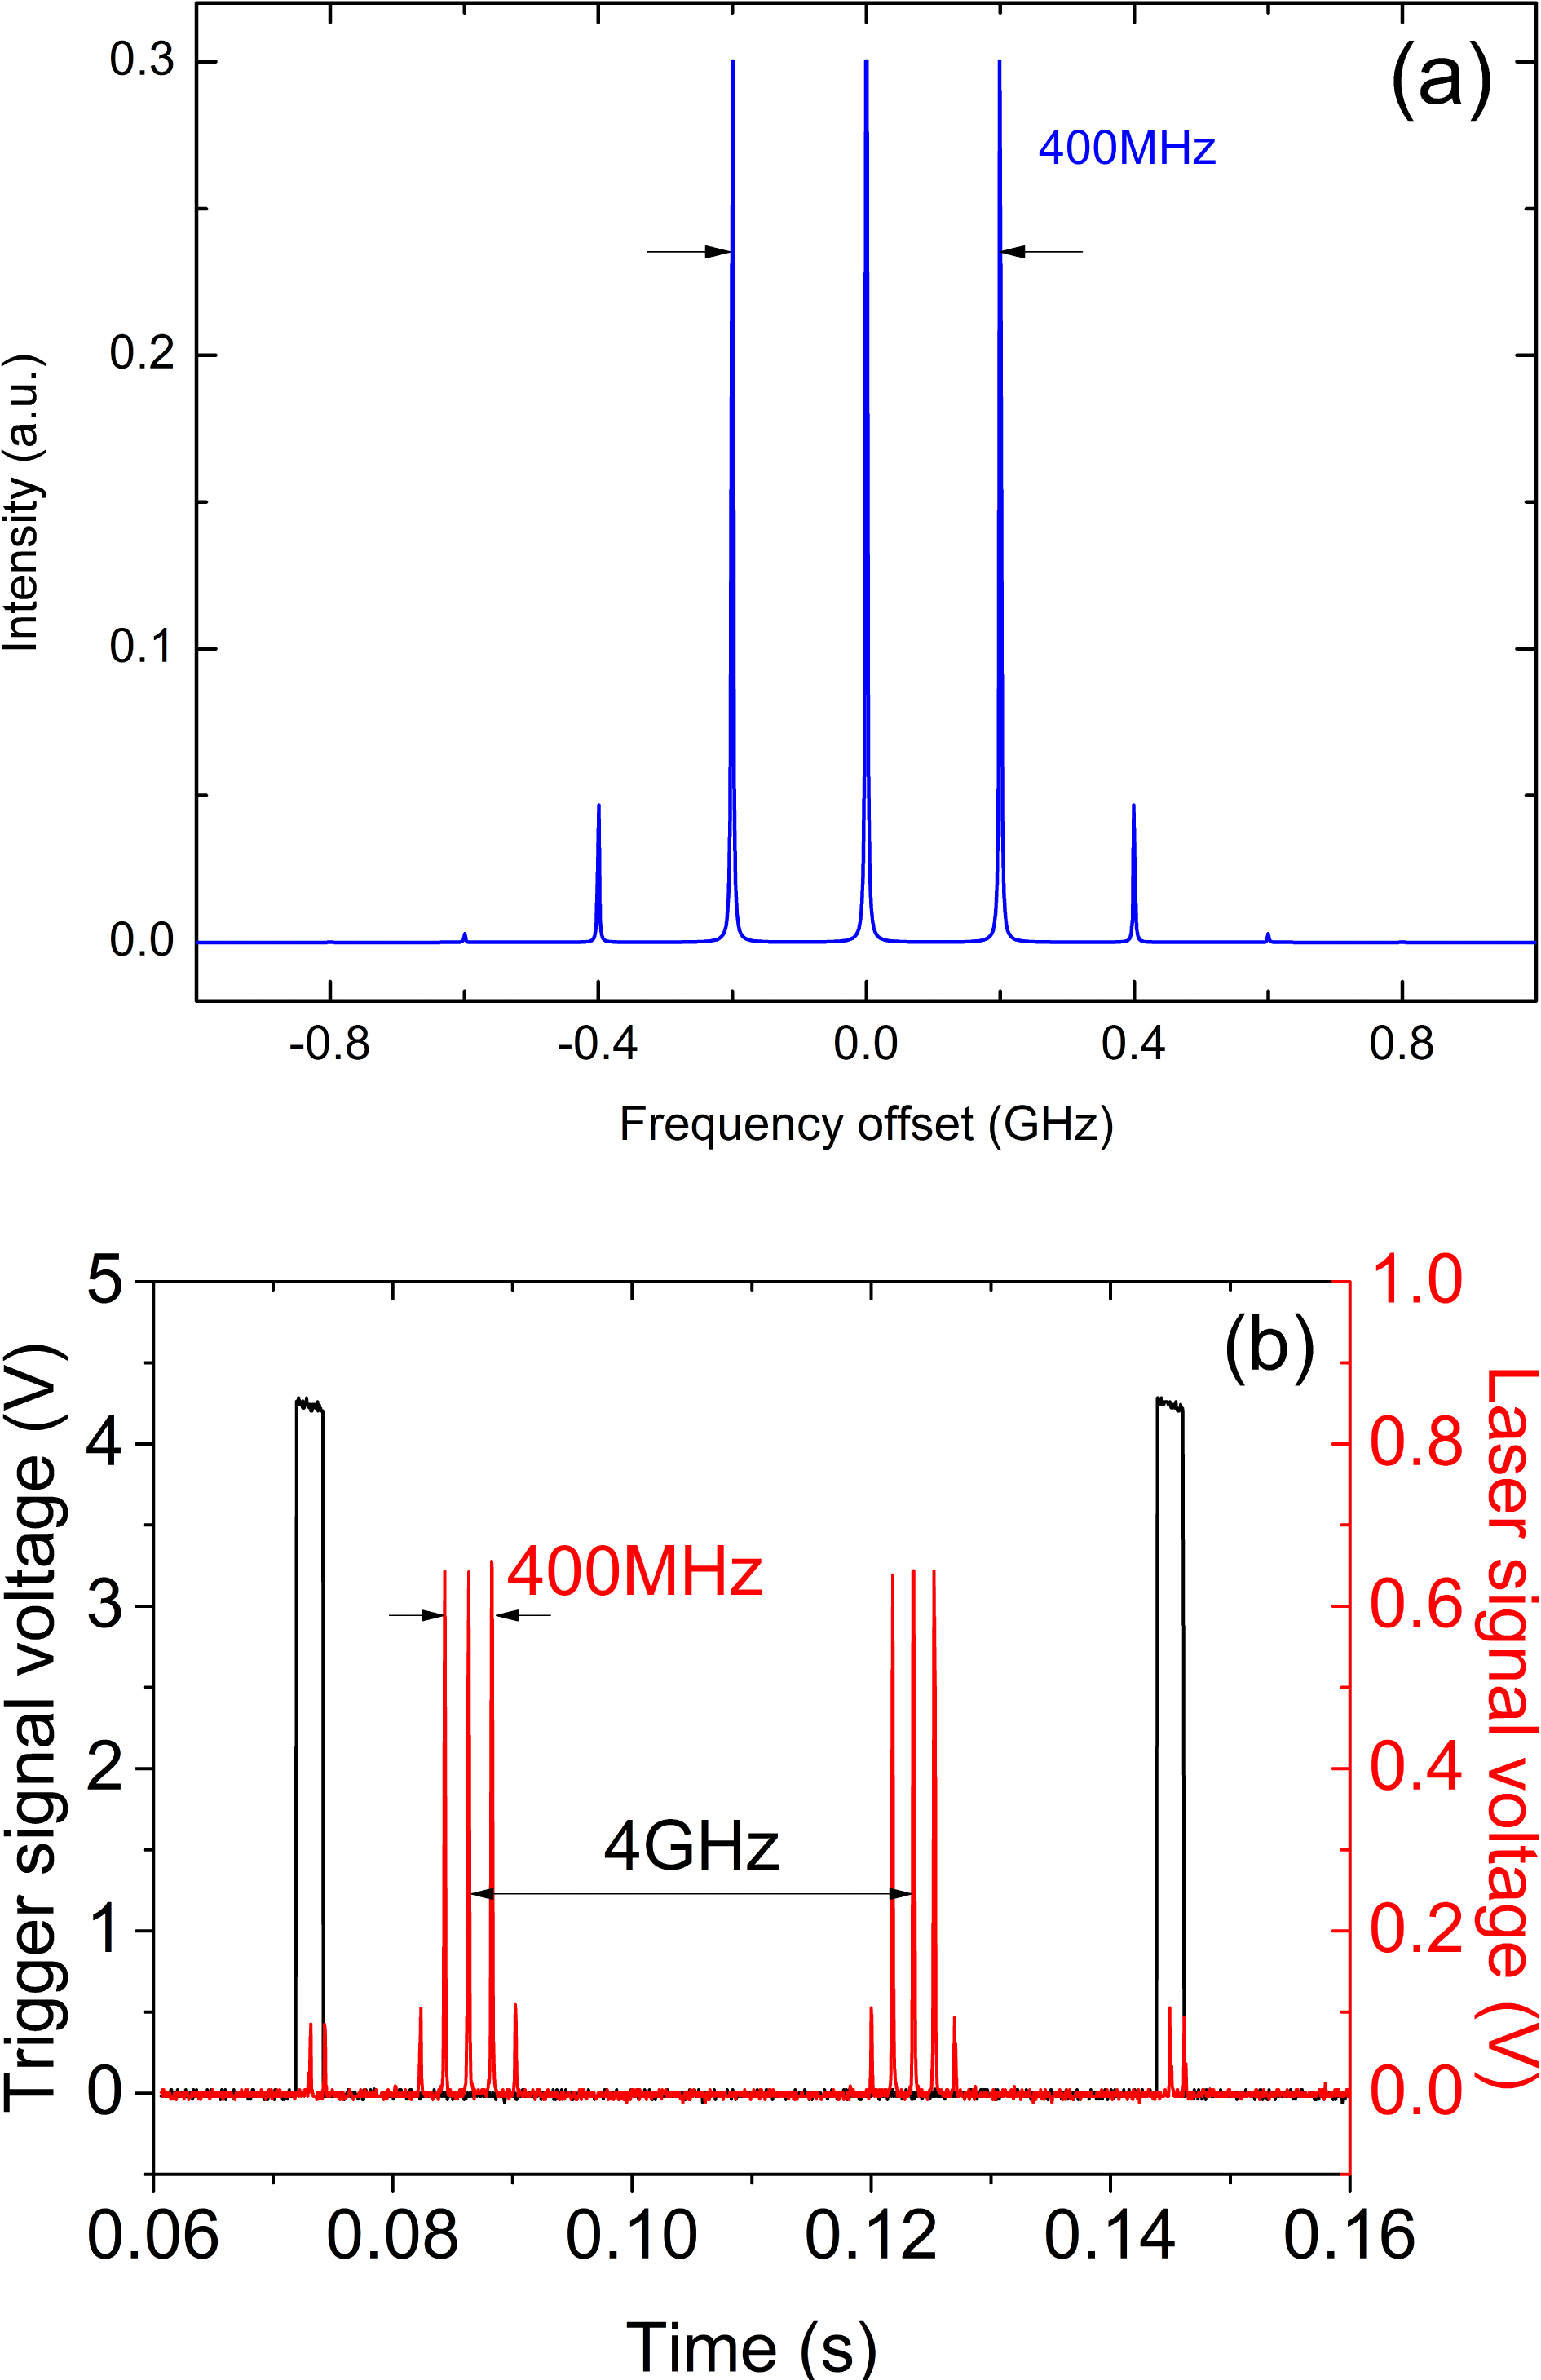
Figure 2. (a) Simulated spectra and (b) experimental spectra of phase-modulated triple-frequency seed laser.
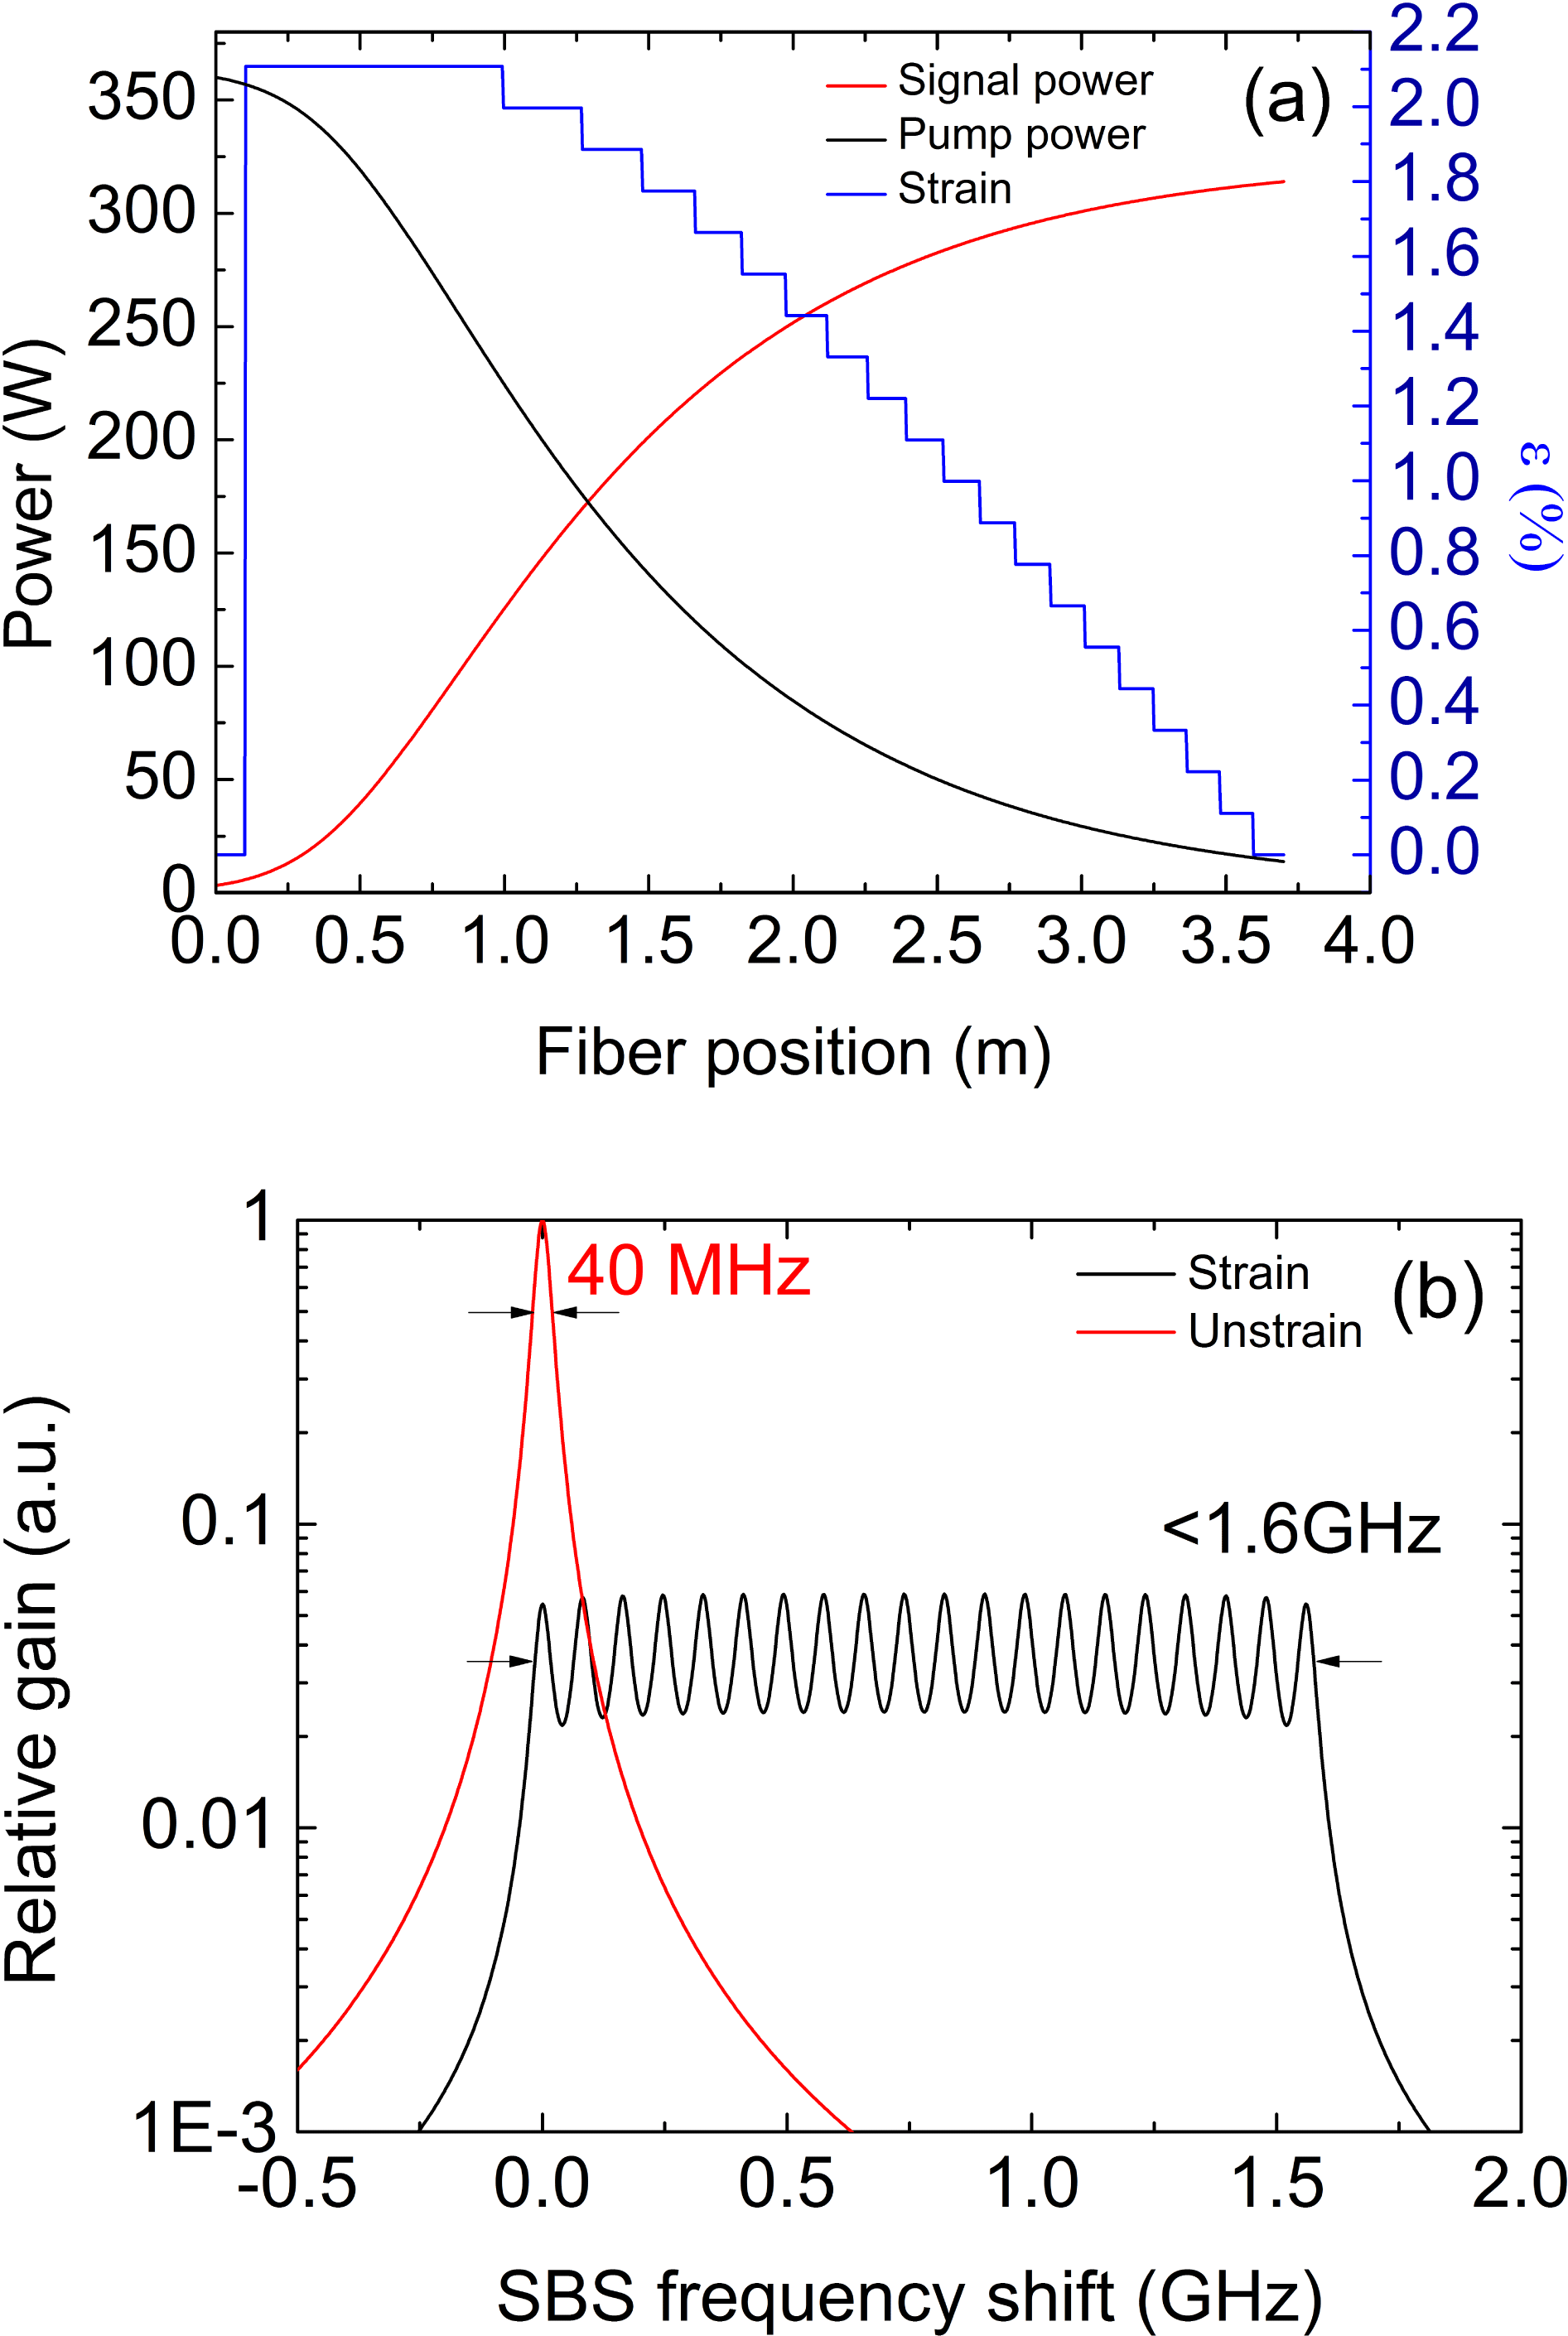
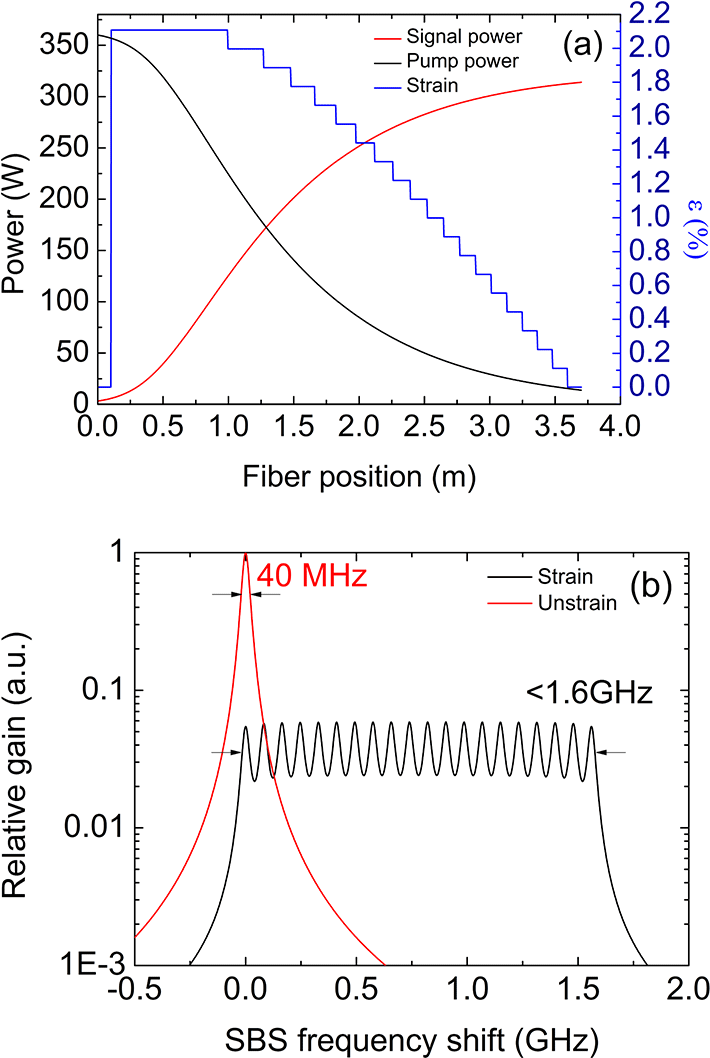
Figure 3. (a) Strain distribution along the active fiber. (b) SBS gain spectra of strained and unstrained fiber.
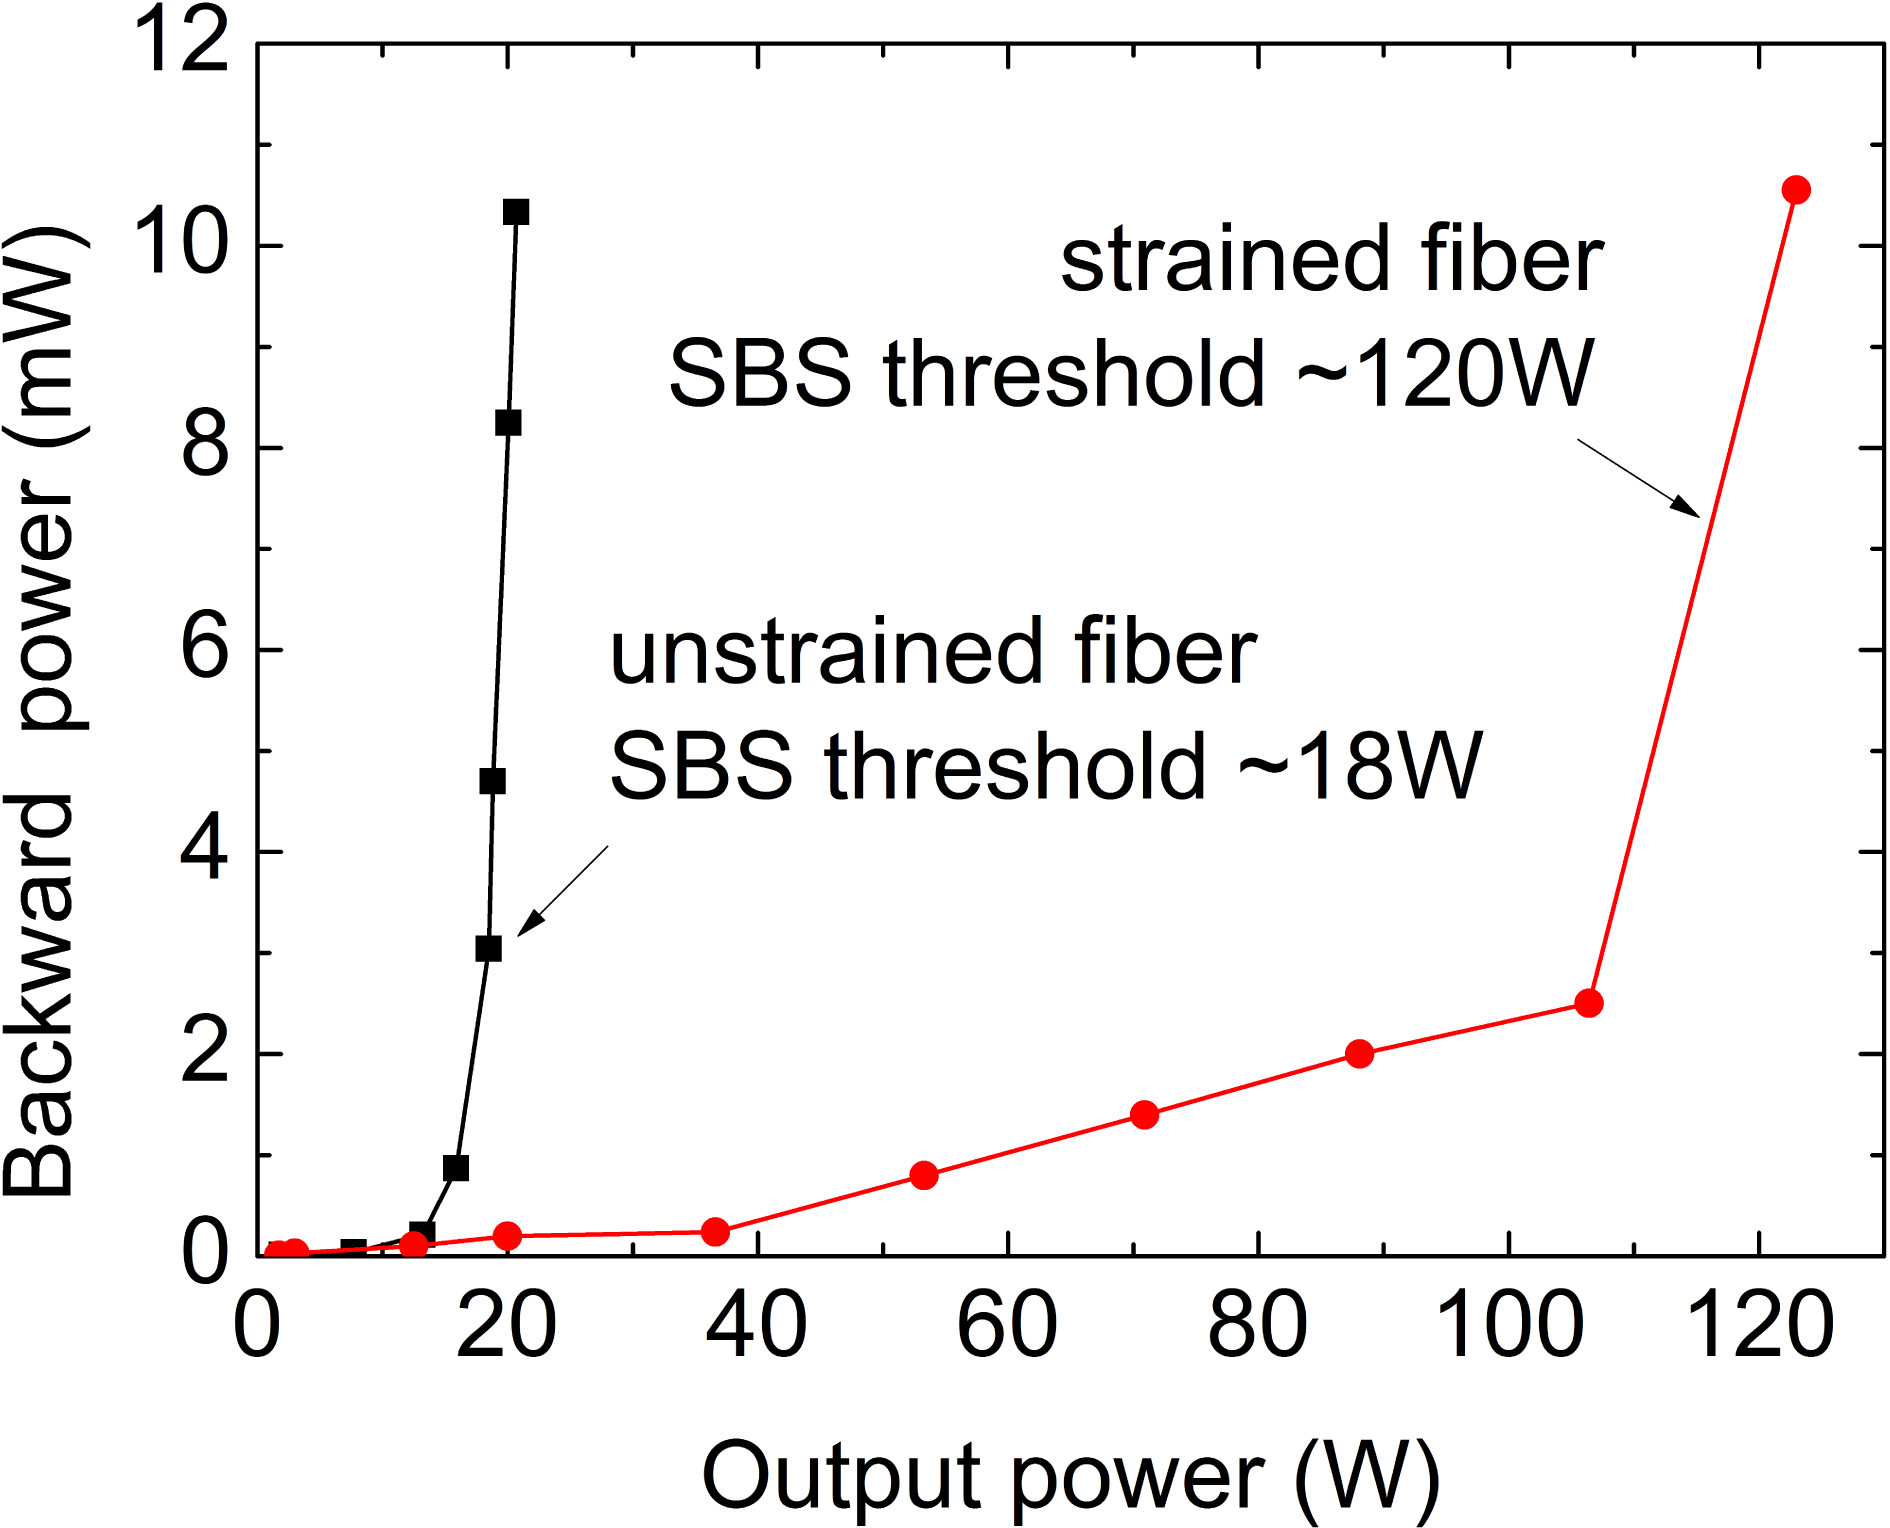
Figure 4. Backward power as a function of the output power.
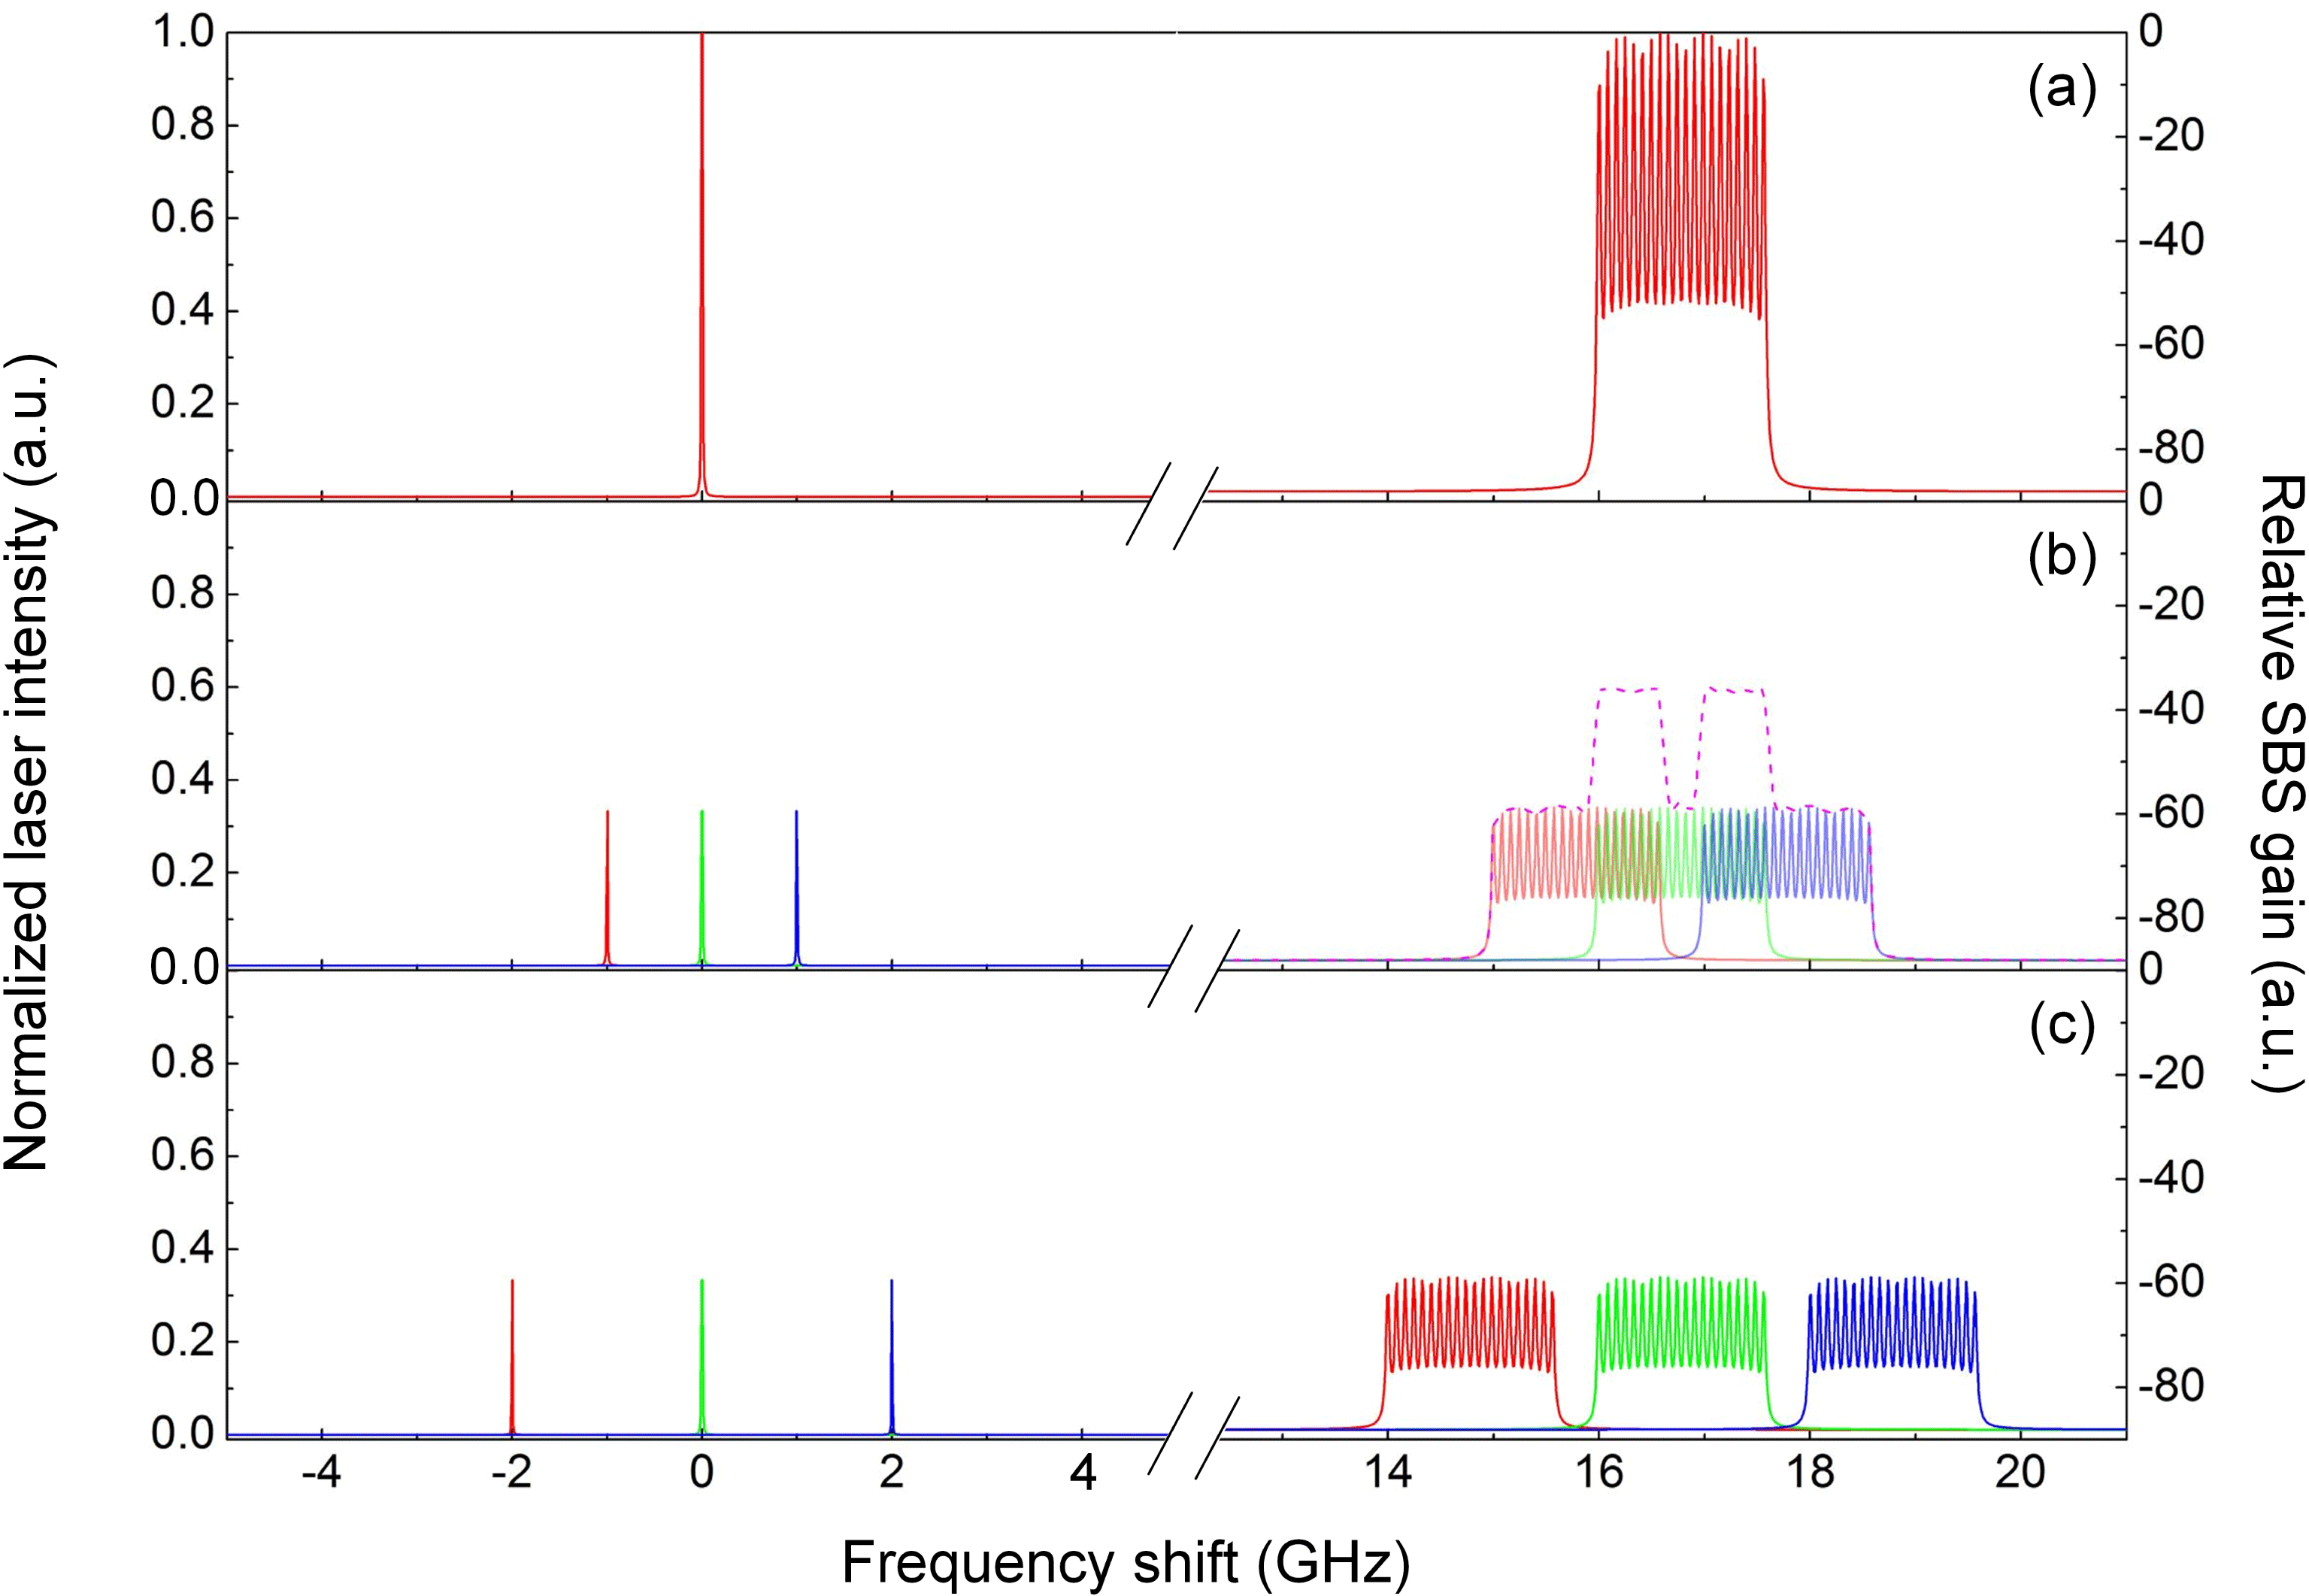
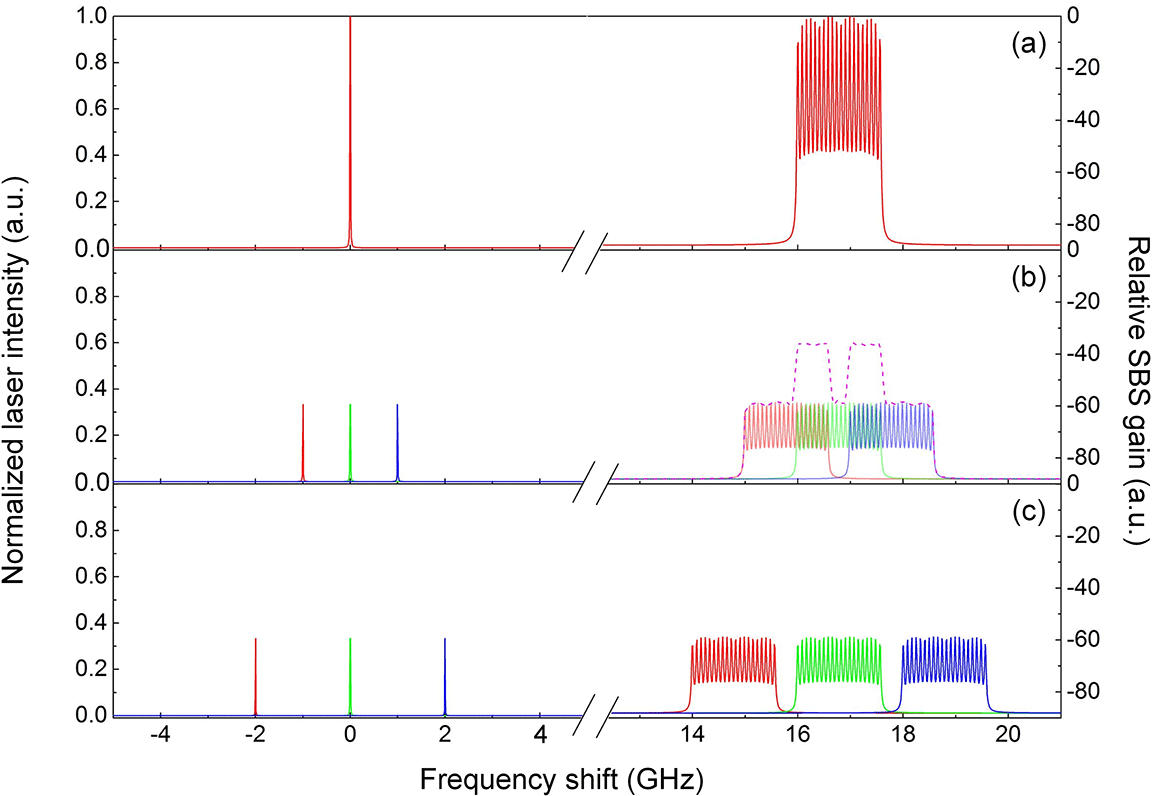
Figure 5. Overlap of the SBS gain spectra (a) without the modulation frequency; (b) with the modulation frequency of 1 GHz; (c) with the modulation frequency of 2 GHz [the short dashed line in (b) represents envelope of the total SBS gain].
3.2 Longitudinally step-distributed strain application
In the main amplifier, 20 steps of longitudinally step-distributed strains are applied to the gain fiber. Followed with the analysis of Ref. [Reference Zhang, Cui, Liu, Zhou and Feng8], the active fiber is divided into 21 segments with the start and end parts unstrained. The maximum strain of 1.9 kg is applied to the second part and the strain tension of 0.1 kg is decreased gradually until fiber end. The shift of peak SBS frequency with applied strain can be expressed as
where
![]() $v_{B}(0)$
is the peak SBS frequency shift with zero strain, which is about 16 GHz in a silicon-based fiber.
$v_{B}(0)$
is the peak SBS frequency shift with zero strain, which is about 16 GHz in a silicon-based fiber.
![]() $C_{s}$
is the coefficient with a value of 4.6.
$C_{s}$
is the coefficient with a value of 4.6.
![]() $\unicode[STIX]{x1D700}$
is the applied strain.
$\unicode[STIX]{x1D700}$
is the applied strain.
![]() $\unicode[STIX]{x1D70E}$
is the normal stress.
$\unicode[STIX]{x1D70E}$
is the normal stress.
![]() $E$
is the Young’s modulus of the silica.
$E$
is the Young’s modulus of the silica.
![]() $S$
and
$S$
and
![]() $F$
are the cross-sectional area and the imposed force of the active fiber. The effective SBS gain spectrum with a changed peak SBS frequency shift can be written as
$F$
are the cross-sectional area and the imposed force of the active fiber. The effective SBS gain spectrum with a changed peak SBS frequency shift can be written as
where
![]() $g_{0}$
is the peak SBS gain coefficient.
$g_{0}$
is the peak SBS gain coefficient.
![]() $\unicode[STIX]{x1D6E5}v_{B}$
is the SBS gain linewidth with a value of 40 MHz.
$\unicode[STIX]{x1D6E5}v_{B}$
is the SBS gain linewidth with a value of 40 MHz.
The calculated strain distribution and signal power along the active fiber are calculated as shown in Figure 3(a). The corresponding SBS shifts due to the strain gradient and the SBS gain spectra without strain are depicted in Figure 3(b). It is noted that the effective SBS gain spectra with twenty peaks are broadened from 40 MHz to 1.55 GHz. Due to the decrease of the peak SBS gain coefficient, the SBS threshold can be anticipated to be increased accordingly.
For verification of the SBS suppression effect with longitudinally step-distributed strain, we first investigate the power scaling ability of the experimental configuration with strained active fiber using strictly single-frequency seed with AWG turned off. The backward power as a function of the output power is shown in Figure 4. The output power near the SBS threshold of the single-frequency signal is approximately 120 W and the backward power is 10.6 mW. For comparison, a 3.8 m unstrained active fiber is tested and the output power is about 18 W before the nonlinear increase of the backward power. As can be inferred from the plots, the SBS threshold is 8 dB higher.
3.3 Relationship of the phase modulation and step-distribution strain
The relationship of phase modulation and step-distribution strain is further discussed in this section, since both methods are effective on the SBS suppression. Considering the effect of step-distribution strain independently, the SBS spectrum of single frequency is broadened form 40 MHz to 1.55 GHz
![]() $(\unicode[STIX]{x1D708}_{\text{Broaden}\;B})$
. The single-frequency seed is then phase modulated into three discrete frequencies, and each frequency has its corresponding broadened 1.55 GHz SBS spectrum. Therefore, the SBS spectrum might overlap each other which is unfavorable for the SBS suppression. Overlap conditions of the individual SBS gain spectrum with different modulation frequencies are shown in Figure 5. For modulation frequencies within the strain-broadened Brillouin bandwidth
$(\unicode[STIX]{x1D708}_{\text{Broaden}\;B})$
. The single-frequency seed is then phase modulated into three discrete frequencies, and each frequency has its corresponding broadened 1.55 GHz SBS spectrum. Therefore, the SBS spectrum might overlap each other which is unfavorable for the SBS suppression. Overlap conditions of the individual SBS gain spectrum with different modulation frequencies are shown in Figure 5. For modulation frequencies within the strain-broadened Brillouin bandwidth
![]() $(v_{m}<\unicode[STIX]{x1D708}_{\text{Broaden}\;B})$
, a large degree of overlap between the SBS spectra of the three frequencies occurs and total SBS gain spectrum is not fully expanded. In this regime, SBS still has a relative strong gain but with the increase of modulation frequency, the overlap decreases from strong to weak. And with the decrease of peak SBS gain coefficient, the SBS threshold can be anticipated to be increased accordingly. For larger modulation frequencies
$(v_{m}<\unicode[STIX]{x1D708}_{\text{Broaden}\;B})$
, a large degree of overlap between the SBS spectra of the three frequencies occurs and total SBS gain spectrum is not fully expanded. In this regime, SBS still has a relative strong gain but with the increase of modulation frequency, the overlap decreases from strong to weak. And with the decrease of peak SBS gain coefficient, the SBS threshold can be anticipated to be increased accordingly. For larger modulation frequencies
![]() $(v_{m}>\unicode[STIX]{x1D708}_{\text{Broaden}\;B})$
even though the modulation frequency goes up, additional enhancement in SBS suppression is minimal. Because in this regime the Brillouin gain overlap among the three frequencies is very small with a relatively steady SBS gain coefficient.
$(v_{m}>\unicode[STIX]{x1D708}_{\text{Broaden}\;B})$
even though the modulation frequency goes up, additional enhancement in SBS suppression is minimal. Because in this regime the Brillouin gain overlap among the three frequencies is very small with a relatively steady SBS gain coefficient.

Figure 6. Backward power as a function of the output power with different modulated frequencies.

Figure 7. (a) Output power and backscattering power versus pump power. (b) Emission spectra of backward scattering. (c) Emission spectra of forward output laser. (d) FPI scanning spectra of triple frequency at the maximum output power.
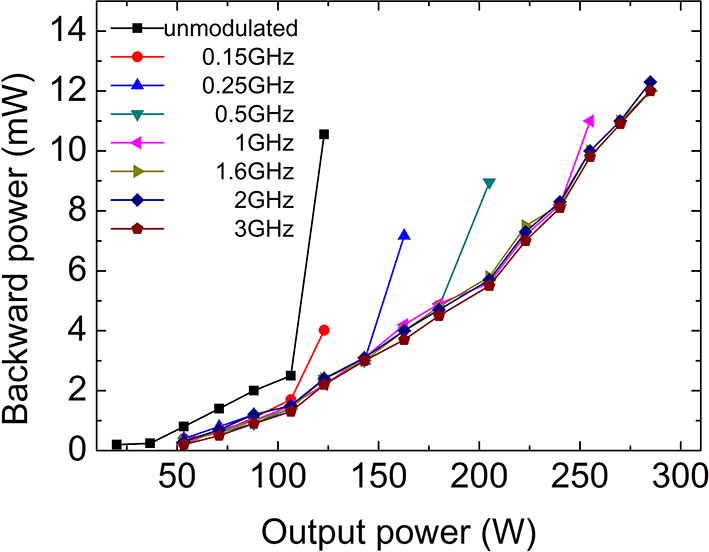
Moreover, to further validate above analysis, we experimentally investigate the SBS suppression effects by imposing the phase-modulation signal with different modulation frequencies based on the step-distribution-strain fiber amplifier. The actual backward power as a function of the output power is shown in Figure 6. We note that for the modulation frequency less than 1.55 GHz (strain-broadened Brillouin bandwidth of each frequency), SBS occurs in a low-power level and the SBS threshold increases from 123 to 255 W with the increase of the modulation frequency from 0 to 1.5 GHz. This is attributed to the transition from strong to weak overlap among SBS spectra. Accordingly, for the range of modulation frequency greater than 1.55 GHz, the backward power is basically independent of modulation frequency. Additional enhancement of SBS suppression remains steady, since the SBS spectra overlap is very small in this regime.
Based on the above analysis, we can conclude that when the SBS gain spectra of the three frequencies are just completely separated with each other, it is the best combination to suppress SBS effect and maintain narrow linewidth. So we choose 1.6 GHz as the modulation frequency in the following amplifying experiment. It should be noted that high enhancement of the SBS threshold means relatively wide SBS gain spectrum and correspondingly large frequency space of the triple-frequency signal. Thereby, a high-power output needs to sacrifice the narrow frequency space, vice versa, a narrow frequency space output needs to sacrifice output power. High-power output and narrow frequency space of the trip-frequency laser need to be well balanced in the practical application.
3.4 Triple-frequency amplification at the modulated frequency of 1.6 GHz
Based on above analysis, the sinusoidal signal with the fundamental frequency of 1.6 GHz is applied to the EOPM to generate a triple-frequency seed. Plots of the launched pump power versus output power and backward power are shown in Figure 7(a). The maximum output power of 302 W with 83% slope efficiency is attained at full pump power. We note that the backward power is still linear with respect to the forward power, which infers that the SBS threshold has not been reached. It is also indicated from the backward spectra of Figure 7(b). The Rayleigh scattering is still 5 dB higher than the SBS light. Figure 7(c) is the spectra of the forward signal measuring with an OSA at full power. A signal to amplified spontaneous emission (ASE) ratio is beyond 50 dB. The beam quality is measured by the
![]() $M^{2}$
beam analyzer and the PER is measured by a
$M^{2}$
beam analyzer and the PER is measured by a
![]() $\unicode[STIX]{x1D706}/2$
wave plate and a polarization beam splitter. The measurement results are 1.04 and
$\unicode[STIX]{x1D706}/2$
wave plate and a polarization beam splitter. The measurement results are 1.04 and
![]() ${>}$
18 dB, indicating a single spatial mode and high linear polarization output. The spectra of the amplified triple-frequency laser is scanned by FPI, as shown in Figure 7(d). It is noted that there are still three frequency components that are apparently separated with 1.6 GHz and almost identical intensity. Limited by the resolution of the FPI, the linewidth of each frequency is measured to 2 MHz by the heterodyne detection system built in our laboratory, shown in the inset.
${>}$
18 dB, indicating a single spatial mode and high linear polarization output. The spectra of the amplified triple-frequency laser is scanned by FPI, as shown in Figure 7(d). It is noted that there are still three frequency components that are apparently separated with 1.6 GHz and almost identical intensity. Limited by the resolution of the FPI, the linewidth of each frequency is measured to 2 MHz by the heterodyne detection system built in our laboratory, shown in the inset.
4 Conclusion
In summary, we demonstrate a high-power triple-frequency single-mode linearly polarized fiber amplifier with an all-fiber PM MOPA structure. Based on the sinusoidal phase-modulation system, a triple-frequency seed with equal amplitude is achieved. Combining with the triple-frequency signal, a designed step-distribution strain is applied to the gain fiber in the main amplifier to suppress the SBS effect. Due to the overlap among the broadened SBS spectra of the three frequencies, the influence of the frequency separation on the effect of SBS suppression is analyzed. In the experiment, up to 302 W output power with 83% slope efficiency is obtained and the SBS threshold is scaled up to 12 dB. Power scaling is limited by available pump power. The
![]() $M^{2}$
factor and PER are measured to be 1.04 and 18 dB at maximum output power. Due to high power and single output spatial mode, this device would be used as laser source in the application of SHG and CBC . This combined SBS suppression method would be extended to a larger mode area fiber and has the potential to boost the output power of narrow linewidth fiber amplifier to a higher level.
$M^{2}$
factor and PER are measured to be 1.04 and 18 dB at maximum output power. Due to high power and single output spatial mode, this device would be used as laser source in the application of SHG and CBC . This combined SBS suppression method would be extended to a larger mode area fiber and has the potential to boost the output power of narrow linewidth fiber amplifier to a higher level.
Acknowledgements
This work was supported by the National Natural Science Foundation of China (Nos. 1330134 and 61378024), the National Key Research and Development Program (No. 2016YFB0402201), the Natural Science Foundation of Shanghai (Nos. 16ZR1440100 and 16ZR1440200), the Program of Shanghai Technology Research Leader (No. 17XD1424800), the Shanghai Sailing Program (No. 17YF1421200), the key technologies R&D program of Jiangsu (Nos. BE2014001 and BE2016005-4), and K. C. Wong Education Foundation.


