To the Editor—The third wave of the coronavirus disease 2019 (COVID-19) pandemic resulted in a significant rise in hospitalizations and healthcare worker (HCW) severe acute respiratory coronavirus virus 2 (SARS-CoV-2) infections. After implementing the SARS-CoV-2 vaccination program, despite rising COVID-19 hospitalizations, we promptly observed a decrease in HCW infections.
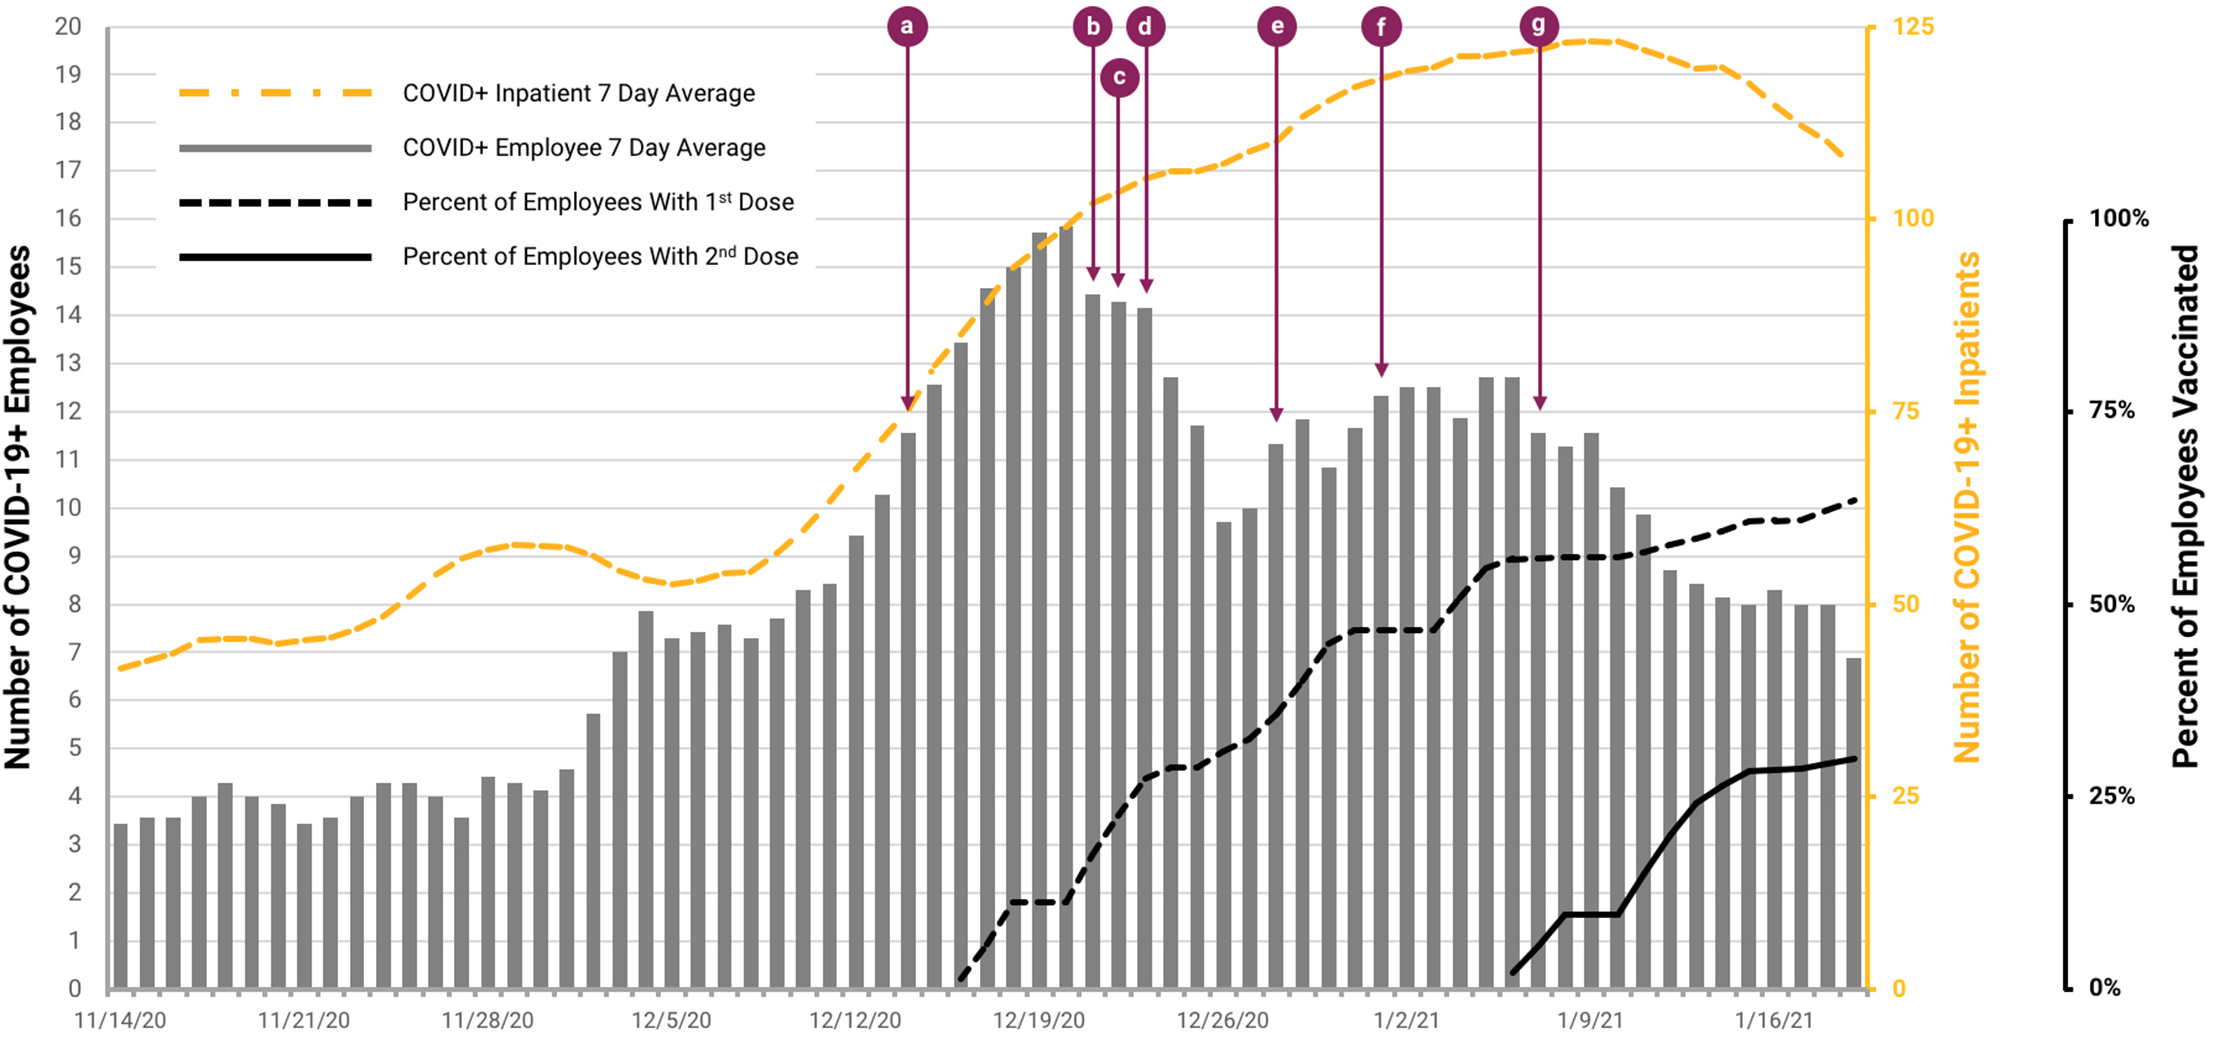
Our COVID-19 vaccination HCW program began on December 16, 2020, (Pfizer/BioNTech) and December 28, 2020 (Moderna). The COVID-19 cases were identified by nasal swab PCR testing of clinically symptomatic individuals. Six days after beginning employee immunizations, our HCW COVID-19 infection rate decreased by 25%. After 60% of employees received the 1st vaccine dose, the HCW COVID-19 rate decreased by 50% (Fig. 1). At 14-28 days and >28 days after their first vaccine dose, HCWs were less likely to have COVID-19 than those who did not receive the vaccine (0.15% and 0.00% vs 0.59%, P = .0002 and .0004, respectively). Concurrently implemented SARS-CoV-2 transmission prevention strategies included the transition from cloth masks to level-3 masks for all employees, mandatory face shields for direct patient care, a restricted visitor policy, and physical space adjustments for improved social distancing.

Fig. 1. Bar graph of 7-day average number of health system employees with positive SARS-CoV-2 tests from November 14, 2020, to January 19, 2021. Yellow dashed line is 7-day average number of COVID-19–positive inpatients over the same period. The black dashed line represents the percentage of total health system employees who received first dose of Pfizer anti–SARS-CoV-2 vaccine, beginning December 16, 2020. The black solid line represents the percentage of total health system employees who received second dose of Pfizer anti-SARS-CoV-2 vaccine, beginning January 6, 2021. Other interventions are as follows: (a) December 14, 2020: reduced adult visitors from 2 to 1; (b) December 21, 2020: required face shields and surgical mask for all patient encounters and restricted cafeteria seating; (c) December 22, 2020: employees to confirm symptom free upon arrival; (d) December 23, 2020: employees to use surgical masks in all areas; (e) December 28, 2020: employee temperature screening on arrival; (f) January 1, 2021: 50% ambulatory visits changes to telehealth; and (g) January 8, 2021: full adult visitor restriction.
The Pfizer/BioNTech clinical trial reported a vaccine efficacy of 95% at least 7 days after the second dose and protection as early as 12 days after administration of the first dose. Reference Polack, Thomas and Kitchin2 The Moderna vaccine trial observed similar protection prior to the second dose. Reference Baden, El Sahly and Essink3 Our data are consistent with these studies and underscore the prompt benefits of vaccination for the prevention of COVID-19 in the healthcare system even prior to the completion of the second vaccine dose. Our additional infection control strategies are consistent with CDC recommendations 4 and likely further optimized HCW safety.
We present a bundled infection prevention approach including vaccination for the prompt reduction of COVID-19 infection in HCWs. The impact of COVID-19 vaccination in HCWs was observed even prior to completion of the second dose. Wood et al Reference Wood and Schulman5 suggest 12 key strategies to promote vaccination, 2 of which are relevant here: increasing observability and countering anecdotal “bad reaction” with “good reaction” vaccine stories. Reference Wood and Schulman5 We share our vaccine story to encourage more vaccination-hesitant HCWs to receive immunizations and to receive them earlier. Reaching herd immunity through vaccination is a crucial next step in ending this pandemic.
Acknowledgments
Financial support
No financial support was provided relevant to this article.
Conflicts of interest
All authors report no conflicts of interest relevant to this article.


