INTRODUCTION
Tuberculosis (TB) is a deadly infectious disease that continues to pose a major threat to global health. In 2014, an estimated 9·6 million people developed TB and 1·5 million died from the disease[1]. Several risk factors for TB development and mortality have been identified worldwide, most notably poverty and overcrowding, HIV infection, undernutrition, alcohol misuse, silicosis, diabetes, smoking, immunosuppressive therapy and end-stage renal disease[Reference Dheda, Barry and Maartens2]. However, these do not entirely explain variations in TB incidence reported in different countries and at different latitudes.
For more than a century, sun exposure has been identified as a possible protective factor for TB. Plenty of sun exposure and fish liver oil intake were considered important adjunct treatments of TB in the pre-antibiotic era. This protection has been attributed to vitamin D (VD) synthesis in human skin upon exposure to solar ultraviolet B (UVB) radiation and to the high VD content of fish liver oil, respectively. VD is a pre–pro-hormone whose active metabolite, 1,25-dihydroxy VD (1α,25[OH]2D) has multiple actions on the immune system and enhances immunity to mycobacteria, among other effects[Reference Martineau3]. In most settings, the VD status of an individual is mostly determined by skin synthesis (i.e., sun exposure), with only a minor fraction acquired from dietary sources such as oily fish. Most experts agree that 25-hydroxyvitamin D (25OHD) <50 nmol/l is an indication of VD deficiency, whereas 25OHD of 50–74 nmol/l indicates insufficiency and concentrations ⩾75 nmol/l are considered to be sufficient[Reference Holick and Chen4].
In the last decade, several studies have shown that up to 30–50% of adults and children living in different geographical areas worldwide are at risk of VD deficiency, attributed to low UVB exposure and modern lifestyle[Reference Holick and Chen4]. Chile has a relatively unique geographical situation, being a long and slender country with large differences in latitude, from 17°S at the extreme north and 56°S at the extreme south (Fig. 1). Latitude has a high correlation with solar radiation (SR) in Chile (r = −0·96), with SR being high in the northern regions and reaching a minimum in the extreme southern regions[5]. In the city of Arica (extreme north, latitude 17·5°S) postmenopausal women were uncommonly found to have VD deficiency, with a median plasma 25OHD level of 64 nmol/l, whereas in Santiago (central Chile, latitude 33°S) studies have shown that VD deficiency is highly prevalent and can reach as high as 60% in postmenopausal women[Reference González6, Reference Rodríguez, Valdivia and Trincado7]. VD deficiency is further accentuated in southern regions where there is less annual SR exposure, with up to 100% of postmenopausal women and 96% of school-aged children having VD deficiency in the city of Punta Arenas (extreme south; latitude 53°S), and most of the population having 25OHD in range of severe VD deficiency (<30 nmol/l) [Reference Brinkmann8, Reference González9].

Fig. 1. Geographical distribution of regions in Chile.
Despite the large latitude range of Chile, the country has a relatively homogenous ethnic background composed of a mixture of European, mainly Spanish, and indigenous ethnicities. In addition, Chile has a high-quality National TB Program since 1973 that provides free, guaranteed, and centralized access to TB diagnosis and treatment for the entire population. TB notifications collected in the national electronic TB record database are mandatory and supervised by the regional TB program centers by monthly cross-checking of the daily compulsory TB cases notifications by health professionals, compulsory laboratory notifications for positive Mycobacterium tuberculosis (MTB) cultures, and monthly report of TB cases under treatment at any local health clinic[10]. This setting provides the unique opportunity to study the relations of latitude and SR on TB in one country. The objective of this study was to evaluate the association of regional SR (a proxy of VD status) with TB incidence, admission, and mortality rates in Chile. We hypothesized that regional SR has inverse correlations with TB incidence, admission, and mortality rates.
METHODS
We retrospectively reviewed the mandatory disease notifications, hospital admissions, and population mortality databases from the Department of Health Statistics and Information of the Chilean Ministry of Health between January 2001 and December 2011. All three databases are prospectively collected by the Chilean Ministry of Health on a daily basis throughout the entire country and are publicly available for research purposes[11]. In these three databases, the International Classification of Diseases, 10th Revision (ICD-10) is used for coding of diagnosis. No data linkage is available across databases and patient information is de-identified. TB was identified by the following ICD-10 codes: A15 (respiratory TB, bacteriologically and histologically confirmed), A16 (respiratory TB, not confirmed bacteriologically or histologically), A17 (TB of nervous system), A18 (TB of other organs), and A19 (miliary TB). The authors of this study had full access to the information in all three databases for the period of study.
Mandatory disease notifications are prospectively collected in Chile on a daily basis with high coverage throughout the country. Notifications of TB cases are a valid proxy of TB incidence in Chile and other countries with a high performance surveillance system and good access to healthcare[1]. In our study, TB incidence was defined as notifications of new cases of TB per 100 000 population per year. Notifications of TB relapses or recurrences were excluded from our analysis. TB admission rates were calculated as hospitalizations with a discharge diagnosis of TB per 100 000 population per year. Mortality rates were calculated as reported TB deaths per 100 000 population per year.
Chile is divided in 15 administrative regions distributed serially from north to south (Fig. 1). The country's population is unevenly distributed, with 40% inhabiting the capital city of Santiago, located in central Chile. The national health care system is defined as ‘mixed’, combining public and private insurance. Middle–low socioeconomic level population is covered by public insurance (82% in 2009), while high socioeconomic level population is covered by private insurance (13% in 2009). A minority of the population is either covered by the armed forces insurance or lacks insurance. The National TB program is the exclusive provider of antituberculous drugs and therapy supervisor in the country, giving free coverage to all inhabitants, regardless of health insurance status.
For each region, mean annual SR intensity data, expressed as MJ/m2/day, was obtained from the Chilean Solarimetric Registry[5]. Regional immigrant population proportions and poverty rates were extracted from the 2009 National Socioeconomic Characterization Survey from the Chilean Ministry of Social Development[12]. HIV notification rates were obtained from the Chilean Ministry of Health[13]. Prison population rates were obtained from the Chilean Ministry of Justice[14].
Trends of incidence, admission, and mortality rates across different regional SR levels were analyzed by linear regression modeling, both unadjusted and with adjustment by confounders (migration rate, HIV rate and imprisonment rate). Comparisons between two rates were analyzed by calculating Poisson rate ratio. The 95% confidence intervals (95% CI) were calculated, and a two-sided P < 0·05 was considered statistically significant. Statistical analyses were performed using IBM SPSS Statistics for Windows Version 22 (IBM Corporation, Armonk, NY) and R Version 3.1·2 (The R Foundation for Statistical Computing, Vienna, Austria). The REporting of studies Conducted using Observational Routinely-collected health Data (RECORD) guidelines were followed in the conduct and reporting of this study.
The Scientific Ethics Committee of the Faculty of Medicine at Pontificia Universidad Católica de Chile approved this study.
RESULTS
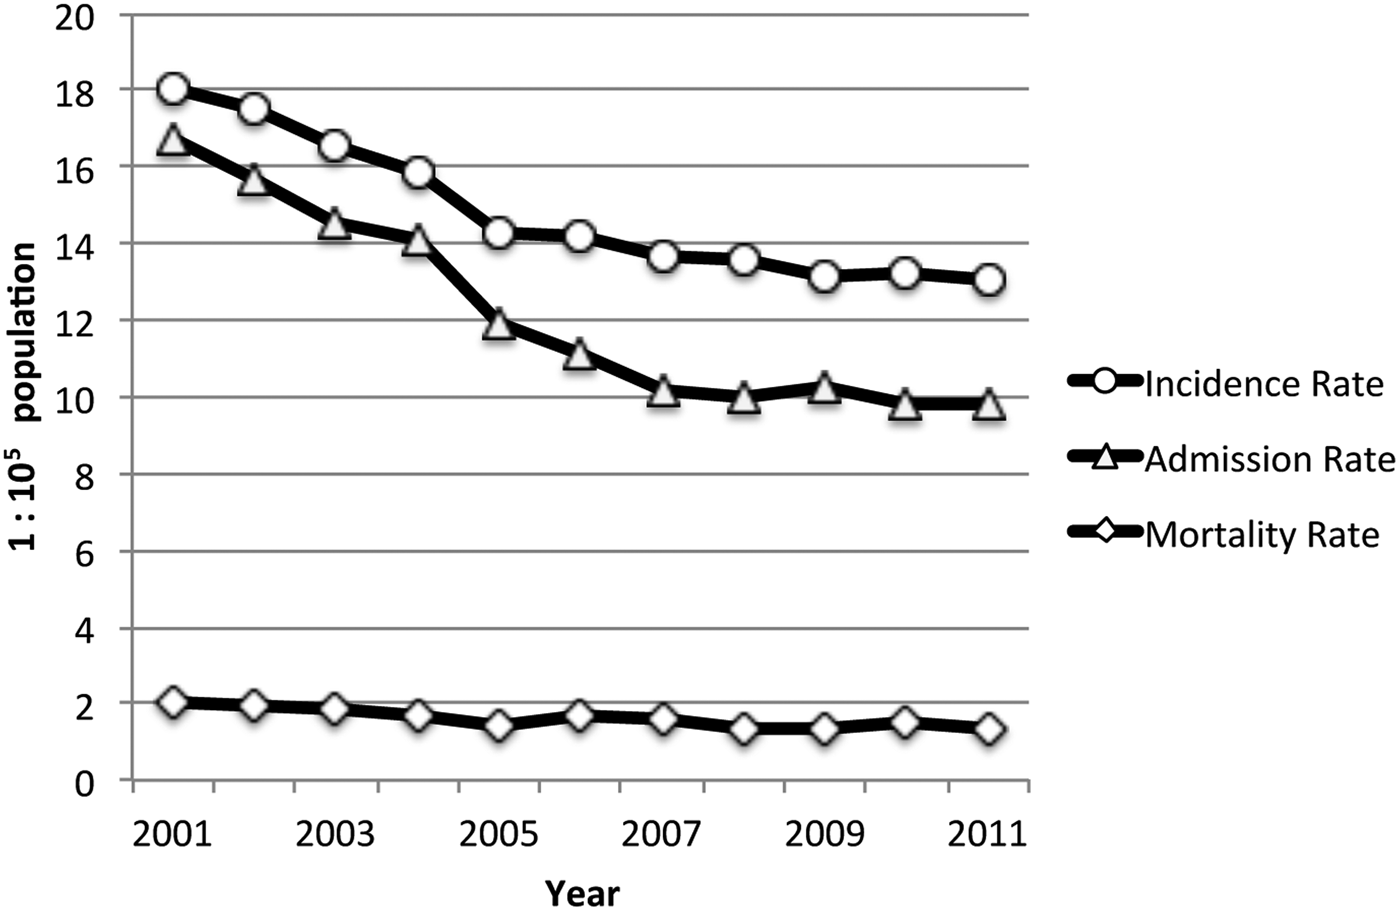
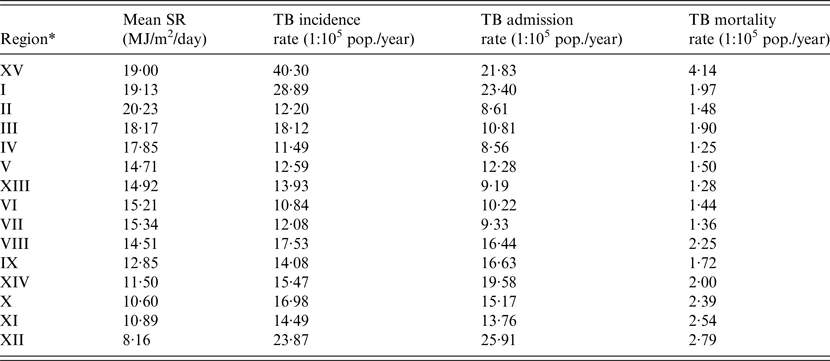
Over the study period (2001–2011), a total of 26 691 notifications of new TB cases were registered in Chile, with an estimated incidence rate was 14·77 per 100 000 population per year (95% CI 14·60–14·95). Over the 11-year study period, 21 901 hospital discharges and 2908 deaths from TB diagnosis were registered. The demographic and main clinical characteristics of subjects in the three databases are shown in Table 1. The hospital admission rate for TB during the period was 12·12 per 100 000 population per year (95% CI 11·96–12·28) and the TB mortality rate was 1·61 per 1 00 000 population per year (95% CI 1·55–1·67). TB incidence, admissions, and mortality rates decreased steadily over the study period (Fig. 2). Geographically, TB outcomes had a bimodal distribution, with peaks in extreme northern regions at the frontier of Peru and Bolivia (Region XV and Region I, latitude 17°29′–21°37′S) and in the southernmost region with lowest SR (Region XII, latitude 48°39′–56°32′S) (Table 2). To evaluate the effect of SR on TB outcomes at a national level, we performed unadjusted linear regressions that did not show a significant association of regional SR with TB incidence (β 0·44 (95% CI −0·87 to 1·76), P = 0·48), admissions (β −0·54 (95% CI −1·44 to 0·37), P = 0·22), or mortality (β −0·03 (95% CI −0·16 to 0·09), P = 0·59).

Fig. 2. Annual TB incidence rate, admission rate, and mortality rate (Chile, 2001–2011).
Table 1. Demographic and clinical characteristics of subjects included in the TB disease notifications, admissions, and mortality databases (Chile, 2001–2011)

Table 2. Daily mean SR, TB incidence rate, TB admission rate and TB mortality rate, by region (Chile, 2001–2011)

* Listed in geographical order (from north to south).
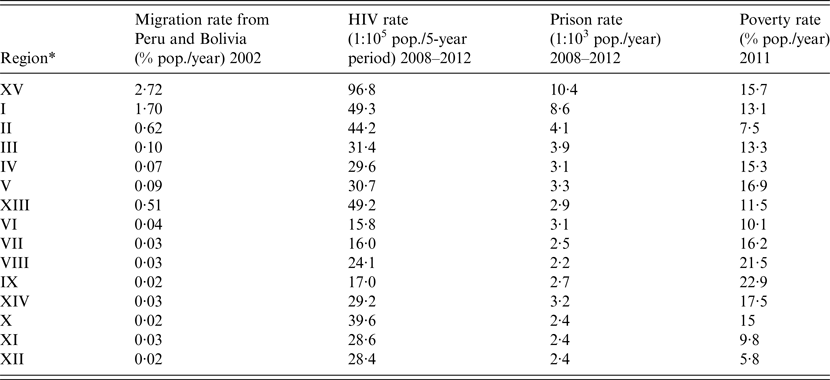
Given the clear bimodal distribution of TB in Chile, we next explored the ecological association between known demographic TB risk factors – migration from countries with high TB rates, HIV, imprisonment, and poverty rates and regional TB incidence rates. Regional rates of these risk factors are shown in Table 3. Unadjusted linear regressions showed TB incidence and mortality in Chile were significantly associated with migration from neighboring TB-endemic countries, HIV, and imprisonment rates, and not with regional poverty (Table 4). Examining the geographical distribution of the three significant TB risk factors, these were strongly concentrated in the two northernmost regions of Chile (Region XV and Region I) that had maximal national rates of these three factors. These regions represent 2·9% of the overall country population, but receive a large mass of migration from north-border neighboring countries Peru and Bolivia that had TB incidence rates of 106 and 135 per 100 000 in year 2010, respectively, about 10-times higher than Chile[15]. In effect, the migration rate from Peru and Bolivia for year 2002 for each of these two regions (XV and I) were 8·6-fold (95% CI 8·4–8·9) and 5·7-fold (95% CI 5·5–5·9) respectively, the rate of the rest of the country; HIV notification rates for the period 2008–2012 were 2·7-fold (95% CI 2·3–3·1) and 1·4-fold (95% CI 1·2–1·6) the rate of the rest of the country; and finally, imprisonment rates during the period 2008–2012 of Region XV and Region I were 3·6-fold (95% CI 3·6–3·7) and 3·0-fold (95% CI 2·95–3·1) the rate of the rest of the country.
Table 3. Migration rate from TB-endemic countries, HIV rate, and imprisonment rate, by region in Chile

* Listed in geographical order (from north to south).
Table 4. Unadjusted linear regressions between migration rate from TB-endemic countries, HIV rate, imprisonment rate, and regional poverty with TB incidence in Chile

Considering the significant demographic risk factors as potential confounders of the association between SR and TB incidence, admissions, and mortality, we performed multivariable linear regressions with adjustment for migration from neighboring TB-endemic countries, HIV, and imprisonment rates. The principal assumptions of a multivariable linear regression were tested and were satisfied for all three regressions. These analyses showed an independent significant inverse linear association between SR and TB incidence rate (β −1·05 (95% CI −1·73 to −0·36), R 2 = 0·88, P = 0·007), TB admission rate (β −1·58 (95% CI −2·23 to −0·93), R 2 = 0·80, P < 0·001), and TB mortality rate (β −0·15 (95% CI −0·23 to −0·07), R 2 = 0·82, P = 0·002).
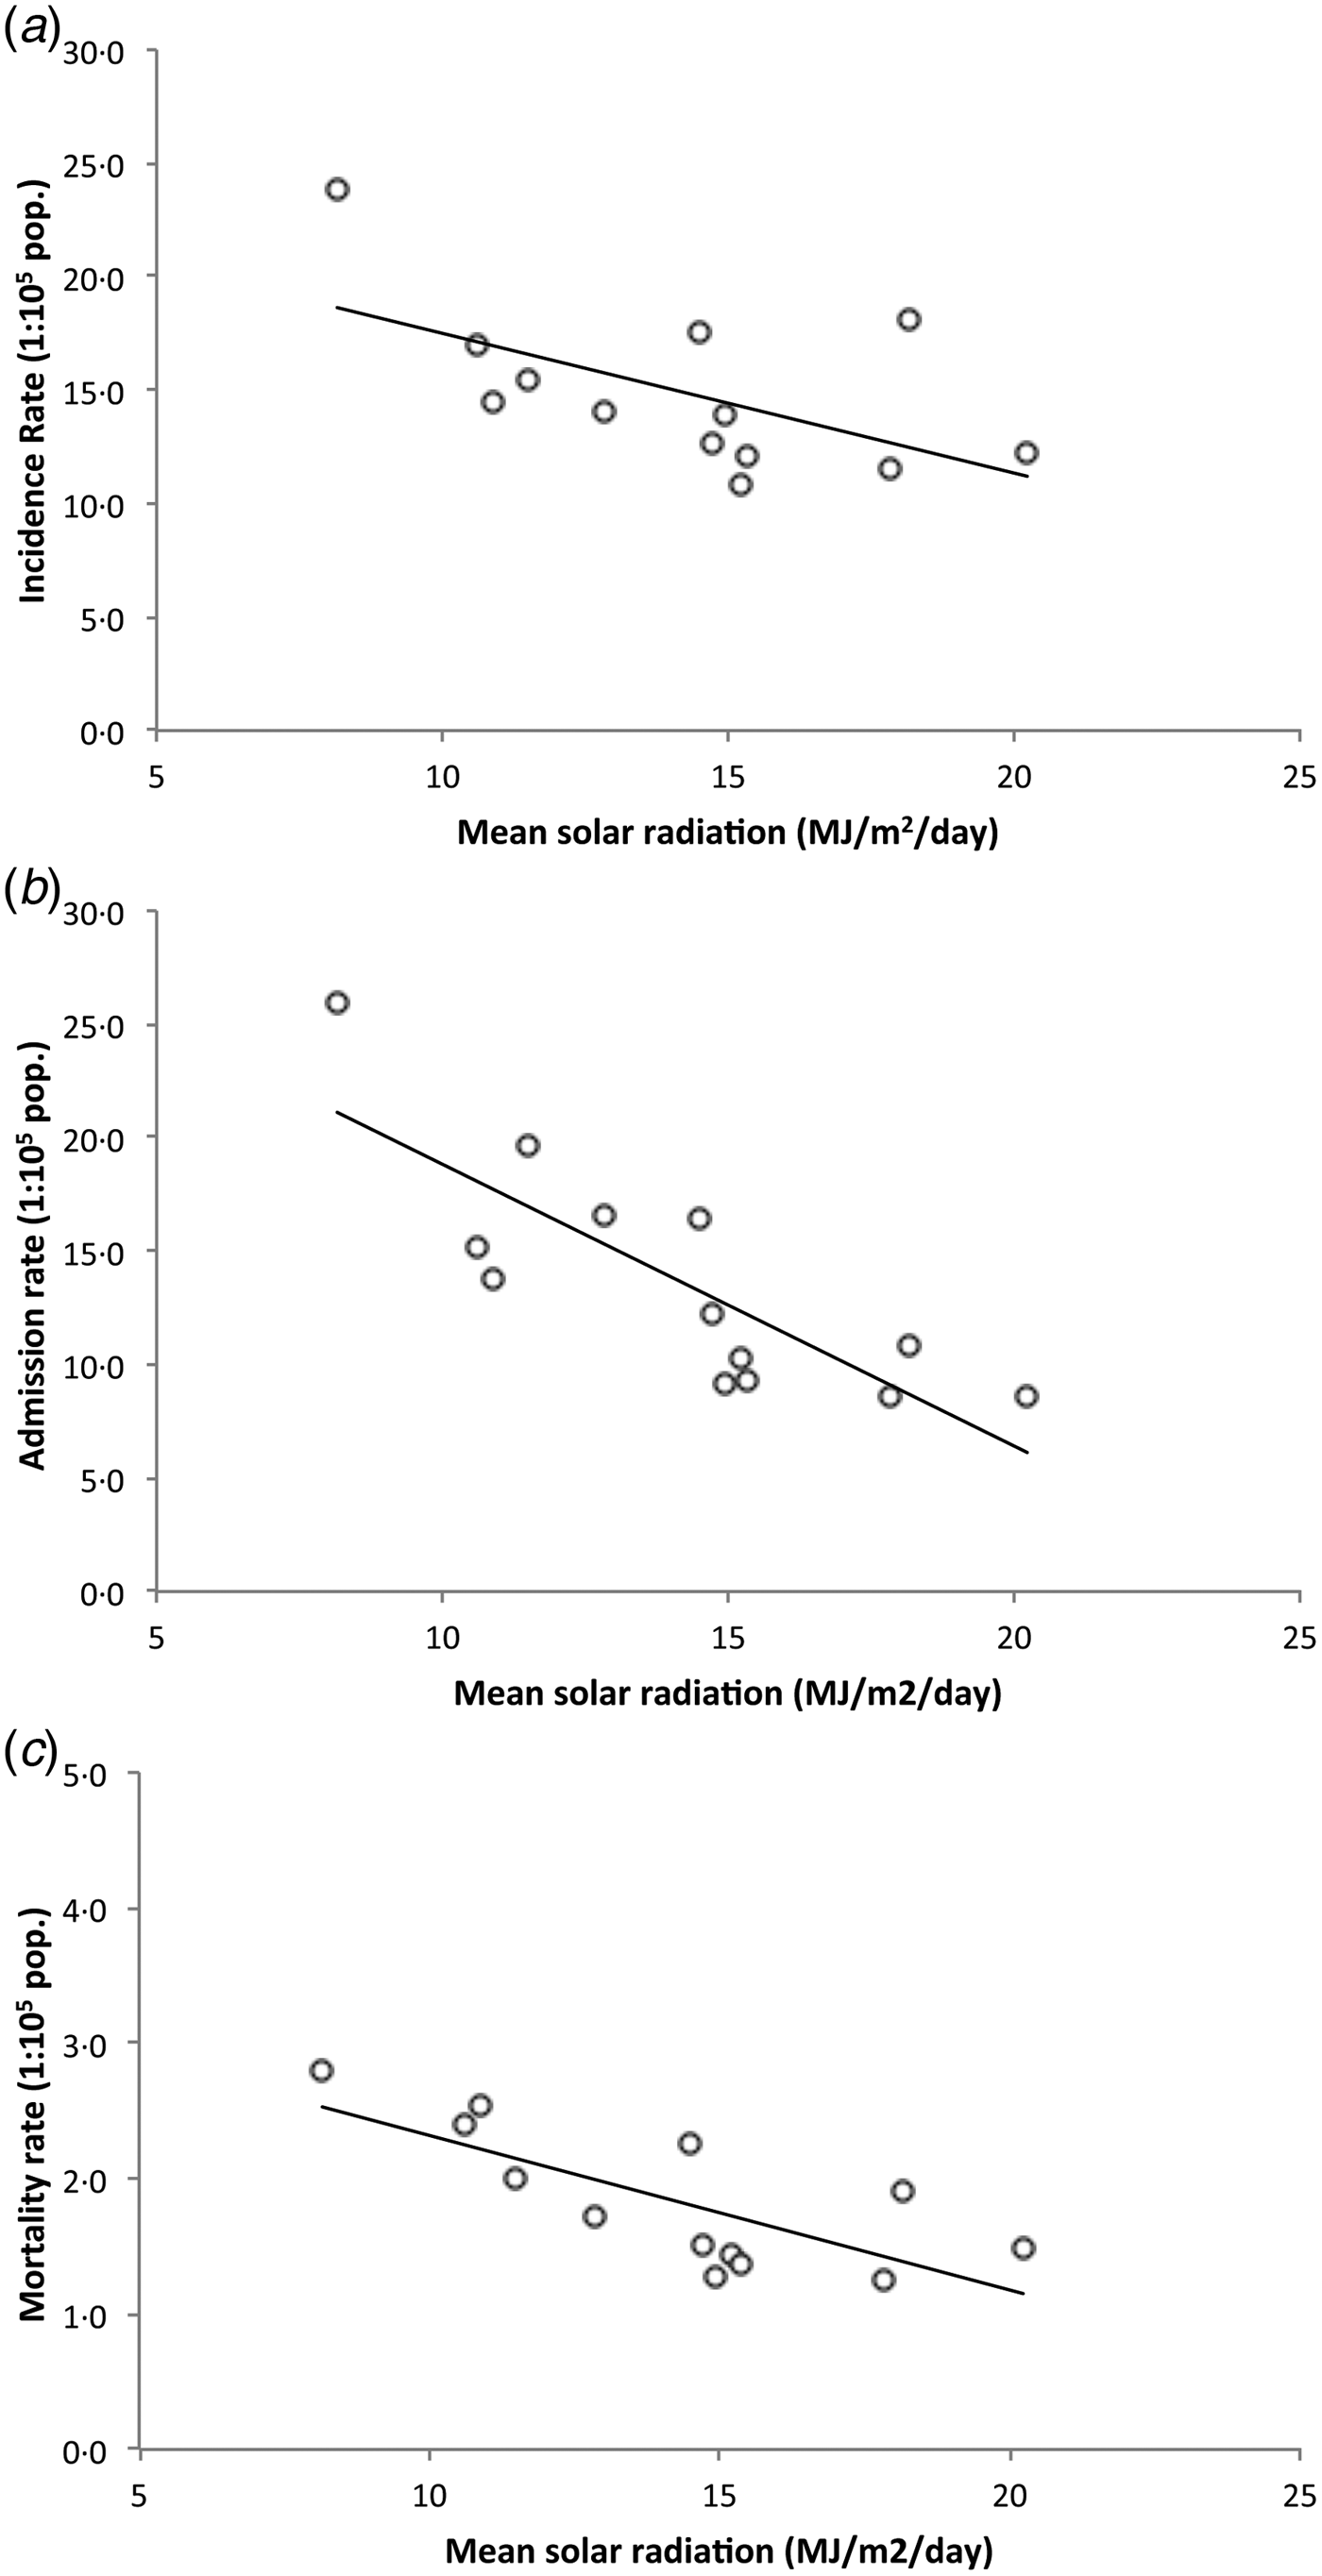
Provided that potential limitations of linear regression models applied on ecological data may be a source of bias[Reference Zuur16], we decided to confirm the association of SR and TB outcomes by assessing these relations excluding the two northernmost regions with highest rates of confounders from latitudinal analyses. Thus, we analyzed whether regional SR levels correlated with TB incidence, admission, and mortality rates between regions II and XII (latitude 21°38′S to 56°32′S). This area covers over 3800 km in length and includes 97·1% of the country population. SR between these regions linearly decreases from a mean of 20·2 MJ/m2/day at region II in the north, the highest in the country, to a minimum of 8·2 MJ/m2/day in the extreme southern region XII. Unadjusted linear regressions of SR and TB outcomes between latitudes 21°38′S and 56°32′S showed a strong inverse association between SR and regional TB incidence rate (β −0·62 (95% CI −0·12 to −0·05), R 2 = 0·34, P = 0·036), regional TB admission rate (β −1·24 (95% CI −1·81 to −0·67), R 2 = 0·68, P = 0·001), and regional TB mortality rate (β −0·11 (95% CI −0·18 to −0·05), R 2 = 0·56, P = 0·003) (Fig. 3).

Fig. 3. Daily mean SR vs. TB incidence rate (a), admission rate (b), and mortality rate (c) by region (Chile, 2001–2011). Dots represent regions, black line shows linear trend. Regions XV and I were excluded. Between latitudes 21°38′S and 56°32′S there is an inverse correlation between daily mean SR and TB incidence rate, TB admission rate, and TB mortality rate.
DISCUSSION
In analysis of 11 years of national data from Chile, we found that reduced regional SR – a proxy of VD deficiency – is associated with a higher TB incidence and also with epidemiological markers of TB severity (hospitalizations and mortality). Together, the data support a potential pathogenic role of VD deficiency on the incidence and severity of TB. This ecological association is strengthened by the large sample size, the long study period, and the historically very homogenous diagnostic and treatment directions of the National TB Program in Chile[10].
Previous epidemiological studies on the association of SR and TB have focused on the seasonality of TB incidence in different geographical locations, but have provided little information on latitudinal variations of TB[Reference Martineau17–Reference Koh22]. In this regard, a single study by Thorpe and co-workers showed that districts in southern regions of India have lower TB incidence rates than districts in northern regions, results that are consistent with our findings[Reference Koh22]. Our study is unique in that it provides large exposure heterogeneity (i.e., from tropical to circumpolar SR levels) within a relatively homogenous population in one entire country with a single high coverage national TB program. Another strength of this study is that the outcomes that were assessed (incidence, admissions, deaths) may represent different moments of the natural history of TB, showing high consistency of the association between SR and these different outcomes, which adds biological plausibility to the hypothesis that SR may be associated not only to the incidence of TB disease but also to the clinical course of TB.
Growing evidence from epidemiological and clinical studies have shown there may be an association between VD deficiency and active TB, as well as – in more recent literature – an association between VD deficiency and latent TB infection, within diverse geographical locations and ethnic backgrounds[Reference Martineau17, Reference Nnoaham and Clarke23–Reference Gibney25]. A recent meta-analysis involving 1440 cases and 2558 controls found that serum 25OHD ⩽25 nmol/l was significantly associated with clinical TB[Reference Zeng26]. More recently, a prospective cohort study demonstrated a significant inverse association between VD status and TB incidence at follow up in contacts (HR 0·88, 95% CI 0·80–0·97)[Reference Arnedo-Pena27]. Thus, consistent with the association of SR with different TB outcomes found in our study, VD appears to play a prominent role at different stages of the natural history of this infection. Although profound VD deficiency has been associated with delayed sputum smear conversion in observational studies, the benefit of VD supplementation in patients with active TB is not clear, and even if some studies have shown a reduction of inflammatory markers and accelerated sputum smear conversion, others have not[Reference Daley28–Reference Junaid30].
Strong risk factors for TB in Chile include high rates of migration from endemic countries, HIV co-infection, and imprisonment. At country level, in year 2012, 5·7% of all TB cases occurred in HIV-infected subjects, 7·1% in migrants, and 3·9% in prisoners[31]. Prisons are particularly considered a high-risk setting for TB in Chile: TB incidence was estimated at 332 per 100 000 inmates between year 2002 and 2004 in Santiago[Reference García32]. In the present study we found that SR was independently associated with TB outcomes when adjusting by these confounding risk factors. Furthermore, when we excluded the extreme northern – sparsely populated – regions of the country from subsequent spatial analyses because they concentrated all three of these risk factors, which would have potentially acted as major confounders, the association between SR and TB outcomes was even stronger. SR in the excluded regions (19·1 MJ/m2/day) was not higher than the next consecutive region (20·2 MJ/m2/day) that had relatively low TB rates, supporting the pathogenic role of the aforementioned risk factors in the northernmost regions and arguing against a potential effect of excess SR on higher TB incidence and severity.
Poverty is a relevant risk factor for TB even in developed countries [Reference Siroka, Ponce and Lönnroth33, Reference Ploubidis34]. Interestingly, in the present study we did not find an association between regional poverty and TB incidence. This is possibly explained by the fact that there are wide variations in socioeconomic status within different regions in Chile, which are not necessarily reflected by aggregate statistics for each region. Thus a lack of resolution may have prevented us from identifying this as a risk factor in our analysis.
Although an association between VD deficiency and active TB has been suggested by epidemiological and clinical data, the exact mechanisms by which VD acts as an immune modulator and booster of natural immune response to MTB has only recently been explored. In human macrophages, 1α,25[OH]2D and ligation of toll-like receptors causes upregulation of the intracellular VD receptor and VD 1-hydroxylase genes, resulting in induction of antimicrobial peptides such as cathelicidin and β defensin. Cathelicidin induces fusion of the phagolysosome, which is essential for the containment, degradation, and subsequent killing of MTB[Reference Borella35]. Other experimental studies show that 1α,25[OH]2D also exerts its effects on innate immunity by the promotion of autophagy and the suppression of tissue remodeling and lung matrix breakdown[Reference Yuk36, Reference Anand and Selvaraj37]. Besides its actions on innate immunity, VD exerts important effects on adaptive immunity directed against MTB. In vitro studies have shown that the antimicrobial effects of IFN-γ are VD-dependent. Thus, VD appears to be required for cellular immunity to activate macrophage-mediated antimicrobial responses to eliminate intracellular pathogens such as MTB[Reference Fabri38].
We recognize that a limitation of current study design is the so-called ecological fallacy (i.e., the hazard of drawing inferences about the nature of individuals based on inferences about the group to which those individuals belong). The existence of inter and intra-regional variations of sun exposure among individuals is possible, as well as different dietary and vitamin supplementation habits. Nevertheless, considering previous studies on VD status in Chile[Reference González6–Reference González9], the homogeneity of the Chilean diet (generally low on VD-rich foods)[Reference Crovetto and Uauy39], and lack of VD supplementation policies throughout the country, we believe it is reasonable to consider regional SR as a valid proxy of VD status of each region's inhabitants. Likewise, we believe it is plausible to suggest that low VD on an individual level may confer an increased risk of TB incidence, severity, and mortality. However, it is also possible that SR may be a proxy of other environmental or sociodemographic factors such as low temperatures, household overcrowding, or other medical conditions such as undernutrition. We examined whether the latter could influence the association of TB with SR. A significant association was found between SR and underweight (ρ = 0·61, P < 0·05), and an inverse association between SR and obesity (ρ = −0·63, P < 0·05) (i.e., southernmost regions with lower SR have less undernutrition and higher obesity rates). Given that undernutrition is a well-known TB risk factor and obesity confers lower risk of TB[Reference Aibana40], this inverse association between SR and weight in Chile only strengthen our findings regarding higher TB incidence in regions of lower SR. Only future, individual-based studies will confirm if the association between SR and TB truly exists. Other limitations of this study are inherent to the databases used, which were not created to answer the specific research question addressed in this study. Hospital admissions are de-identified, so it is not possible to distinguish readmissions of single patients, therefore, this may explain high TB admission rates. In addition, none of the three databases that were analyzed provided details of comorbid conditions that may potentially affect VD status or TB outcome (e.g. HIV, chronic renal failure, cancer, immunosuppression). However, the consistency of the association of SR with TB outcomes in three different databases and the large sample size covering an entire country reduces the likelihood that these risk factors were over-represented or unevenly distributed in different regions.
In summary, we found that regional SR in Chile is inversely and independently associated with incidence and severity of clinical TB, and thereby supports a potential pathogenic role of VD deficiency in TB pathogenesis. The unique conditions that exist in Chile – a country with a large latitudinal span, homogenous population and high coverage TB program – provide a natural experiment as background to explore these ecological associations. We encourage further research to explore the associations of SR and VD status with TB incidence and outcomes, as well as VD supplementation trials to prevent or treat TB in VD-deficient populations.
ACKNOWLEDGMENTS
The authors would like to thank Dr Tania Herrera, Director of National TB Programme that provided data for this study. This work was partially supported by Fondo Nacional de Desarrollo Científico y Tecnológico (M.E.B., grant number 1130600 and A.B., grant number 1130615), and Iniciativa Científica Milenio (A.B., grant P09/016-F).
DECLARATION OF INTERESTS
None.


