Introduction
Understanding the nature and causes of continental glaciation is of fundamental importance to the study of past Earth climates and possible future climatic change. The geologic record indicates the existence of massive ice sheets over the Northern Hemisphere as recently as 20 000 years ago, while ice sheets apparently also existed on different continents hundreds of millions of years ago. The effects of future natural and anthropogenic climatic change on ice sheets are also of more immediate concern, because of such issues as possible rises in sea level if the ice sheets that currently exist shrink back or collapse.
Examples of key questions regarding glaciation include: Why is Antarctica glaciated at present, while we are currently in an interglacial period in the Northern Hemisphere, with ice sheets outside mountain regions restricted to Greenland and the islands of the High Arctic? Was Antarctica largely or completely deglaciated early in the Cenozoic? What are the causes and implications of the massive continental ice sheets over much of Canada. Scandinavia, and Siberia that occurred during the Last Glacial Maximum?
A hierarchy of climate models, ranging from simple energy-balance models (EBMs) to much more complex general circulation models (GCMs) has been applied to the study of polar glaciation. These studies will be reviewed briefly, emphasizing both the methodologies employed and the major implications of the results. Described in more detail are previous studies we have made concerning Antarctic glaciation (Reference OglesbyOglesby, 1989, Reference Oglesby1991; Reference Marshall and OglesbyMarshall and Oglesby, 1994; Reference Verbitsky and OglesbyVerbitsky and Oglesby, 1995), which address questions of Cenozoic Antarctic glaciation and possible behavior under future greenhouse warming. Then discussed are studies that address questions of Pleistocene glaciation in the Northern Hemisphere that emphasize both the effects of ice sheets on climate (Reference Felzer, Oglesby, Webb and HymanFelzer and others, 1996, Reference Felzer, Webb and Oglesbyin press) and the effects of climate on ice sheets (Reference OglesbyOglesby, 1990; Reference Verbitsky and OglesbyVerbitsky and Oglesby, 1992; Reference Marshall and OglesbyMarshall and Oglesby, 1994).
Basic Concepts
The initiation and growth of an ice sheet or large glacier requires a region with a positive net snow accumulation (that is, cold-season snowfall exceeds warm-season snow-melt). Because snow can melt very rapidly, in a practical sense this means that little or no suowmelt should occur in the warm season (mountain glaciers being one possible exception). If enough ice builds in a region with a positive net snow accumulation, the ice can flow into adjoining regions with a negative mass balance. Important feedbacks can also arise between the emerging ice sheet and the over-all climate. Many modeling studies have placed an ice sheet as a boundary condition, and inferred whether growth or melt would occur based on the energy balance over the ice sheet. A major difficulty with this approach is that the ice sheet may be inconsistent with other model boundary conditions and forcings. A more physically realistic method is to use the model to compute snow balance, thereby directly determining regions where ice sheets could arise and, in conjunction with models of ice-sheet thermodynamics and dynamics, their characteristics as well. A key problem is that the hydrology models that we use to compute the snow balance (see Reference Marshall, Nolin, Oglesby and BatesMarshall and others, 1997) are still very crude.
One can easily envisage a dynamical balance, or equilibrium, with an ice sheet of some considerable size, with the areal extent and mass staying approximately constant in time. The positive-accumulation zone serves as the source, while the negative-accumulation zone serves as a sink, with a balancing transport between the two (through a region of indefinite size assumed to be neutral, and a net annual snow-accumulation close to zero).
More generally, we can write an ice-sheet equation schematically as:
where I refers to ice volume, SA to snow
accumulation, SM to snowmelt, V is the
velocity of ice, and the del-symbol is the del operator (that is,
![]() refers to the divergence of flowing ice). For
quasi-equilibrium conditions, we require that
dI/dt be 0 (a dynamical balance is
obtained). The assumption of an ice sheet in dynamic equilibrium is probably
not a very good one for most actual ice sheets over time periods from a few
hundreds to thousands of years. In actuality, ice sheets are probably not very
stable (i.e. roughly constant in mass and configuration) for very long. In the
introduction, we described three states, or stages, of an ice sheet:
initiation, maintenance and elimination. Mathematically, these are equivalent
to cases where dI/dt >0 (ice sheet
initiation and growth); dI/dt = 0
(maintenance, i.e. the ice sheet is constant in size) and dI
< 0 (ice sheet decay and eventual elimination). A comprehensive theory, or
model, of continental ice sheds (and hence the “Ice Ages”) must account for all
three of these states, and how the transitions take place between them within
realistic time-scales. Clearly, though, the better we understand each state by
itself, the better we will be able to combine them so as to account for entire
ice-sheet cycles.
refers to the divergence of flowing ice). For
quasi-equilibrium conditions, we require that
dI/dt be 0 (a dynamical balance is
obtained). The assumption of an ice sheet in dynamic equilibrium is probably
not a very good one for most actual ice sheets over time periods from a few
hundreds to thousands of years. In actuality, ice sheets are probably not very
stable (i.e. roughly constant in mass and configuration) for very long. In the
introduction, we described three states, or stages, of an ice sheet:
initiation, maintenance and elimination. Mathematically, these are equivalent
to cases where dI/dt >0 (ice sheet
initiation and growth); dI/dt = 0
(maintenance, i.e. the ice sheet is constant in size) and dI
< 0 (ice sheet decay and eventual elimination). A comprehensive theory, or
model, of continental ice sheds (and hence the “Ice Ages”) must account for all
three of these states, and how the transitions take place between them within
realistic time-scales. Clearly, though, the better we understand each state by
itself, the better we will be able to combine them so as to account for entire
ice-sheet cycles.
Modeling Approaches
The first question is whether to take an equilibrium or dynamic approach-that is, do we want to model each of the three states as separate entities, or do we want to model how the three combine to form one (or more) full ice-sheet cycles?
If we take the equilibrium modeling approach, we assume we are investigating for a single point in time the boundary conditions, forcings, and/or physical processes responsible for a particular state involving either ice-sheet growth, maintenance (steady-state) or decay. The spatial resolution of the model can range from 0-dimensional (0-D) (global average) to full three-dimensional (3-D) resolution. (Note that if one is simulating the geographic extern of an ice sheet, then at any given time different regions may be in different states. Indeed, for an ice-sheet in quasi-equilibrium, one would expect different portions of the ice sheet to be in each state, such that they approximately balance. Any individual spatial point (gridpoint) must, however, be in one and only one of the three states. While we may be able to make inferences about how the states interact to make a full cycle, and indeed in some cases even assign possible time-scales, this type of modeling approach does not explicitly solve for the progress of an ice sheet through time.
If we take the dynamical modeling approach, we assume we are investigating entire cycles of ice-shect growth, maintenance and decay. Each of these states has a particular time-scale attached to it, and the model marches forward in time from the onset of glaciation through the growth and maturation of the ice sheets until they decay back to approximately the original state of little or no ice. Multiple cycles may also be solved for. In principle, the spatial resolution of these models, as in the equilibrium approach, can range from a global average to full 3-D horizontal and vertical resolution. In practice, for a variety of reasons, these models are usually solved either for globally averaged quantities or zonally and vertically averaged quantities (one-dimensional resolution). While dynamic models of ice sheets are ultimately required and considerable work has been done in this regard (see review by Reference SaltzmanSaltzman, 1990), because our expertise is largely in equilibrium modeling we will not consider dynamical models any further in this paper.
Equilibrium Climate Modeling of Ice Sheets
From the point-of-view of equilibrium modeling we can consider the Southern Hemisphere (specifically Antarctica) as a case for explaining the current existence of an ice sheet or, conversely, answering the (more challenging) question of explaining conditions under which no Antarctic ice sheet would exist. The Northern Hemisphere, on the other hand, represents a case for explaining the current lack of large North American and Eurasian ice sheets (again, presumably accomplished by a model simulation of the present-day climate), or the more difficult problem of explaining the presence of past ice sheets where today there are none.
Antarctic Glaciation
Some studies of the Last Glacial Maximum have looked at Southern Hemisphere effects, including implications for the Antarctic ice sheets. Some pre-Pleistocene (e.g. Cretaceous) modeling studies have mentioned implications for high-latitude Southern Hemisphere land masses, though the focus of these sludies was elsewhere. In many of these Studies it was difficult to obtain or infer the ice-free conditions thought to have existed during the Cretaceous. Reference Crowley, Hyde and ShortCrowley and others (1989) have used energy-balance models (EBMs) extensively to look at possible glaciation for Southern Hemisphere land masses, addressing such factors as the size of the continent, and its position relative to the South Pole. These studies are limited by the lack of an explicit hydrologic cycle in the EBM. Reference Crowley, Hyde and ShortCrowley and others (1989) came to two major conclusions: (1) the larger the high-latitude land mass, the greater the summer-time heating and the lower the likelihood of glaciation; and (2) a continent centered on the Pole is less likely to have glaciation than one in which the Pole is located near a coast.
Oglcsby (1989,1991) used a GCM (NCAR CCM1, U.S. National Center for Atmospheric Research) to look at explicit factors that might be important in initiating or eliminating Antarctic glaciation, looking at many of the same factors as Reference Crowley, Hyde and ShortCrowley and others (1989). Conclusions different from the previous EBM studies were obtained. Oglesby found that sea-surface temperatures (SSTs) and continentality (including the joining of Australia to Antarctica) had relatively minor effects, and that increasing continentality actually increased the likelihood of glaciation by removing regions from the moderating (warming) effect of the ocean. Instead, the largest control was exerted by the topography of Antarctica itself, and the higher the mean elevation of the continent meant the greater the likelihood of glaciation. Since at present the ice sheet itself is the most significant contributor to the elevation of Antarctica, this also implies the importance of elevation feedbacks as the ice sheet grows or shrinks.
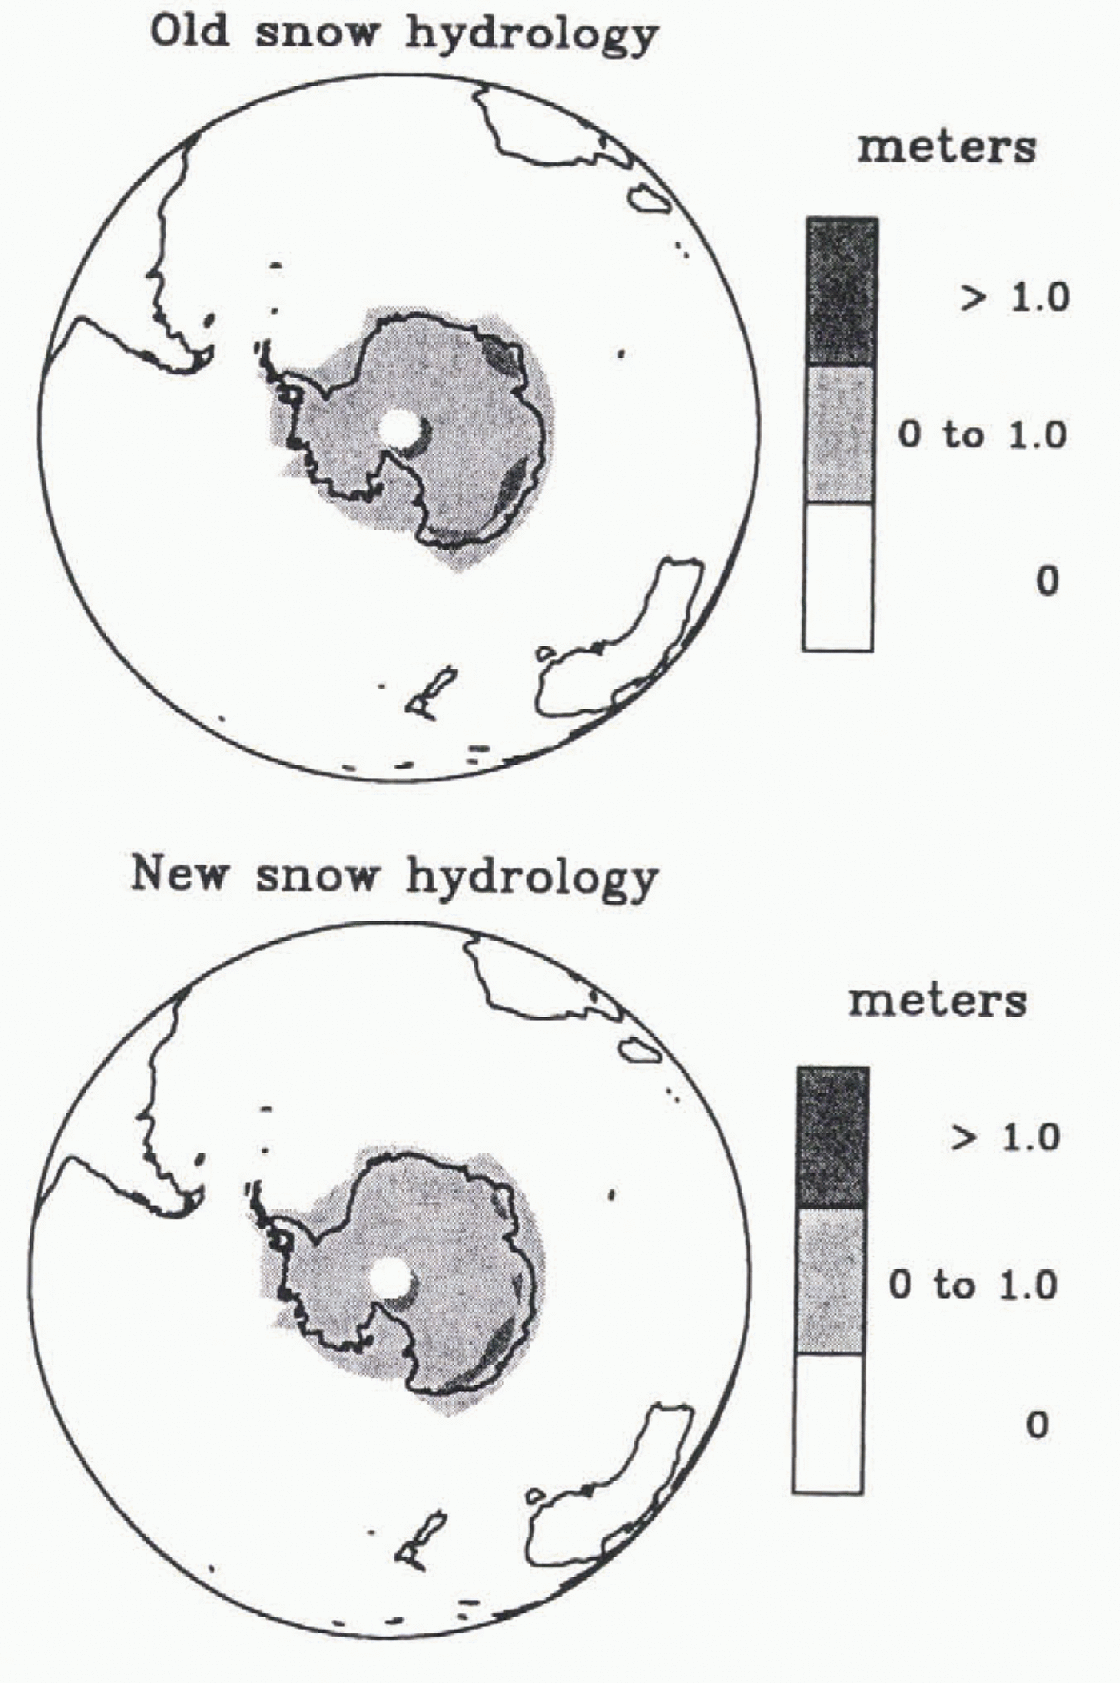
Reference Marshall and OglesbyMarshall and Oglesby (1994) reassessed these CCMl results with an improved snow hydrology (see Reference Marshall, Nolin, Oglesby and BatesMarshall and others, 1997) and found that because little snowmell occurred, there were no substantive changes in the results. Figure 1 shows snow cover over Antarctica for a case with present-day topography bin with SSTs everywhere above freezing (i.e., no sea ice around Antarctica) and with the standard snow hydrology and the improved snow hydrology of Reference Marshall and OglesbyMarshall and Oglesby (1994). Note that even with the warmer conditions, extensive snow exists over all Antarctic gridpoints, and furthermore, no significant difference is seen between the old and new snow-hydrology cases.

Fig. 1. Snow depth over Antarctica for a CCM1 case with present-day geography and topography, but SST warmed by up to 15°C and no sea ice. Gray shades are from 0.0–8.0 m liquid water equivalent.
Reference OglesbyOglesby (1989) also found that large changes in atmos¬pheric CO2 had a relatively small impact on Antarctic ice sheets, a result further confirmed by Reference Verbitsky and OglesbyVerbitsky and Oglesby (1995), who used GCM results as input into an ice-sheet model, and then explicitly simulated the growth of resulting ice sheets. Small regions of both increased and decreased ice growth were found with a doubling of CO2, with no indication of a catastrophic collapse of the West Antarctic ice sheet, as has sometimes been suggested with future greenhouse warming.
Northern Hemisphere Glaciation
Prior to about 2.5 Ma according to the geological evidence, the Northern Hemisphere is thought to have been largelyor completely ice-free (apart from possible small mountain glaciers). Since then, large ice sheets have waxed and waned over much of the mid- and high-latitude land masses in a quasi-periodic fashion, culminating in the approximately 100 ka glacial cycles of the Late Quaternary. In a climate-modeling context, Northern Hemisphere glaciation can be looked at in two distinct ways: (1) the effects of ice sheets on Northern Hemisphere (and global) climate, in which an ice sheet or ice sheets are imposed as a boundary Condition in the climate model, and their impact on atmospheric and/or oceanic climate is determined, and (2) the effects of climate on the ice sheets: that is, how did the ice sheets get there? Why do they go through cycles of advance and retreat?
Many studies, too numerous to mention here, have examined (1), with an emphasis on the Last Glacial Maximum. Less attention has been paid to (2), so our work in this regard is discussed in some detail.
(1) The Effects of Northern Hemisphere Ice Sheets on Climate
One drawback to many, but not all, previous studies is that they included other boundary and condition changes (e.g. solar radiation changes according to Milankovitch, albedo or CO2) in addition to ice sheets. The studies in general found that the ice sheets had a considerable impact on Northern Hemisphere atmospheric circulation and regional temperatures, and on the heat and moisture balance of the ocean. A gcneral global cooling is typically found, bin it is not always clear to what extent that is due to the ice sheets.
Reference Felzer, Oglesby, Webb and HymanFelzer and others (1996) systematically examined the effects of ice-shect size and height on climate, using a series ofsimulations with the NCAR CCM1, in which ice sheets of varying heights and areas were input, but with all otherwise set to present-day conditions. The results suggest a large local effect, but fairly small downstream effects due to the ice sheets, and that the area of an ice sheet was more important than its height in affecting climate. Reference Felzer, Webb and OglesbyFelzer and others (in press) used these ice-sheet results, as well as model results pertaining to atmospheric CO2 and orbital insola¬tion changes, to isolate the relative effects of each of the three in modeling the Last Glacial Maximum. At 21 ka, ice sheets and reduced atmospheric CO2 had roughly equal effects, but orbital insolation was much more minor (orbital characteristics at this time were not much different than at present).
(2) How do Northern Hemisphere Ice Sheets Come About?
A number of the GCM sludies that focused on the effects of ice sheets on climate noted the energy balance over their imposed ice sheets along with implications Ior growth or melt of the ice sheet (in virtually every case net melt was inferred). Reference Rind, Peteet and KuklaRind and others (1989) and Reference OglesbyOglesby (1990) were probably the first to consider explicitly the initiation of ice sheets in GCMs. Reference Rind, Peteet and KuklaRind and others (1989) imposed small amounts of snow (ice) in regions where Northern Hemisphere ice sheets are though to have initiated and evaluated the surface-energy budgets under a variety of orbital insolation regimes, and inferred whether the ice would melt or grow. Reference OglesbyOglesby (1990) took this a step further, and imposed snow cover over all Northern Hemisphere land points in the NCAR CCM1 so that model snow-hydrology processes then explicitly simulated whether the snow niched or grew. This was done for a variety of conditions, including reduced CO2 (but not orbital insolation changes), and led to the definition of “glaciation-sensitive” regions.
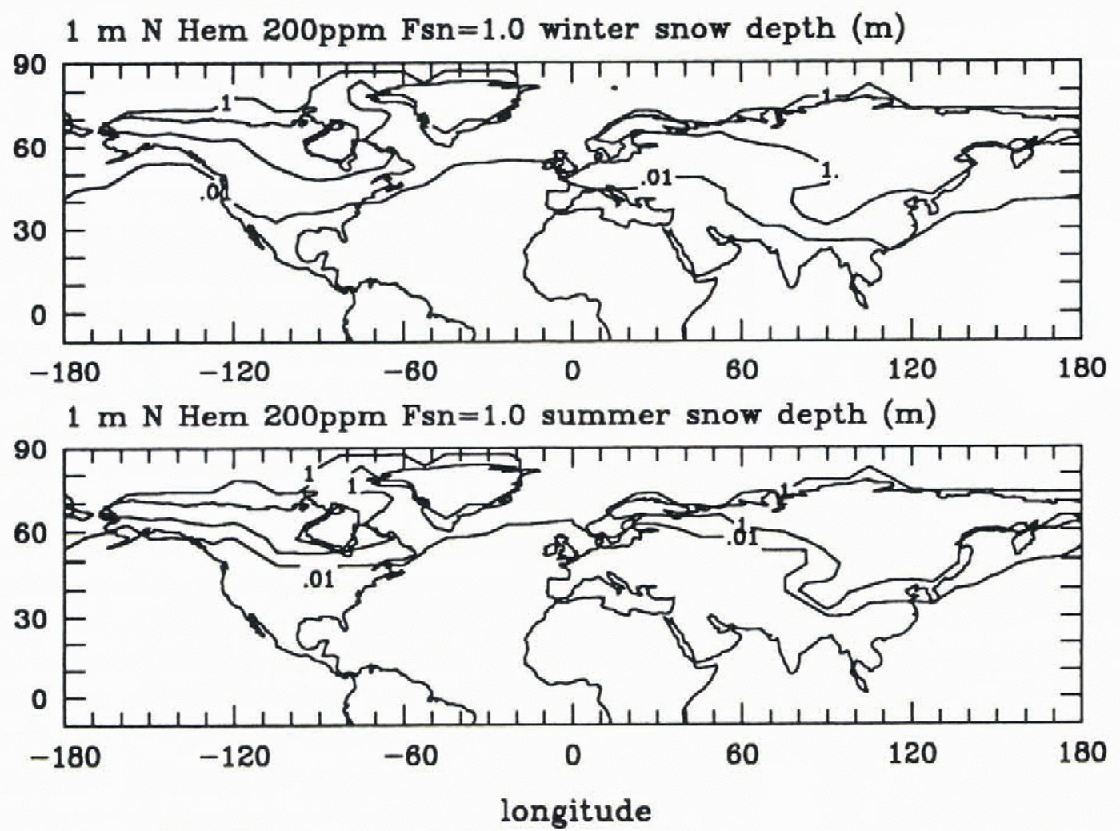
Figure 2 illustrates results for a case with 200 ppm CO2 (the model control uses a value of 330ppm) that matches observed Last Glacial Maximum ice sheets reasonably well over North America and Fenno-Scandinavia, but that overestimates ice extent over Siberia and Tibet. This study concluded that variations in atmospheric CO2 played a major role in determining which regions were classified as “glaciation sensitive”. Reference Marshall and OglesbyMarshall and Oglesby (1994) showed, however, that because extensive snowmelt occurs, the results of Reference OglesbyOglesby (1990) were in this case very sensitive to the specific snow-hydrology formulation involved.

Fig. 2. Snow cover over the Northern Hemisphere in winter after 3 years of a CCMl run in which 1 m of snow was initially imposed over all Northern Hemisphere land points, and with CO2 reduced to 200ppm. Contours (in liquid water equivalents) are 0.01 in (indicating the presence of shallow snow cover), 0.9 m, and 1.1 m (the latter two indicating where the initial snow cover has been maintained or increased).
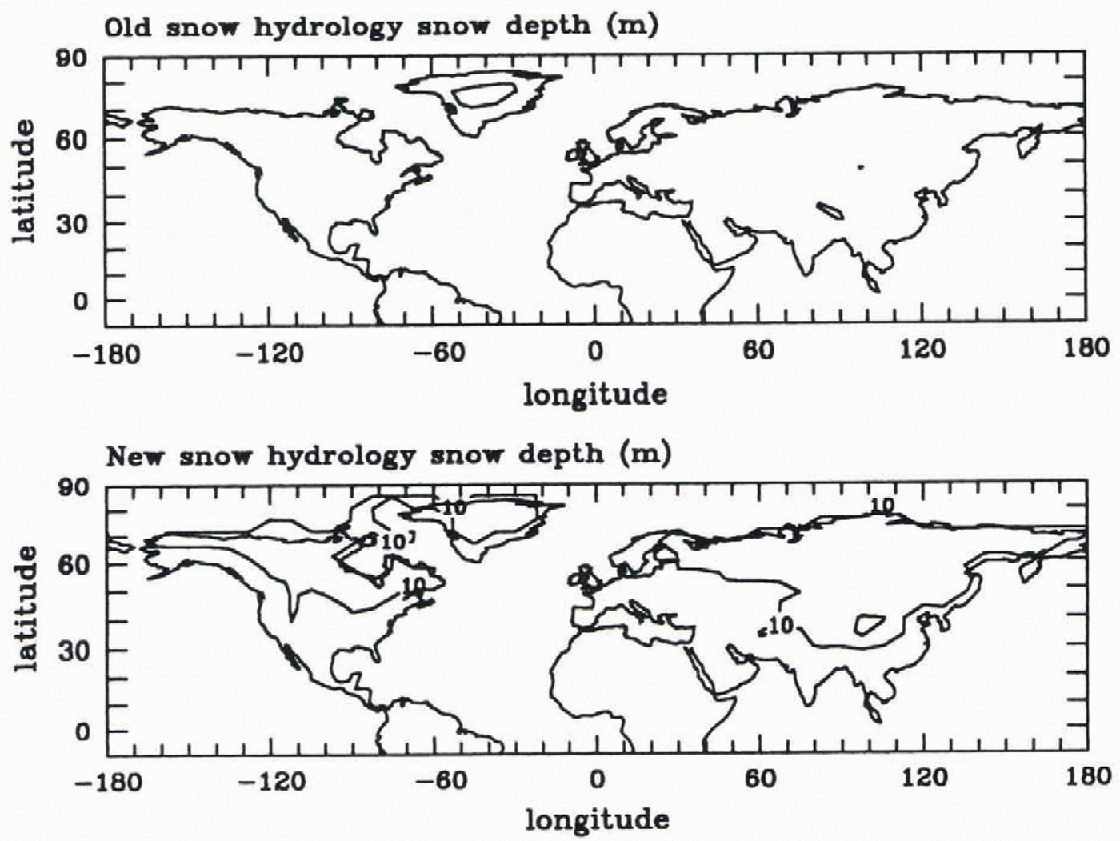
Figure 3 shows snow cover over the Norlliern Hemisphere after a 3 year run starting with 10m of initial snow over all Northern Hemisphere land points, using the standard CCMl “old” snow hydrology as well as the “new” snow-hydrology of Reference Marshall and OglesbyMarshall and Oglesby (1994). Note that with the new snow hydrology, the area that maintained 10m of snow cover is much larger, implying greater ice-sheet volumes than obtained by Reference Verbitsky and OglesbyVerbitsky and Oglesby (1992) (see below). This means ultimately that further improvements in snow hydrology (such as described by Reference Marshall, Nolin, Oglesby and BatesMarshall and others, 1997) are necessary to simulate the presence, absence, and volume of ice sheets.

Fig. 3. Snow cover over the Northern Hemisphere after 3 years of a run started with 10 m of liquid water-equivalent snow cover over all Northern Hemisphere land points. The contour shown is 10 m.
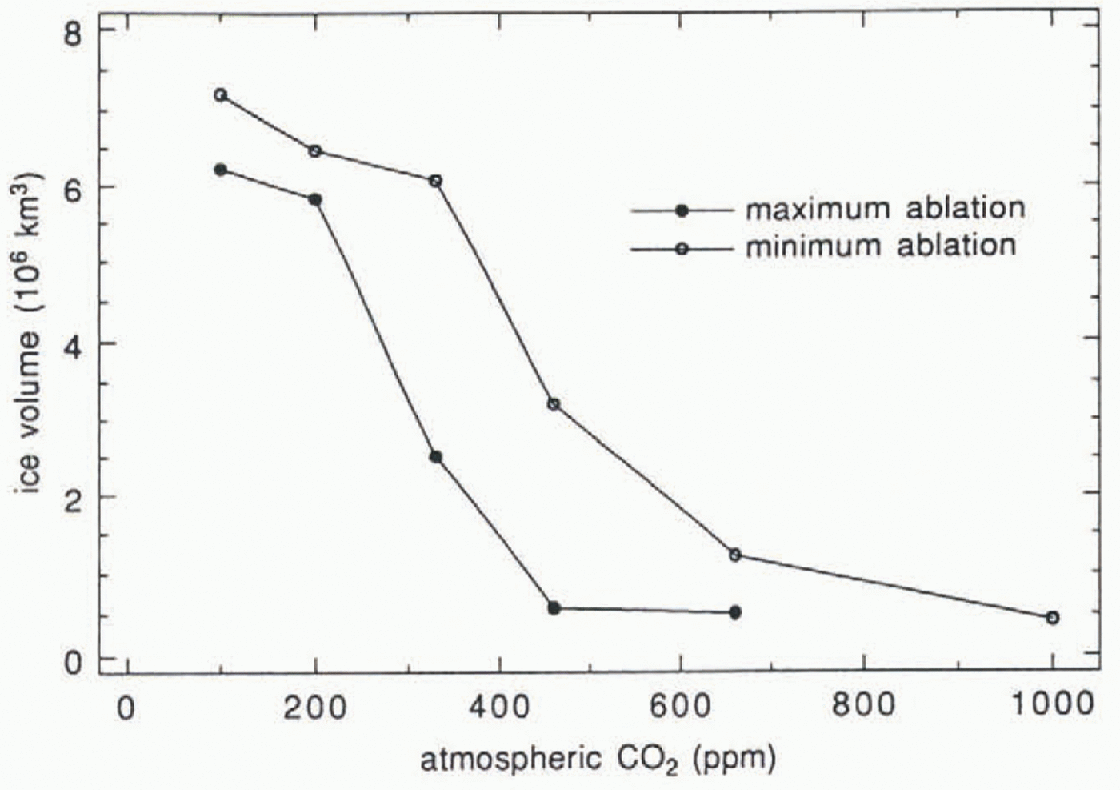
Reference Verbitsky and OglesbyVerbitsky and Oglesby (1992) explicitly simulated Northern Hemisphere glaciation as a function of atmospheric CO2 using results from Reference OglesbyOglesby (1990) and Reference Oglesby and SaltzmanOglesby and Saltzman (1992), in which a series of simulations with CCMl systematically varying atmospheric CO2 from 100–1000 ppm was made. Reference Verbitsky and OglesbyVerbitsky and Oglesby (1992) imposed snow everywhere over the Northern Hemisphere, varied CO2, and then used an ice-sheet model in conjunction with the GCM results to simulate the volume of ice sheets for each of the CO2 values. They found that the volume of ice decreased approximately linearly with increases in CO2, but the volume of ice was an order of magnitude less than that reconstructed for actual ice sheets during the late Quaternary. Figure 4 shows ice volume as a function Of CO2, for the Northern Hemisphere. Reference Verbitsky and OglesbyVerbitsky and Oglesby (1992) concluded that CO2 was not a primary driver of the Pleistocene ice ages, but that it may have played an important secondary role in determining the volume of ice that occurred.

Fig. 4. Northern Hemisphere ice volume (in millions km3) as a function of atmospheric CO2 (in ppm) for two slightly different snowmelt formulations, as simulated using the CCM1
Discussion and Conclusions
Key Results and Implications
-
(1) To first order, the topography and polar position of the continent are most important in explaining the presence or absence of large ice sheets over Antarctica, while SSTs play a more secondary role, acting to modify the extent of glaciation but not its occurrence. Continentality (that is, the size of the continent without regard to geographic or polar position) appears to play a tertiary role at best, meaning, for example, that the attachment of Australia to Antarctica prior to about 40–50 Ma has little effect. Atmospheric CO2 concentration has little impact on the presence or size of the Antarctic ice sheet.
-
(2) Important conclusions regarding Northern Hemisphere glaciation are that atmospheric CO2 concentration has a significant effect on the location and extent of continental ice sheets, but that the total ice volume involved is small compared to the total amount observed at present or inferred to exist during the Pleistocene ice ages. Furthermore, snow cover as an initial condition plays a role in model-determined glaciation, suggesting the importance of consecutive years of abnormally heavy winter snow fall.
What Needs to be Done
All of these previous modeling sludies suffer from use of crude models that in many ways are inadequate to the task at hand. Current models suffer from (1) deficiencies in the simulation of the present-day observed climate, affecting the accuracy lo which they can compute the large-scale convergence of water vapor; (2) coarse resolution, meaning that topographic features and mesoscale climates cannot adequately be simulated; and (3) simplifications and deficiencies in the treatment of snow physics, especially with regard to snowmelt.
Acknowledgements
This work has been supported by a Department of Energy grant to Purdue University (DOE FG02-85ER60304) and a NOAA grant (NA 66GP0268) to the University of North Carolina-Charlotte.


