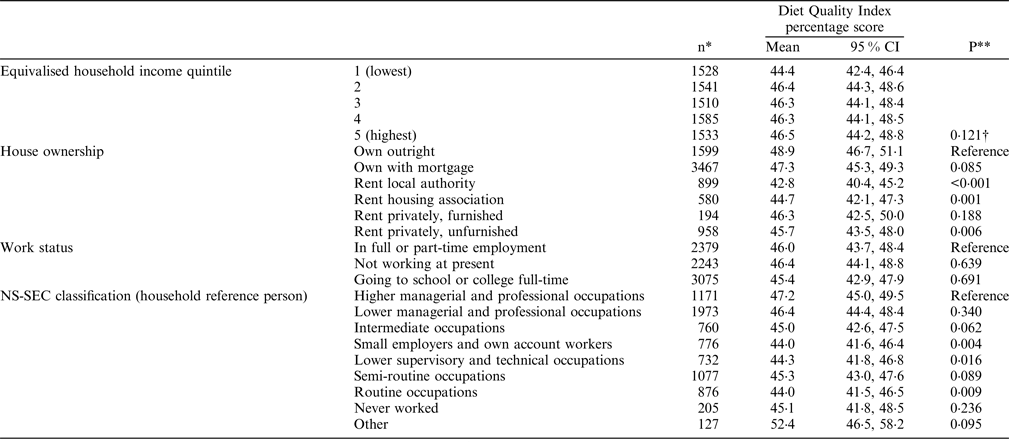
Diet Quality Indices (DQIs) assess the extent to which individuals' overall diet conforms to dietary guidelines. A DQI originally developed in 2009 to score diets in line with the then Scottish Dietary Targets(Reference Armstrong, Sherriff and Wrieden1), has recently been updated in line with the current Scottish Diet Goals(2). The aim of the present study was to investigate the association of this updated DQI with socio-economic factors, in the UK population from years 1–6 (2008–2014) of the National Diet and Nutrition Survey. A score (0–10) was assigned to each of the 9 DQI components (fruit and vegetables, oily fish, red and processed meat, total fat, saturated fat, total carbohydrates, free sugars, fibre and energy density) then summed and adjusted to a percentage score. Associations between DQI score and socio-economic factors were examined in those aged 2+ years adjusting for the other socio-economic variables, survey year, country, sex, age, ethnicity, number of people in household and children in household.
Mean DQI percentage scores were low overall (mean 41·5; 95 % CI 40·9, 42·0) and in all subgroups. DQI was significantly related to house ownership and NS-SEC classification with those owning their own home and those in managerial and professional occupations having the highest DQI. Although household income and work status were related to DQI score in univariate analyses (results not shown), when adjusting for other factors they were no longer significant. There were clear associations between diet quality and house ownership and occupation in the UK population between 2008–2014.

*unweighted n. **Multivariate GLM applying sampling weighting variables. †P for linear trend.
This work was supported by funding from the Scottish Government's Rural and Environment Science and Analytical Services (RESAS) division.


