Nutrient profiling (NP) ranks foods according to their nutritional composition and is used for public health initiatives such as educating consumers, food regulation or to guide reformulation(Reference Rayner1). It has the potential to help consumers make improved food choices(Reference Roodenburg2). The objective was to compare the classification of bakery products by a government-endorsed NP model that regulates health claims and an industry-specific model that drives reformulation.
Using the University of Toronto 2017 Food Label Information Program, bakery products (n = 2809) were evaluated using two NP models: Nestlé Nutrient Profiling System (NNPS) and Food Standards of Australia New Zealand Nutrient Profiling Scoring Criterion (FSANZ). Bakery products were the major contributor to sodium intake in the diets of Canadians in 2017. Percentage of products classified as ‘pass’ (if all nutrient targets were met) or ‘fail’ by the NNPS (by regulated reference amounts) and FSANZ (by 100g) were calculated.
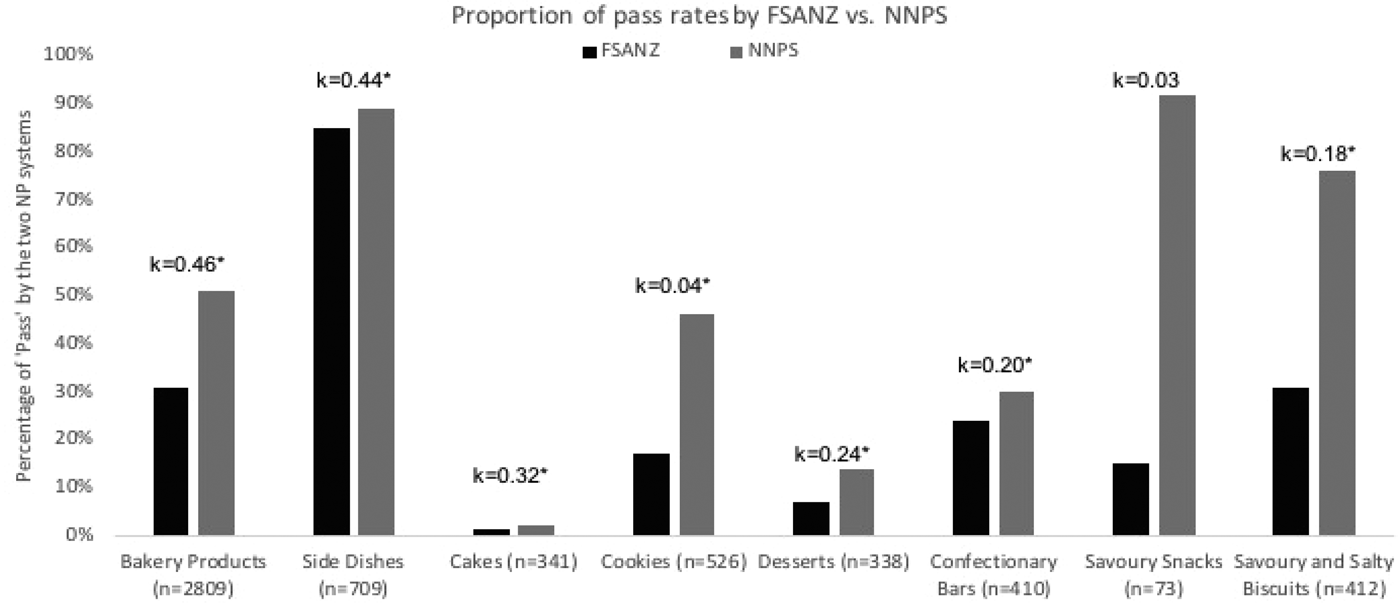
The NNPS model categorised 51 % of the products as passing all NNPS criteria, compared with 31 % ‘pass’ by FSANZ. Overall, agreement was 73 % (range 23 %−88 %) and kappa= 0.46 (p < 0.001), defined as ‘moderate’ agreement between the models. Percent agreement and kappa-statistic for sub-categories between NNPS and FSANZ are shown in Figure 1. Sodium was lower in products that met the standards in all categories for both NP systems, except for savory snacks that passed the NNPS criteria. There were no differences in the sodium and sugar content of confectionary bars and cookies, cakes and desserts for products that failed both models’ standards, however, sugar was higher in products that ‘passed’ NNPS standards vs. those that ‘passed’ FSANZ.

Fig. 1. Comparison of proportion of products that met the standards of both FSANZ and NNPS (*p < 0.001).
In conclusion, FSANZ was more stringent for evaluating the nutrient content of bakery products in comparison with NNPS, particularly for some products with small serving sizes (e.g. savoury snacks/biscuits). NNPS highlighted reformulation potential in categories with multiple nutrients to limit (e.g. cakes, cookies and desserts, confectionary bars). This study provides information on the differences and similarities of NP models and potential evolution of profiling systems to guide reformulations and enable different public health initiatives.


