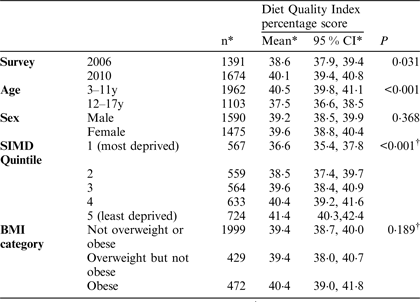
Diet Quality Indices (DQIs) are a hypothesis driven dietary patterns analysis method which assess the extent to which diets conform to dietary guidelines. The aim of the present study was to investigate the association of a DQI based on the Scottish Diet Goals(1) with age, sex, deprivation and obesity in children aged 3–17 years. Surveys of diet and health in Scottish children were carried out in 2006 and 2010(Reference Sheehy, McNeill and Masson2, Reference Masson, Bromley and Macdiarmid3). Habitual diet was assessed using the Scottish Collaborative Group FFQ; version C2 for children aged 3–11 years and version C3 for young people aged 12–17 years. Height and weight were measured by trained fieldworkers. Nutrient intakes were calculated using the National Diet and Nutrition Survey databank. FFQs with energy intakes below the 2·5 and above the 97·5 centiles were excluded from analysis to remove outliers, leaving 3,065 FFQs for analysis. A DQI (scoring intakes of fruit and vegetables, oily fish, red and processed meat, total fat, saturated fat, NMES, NSP and energy density) adapted from one used previously for Expenditure and Food Survey data(Reference Armstrong, Sherriff and Wrieden4) was calculated. A score was assigned to each of the 8 components (maximum score 10 for each) then summed and adjusted to a percentage score. Associations between DQI percentage scores and survey year, age, sex, quintiles of Scottish Index of Multiple Deprivation (based on postcode) and BMI category (based on UK 1990 charts) were examined taking account of sample design and survey response weighting variables.

*n, mean and 95 % CI all for unweighted data. †P for linear trend.
The mean DQI percentage score was low in all subgroups. The mean DQI score was higher in 2010 than in 2006 suggesting that children's diets in Scotland improved over this time period. Clear associations between DQI and socio-economic deprivation and age were found with the least deprived and youngest children having better diet quality scores but there were no associations with sex or BMI.
The original study was funded by the Food Standards Agency Scotland. This work was supported by funding from the Scottish Government's Rural and Environment Science and Analytical Services (RESAS) division.


