Recently, sugar contents of foods were reported for the first time in the Standard Table of Food Composition in Japan 2015 (STFCJ). However, only one third of food items included sugar contents with no data for added and free sugar. We therefore estimated habitual intakes for total, added and free sugar in Japanese adults after we developed a comprehensive database based on STFCJ.
Apparently healthy workers aged 20–69 years (196 men and 196 women, mean BMI 23·3 kg/cm2) conducted 4-d weighed dietary records in 2013. Total sugar contents for foods with missing information in STFCJ were assigned using a data-gathering method( Reference Rand, Pennington and Murphy 1 ). Added and free sugar contents were assigned using a published 10-step method( Reference Louie, Moshtaghian and Boylan 2 ). Of the 2222 food items in STFCJ, 2154 (96·9 %) were assigned for total sugar and 2212 (99·5 %) for added and free sugar. Habitual intakes were estimated using the Best-power method( Reference Nusser, Carriquiry and Dodd 3 ).
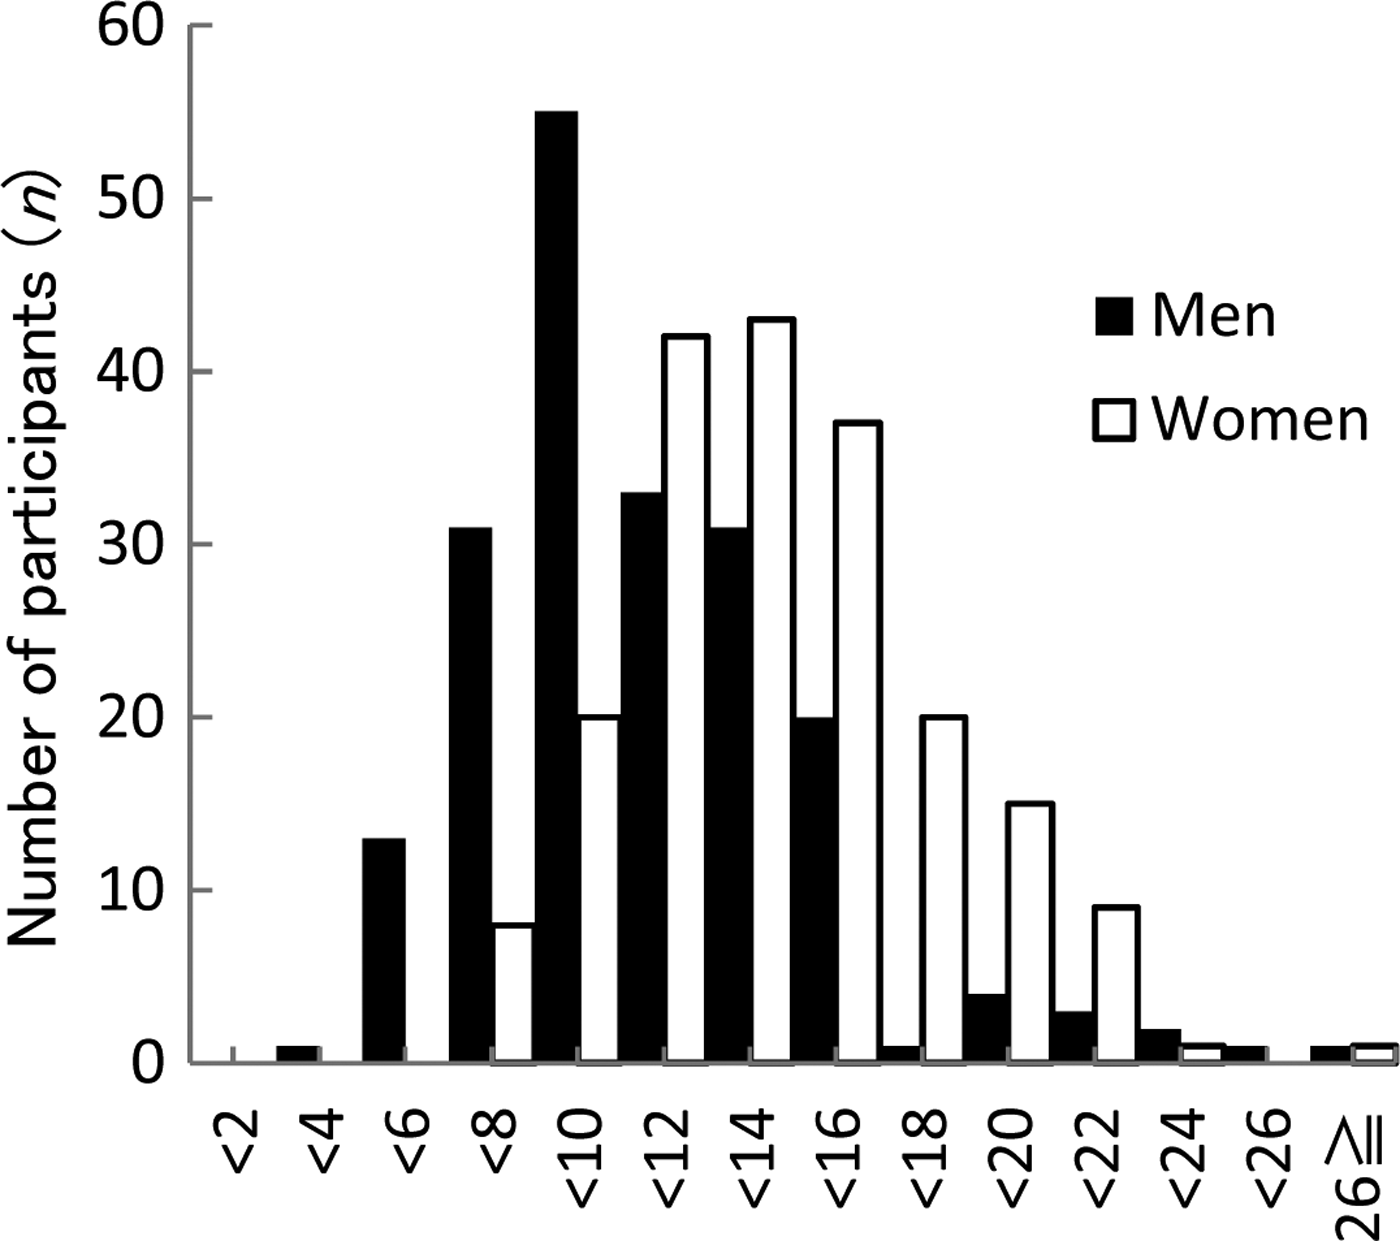
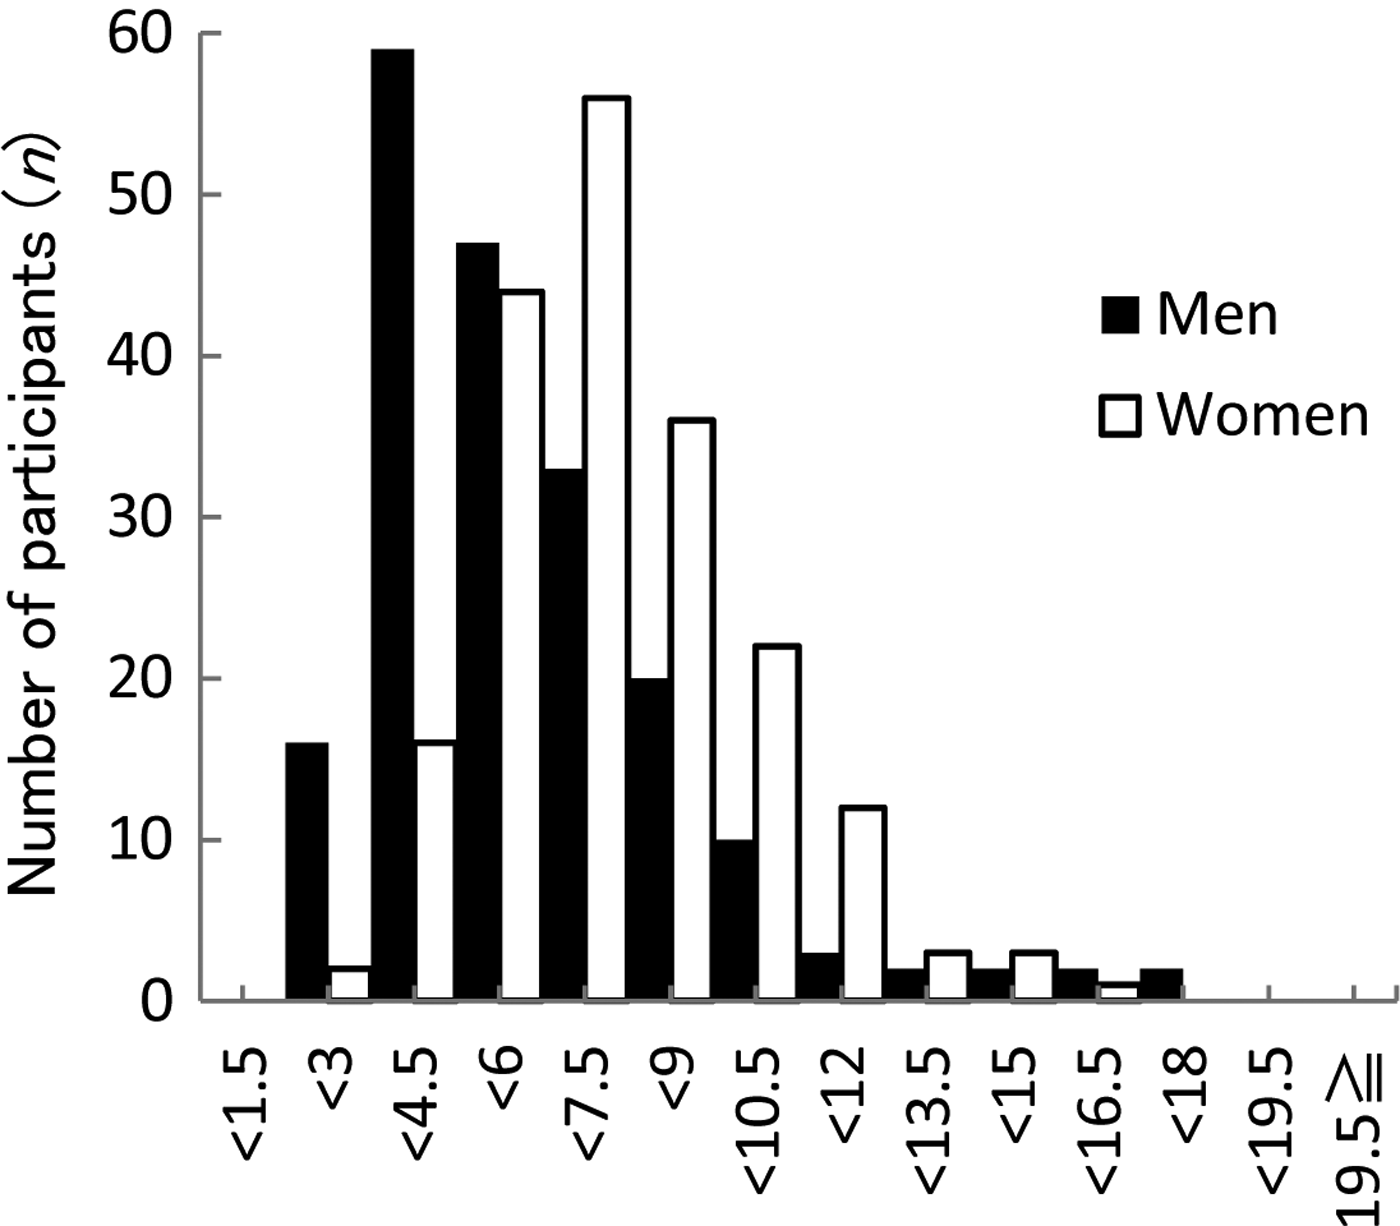
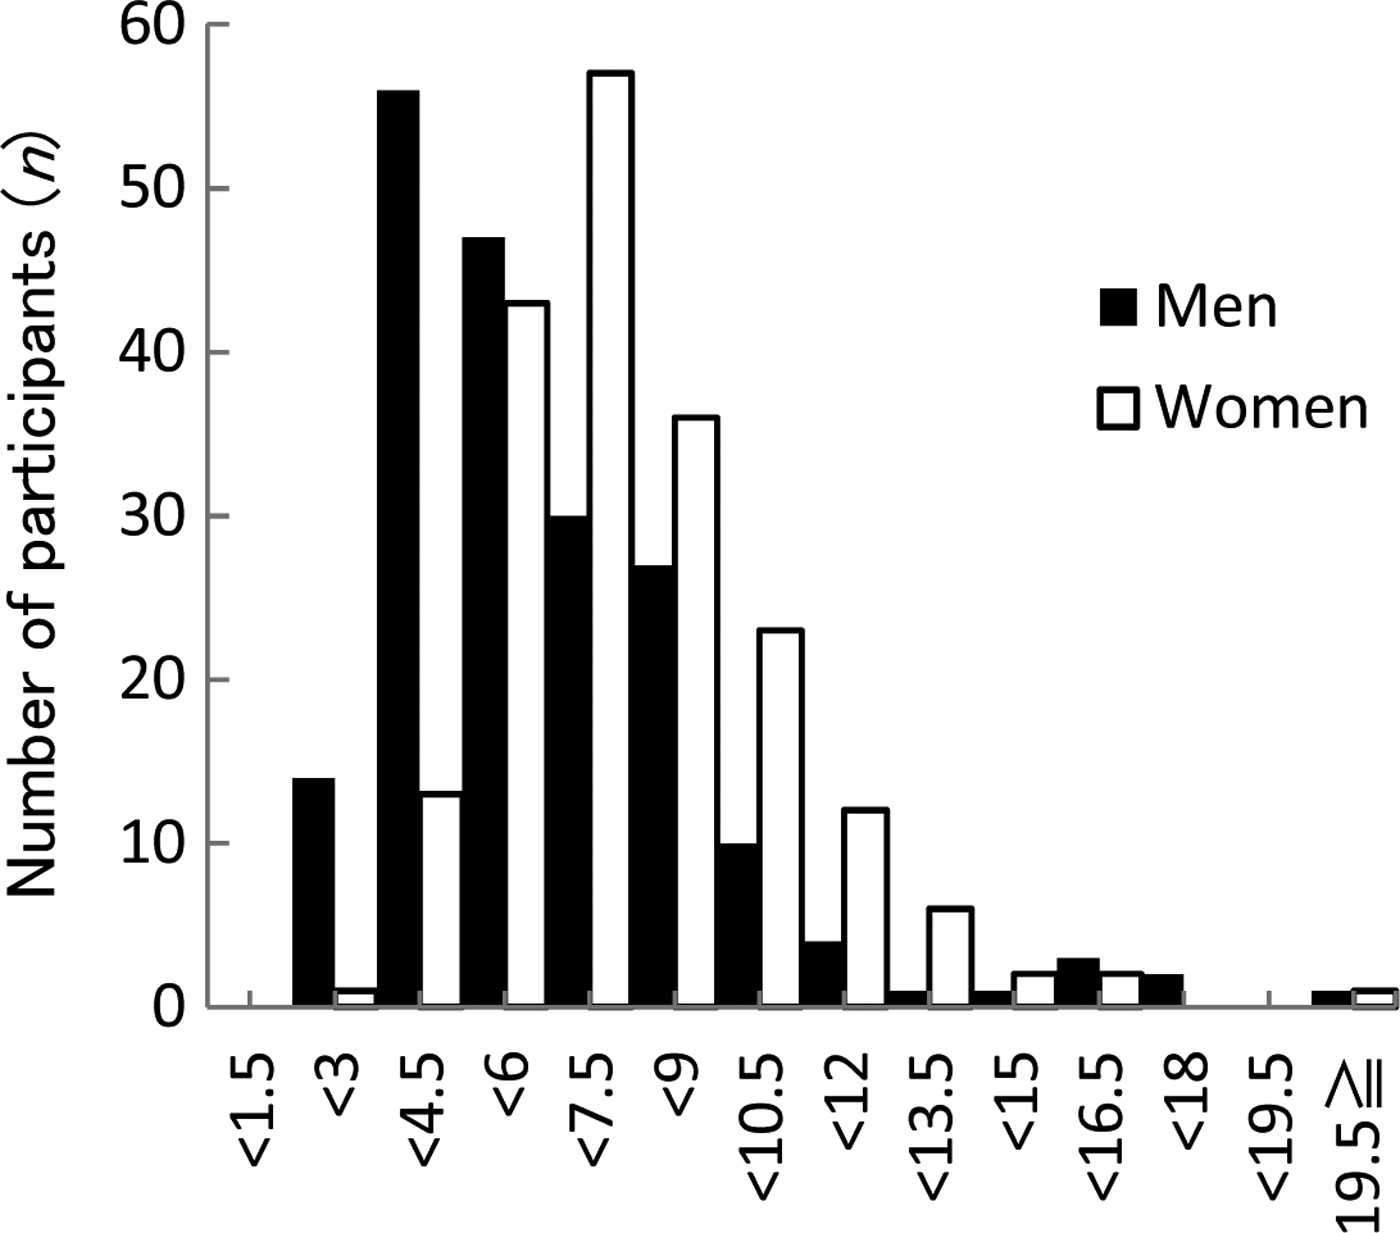
Women had higher mean habitual intakes of total sugar (13·5 vs. 10·7 % energy (%E)), added sugar (7·2 vs. 5·8 %E), and free sugar (7·4 vs. 6·1 %E) than men, respectively (all p < 0·0001; Figs. 1–3). For free sugar intake (Fig. 3), 8·2 % for men and 13·3 % for women exceeded the recommendation by WHO (10 %E), while the percentage of participants consuming <5 %E (the WHO conditional recommendation and the UK recommendation) was 44·9 % for men and 12·2 % for women, respectively.

Fig. 1. Total sugar (%E)

Fig. 2. Added sugar (%E)

Fig. 3. Free sugar (%E)
In conclusion, mean sugar intakes in this Japanese population were lower than those in Western countries (14·5–20·2 %E for total sugar and 7·3–13·2 %E for added sugar( Reference Azaïs-braesco, Sluik and Maillot 4 , Reference Ervin and Ogden 5 )). Nevertheless, while the prevalence of excessive intake (≥10 %E of free sugar) was low, there were only a few participants whose intake was within the recommended limit (<5 %E of free sugar), particularly in women.


