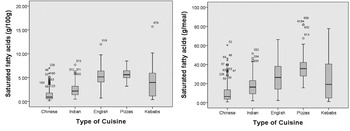
Food prepared outside the home has increased in popularity, this food tends to be energy dense, higher in total fat, saturated fatty acids (SFA), sugar and salt( Reference Dunford, Webster and Barzi 1 , Reference Jaworowska, Blackham and Stevenson2 ). There is limited data on the SFA content of takeaway food from independent establishments and SFA are associated with lipid abnormalities( Reference Kuipers, de Graaf and Luxwolda 3 ). The aim of the present study was to analyse the SFA content of popular takeaway foods from various meal categories of independent establishments in Merseyside, UK. Samples of takeaway meals (n=559) were collected from small independent establishments and analysed by an accredited public analyst laboratory. Total SFA content was analysed in g/100 g and calculated g/meal. Meal categories were compared using the Kruskal-Wallis Test. Results revealed a high variability in SFA within meals and significant differences between meal categories (p=0.000, Figure). Pizza meals were the highest in SFA with up to 85.3 g per meal. When compared to UK recommendations (20–30 g/day) many of the meals exceeded this recommendation from just one meal (Figure).

Figure. Comparison of Total SFA content per 100 g and per meal by meal category.
While SFA have recently shown a reduction in the UK population, dietary recommendations have still not been met( Reference Pot, Prynne, Roberts and Olson 4 ) and food eaten out of the home has increased. The variability in the data shows that SFA content of takeaway food can be lower, and reformulations may achieve this. The current study shows certain takeaway foods to be excessively high in SFA; frequent consumption would increase the risk of non-communicable disease. We have reported takeaway food to be high in salt, energy and total fat( Reference Jaworowska, Blackham and Stevenson 2 , Reference Jaworowska, Blackham and Stevenson5 ) and frequent consumption of takeaway food increases the risk of obesity and insulin resistance( Reference Smith, Blizzard and McNaughton 6 ). The current study adds to the literature showing certain takeaway food is also high in SFA. Further analysis will establish the overall quality of fat and other nutritional components in takeaway food, and research on the frequency and amount of consumption is warranted.


