We use cookies to distinguish you from other users and to provide you with a better experience on our websites. Close this message to accept cookies or find out how to manage your cookie settings.
To save content items to your account,
please confirm that you agree to abide by our usage policies.
If this is the first time you use this feature, you will be asked to authorise Cambridge Core to connect with your account.
Find out more about saving content to .
To save content items to your Kindle, first ensure no-reply@cambridge.org
is added to your Approved Personal Document E-mail List under your Personal Document Settings
on the Manage Your Content and Devices page of your Amazon account. Then enter the ‘name’ part
of your Kindle email address below.
Find out more about saving to your Kindle.
Note you can select to save to either the @free.kindle.com or @kindle.com variations.
‘@free.kindle.com’ emails are free but can only be saved to your device when it is connected to wi-fi.
‘@kindle.com’ emails can be delivered even when you are not connected to wi-fi, but note that service fees apply.
Chapter 4 provides a detailed coverage of methods for the evaluation of predictive models: the methods applicable to regression models implementing estimation biomarkers, as well as methods evaluating binary and multiclass classification models. Discussion of resampling techniques is accompanied by accentuating the danger of information leakage and by emphasizing the paramount importance of avoiding internal validation. Discussion of metrics for the evaluation of classification biomarkers includes the issue of proper and improper interpretation of sensitivity and specificity, illustrated by an example of a screening biomarker targeting a population with low prevalence of the tested disease. For such biomarkers, positive predictive value may be unacceptably low even when the biomarker has a very high specificity and sensitivity. Discussed in this chapter are also misclassification costs and incorporating them into cost-sensitive classification.
Despite the recognised importance of mental disorders and social disconnectedness for mortality, few studies have examined their co-occurrence.
Aims
To examine the interaction between mental disorders and three distinct aspects of social disconnectedness on mortality, while taking into account sex, age and characteristics of the mental disorder.
Method
This cohort study included participants from the Danish National Health Survey in 2013 and 2017 who were followed until 2021. Survey data on social disconnectedness (loneliness, social isolation and low social support) were linked with register data on hospital-diagnosed mental disorders and mortality. Poisson regression was applied to estimate independent and joint associations with mortality, interaction contrasts and attributable proportions.
Results
A total of 162 497 individuals were followed for 886 614 person-years, and 9047 individuals (5.6%) died during follow-up. Among men, interaction between mental disorders and loneliness, social isolation and low social support, respectively, accounted for 47% (95% CI: 21–74%), 24% (95% CI: −15 to 63%) and 61% (95% CI: 35–86%) of the excess mortality after adjustment for demographics, country of birth, somatic morbidity, educational level, income and wealth. In contrast, among women, no excess mortality could be attributed to interaction. No clear trends were identified according to age or characteristics of the mental disorder.
Conclusions
Mortality among men, but not women, with a co-occurring mental disorder and social disconnectedness was substantially elevated compared with what was expected. Awareness of elevated mortality rates among socially disconnected men with mental disorders could be of importance to qualify and guide prevention efforts in psychiatric services.
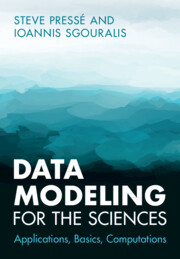
With the increasing prevalence of big data and sparse data, and rapidly growing data-centric approaches to scientific research, students must develop effective data analysis skills at an early stage of their academic careers. This detailed guide to data modeling in the sciences is ideal for students and researchers keen to develop their understanding of probabilistic data modeling beyond the basics of p-values and fitting residuals. The textbook begins with basic probabilistic concepts, models of dynamical systems and likelihoods are then presented to build the foundation for Bayesian inference, Monte Carlo samplers and filtering. Modeling paradigms are then seamlessly developed, including mixture models, regression models, hidden Markov models, state-space models and Kalman filtering, continuous time processes and uniformization. The text is self-contained and includes practical examples and numerous exercises. This would be an excellent resource for courses on data analysis within the natural sciences, or as a reference text for self-study.
Banana is one of the main fruit crops in the world as it is a rich source of nutrients and has recently become popular for its fibre, particularly as a raw material in many industries. Mathematical models are crucial for strategic and forecasting applications; however, models related to the banana crop are less common, and reviews on previous modelling efforts are scarce, emphasizing the need for evidence-based studies on this topic. Therefore, we reviewed 75 full-text articles published between 1985 and 2021 for information on mathematical models related to banana growth and, fruit and fibre yield. We analysed results in order to provide a descriptive synthesis of selected studies. According to the co-occurrence analysis, most studies were conducted on the mathematical modelling of banana fruit production. Modellers often used multiple linear regression models to estimate banana plant growth and fruit yield. Existing models incorporate a range of predictor variables, growth conditions, varieties, modelling approaches and evaluation methods, which limits comparative evaluation and selection of the best model. However, the banana process-based simulation model ‘SIMBA’ and artificial neural network have proven their robust applicability to estimate banana plant growth. This review shows that there is insufficient information on mathematical models related to banana fibre yield. This review could aid stakeholders in identifying the strengths and limitations of existing models, as well as providing insight on how to build novel and reliable banana crop-related mathematical models.
Personalised nutrition (PN) is an emerging field that bears great promise. Several definitions of PN have been proposed and different modelling approaches have been used to claim PN effects. We tentatively propose to group these approaches into two categories, which we term outcome-based and population reference approaches, respectively. Understanding the fundamental differences between these two types of modelling approaches may allow a more realistic appreciation of what to expect from PN interventions presently and may be helpful for designing and planning future studies investigating PN interventions.
Although the species–area relationship (SAR) is commonly presumed to be either a power law or to follow the logarithmic relationship, a large number of other mathematical expressions have been proposed to describe the relationship. These models can be divided into four general categories, distinguishing between asymptotic and non-asymptotic, and between convex upward and sigmoid models (in arithmetic space). The choice of regression model should not be determined by best fit alone; rather, the choice should relate to the purpose of fitting mathematical models to SAR data: either descriptive, explicative or predictive. Therefore, we should choose models that are likely to result from expected ecological patterns. We argue that neither (accumulative) sample-area SARs (saSARs) nor island SARs (ISARs) have upper asymptotes and ISARs may be sigmoid if the smallest islands (finest scales) are included. Amongst the 30 different models we review here, few are non-asymptotic. Both the power model and logarithmic model return convex non-asymptotic curves, whereas the second persistence (P2) model and the quadratic logarithmic model consistently return sigmoid curves without asymptotes. We add the Tjørve-hybrid to this shortlist, as it can be useful when neither the power nor the logarithmic model provides a good fit to saSAR data.
Biostatistics with R provides a straightforward introduction on how to analyse data from the wide field of biological research, including nature protection and global change monitoring. The book is centred around traditional statistical approaches, focusing on those prevailing in research publications. The authors cover t-tests, ANOVA and regression models, but also the advanced methods of generalised linear models and classification and regression trees. Chapters usually start with several useful case examples, describing the structure of typical datasets and proposing research-related questions. All chapters are supplemented by example datasets, step-by-step R code demonstrating analytical procedures and interpretation of results. The authors also provide examples of how to appropriately describe statistical procedures and results of analyses in research papers. This accessible textbook will serve a broad audience, from students, researchers or professionals looking to improve their everyday statistical practice, to lecturers of introductory undergraduate courses. Additional resources are provided on www.cambridge.org/biostatistics.
In insurance underwriting, misrepresentation represents the type of insurance fraud when an applicant purposely makes a false statement on a risk factor that may lower his or her cost of insurance. Under the insurance ratemaking context, we propose to use the expectation-maximization (EM) algorithm to perform maximum likelihood estimation of the regression effects and the prevalence of misrepresentation for the misrepresentation model proposed by Xia and Gustafson [(2016) The Canadian Journal of Statistics, 44, 198–218]. For applying the EM algorithm, the unobserved status of misrepresentation is treated as a latent variable in the complete-data likelihood function. We derive the iterative formulas for the EM algorithm and obtain the analytical form of the Fisher information matrix for frequentist inference on the parameters of interest for lognormal losses. We implement the algorithm and demonstrate that valid inference can be obtained on the risk effect despite the unobserved status of misrepresentation. Applying the proposed algorithm, we perform a loss severity analysis with the Medical Expenditure Panel Survey data. The analysis reveals not only the potential impact misrepresentation may have on the risk effect but also statistical evidence on the presence of misrepresentation in the self-reported insurance status.
Objectives: Fatigue is a common and persisting symptom after childhood brain injury. This study examined whether child characteristics and symptomatology preinjury or 6 months postinjury (pain, sleep, and mood, inattention) predicted fatigue at 12months postinjury. Methods: Parents of 79 children (0–18 years) rated fatigue at 12 months after injury on a multidimensional scale (general, sleep/rest, and cognitive). Demographic and clinical data were collected at injury. Parents rated child sleep, pain, physical/motor function, mood, and inattention at injury (preinjury description), and 6 months postinjury. Children were divided into two traumatic brain injury severity groups: mild TBI (n=57) and moderate/severe TBI (n=27). Hierarchical regression models were used to examine (i) preinjury factors and (ii) symptoms 6 months postinjury predictive of fatigue (general, sleep/rest, and cognitive) at 12 months postinjury. Results: Sleep/rest fatigue was predicted by preinjury fatigue (7% of variance) and psychological symptoms preinjury (10% of variance). General fatigue was predicted by physical/motor symptoms (27%), sleep (10%) and mood symptoms (9%) 6 months postinjury. Sleep/rest fatigue was predicted by physical/motor symptoms (10%), sleep symptoms (13%) and mood symptoms (9%) 6 months postinjury. Cognitive fatigue was predicted by physical/motor symptoms (17%) 6 months postinjury. Conclusions: Preinjury fatigue and psychological functioning identified those at greatest risk of fatigue 12 months post-TBI. Predictors of specific fatigue domains at 12 months differed across each of the domains, although consistently included physical/motor function as well as sleep and mood symptoms postinjury. (JINS, 2018, 24, 224–236)
This study examined how relevant Rowe and Kahn’s three criteria of successful aging were to older adults’ self-portrayals in online dating profiles: low probability of disease and disability, high functioning, and active life engagement. In this cross-sectional study, 320 online dating profiles of older adults were randomly selected and coded based on the criteria. Logistic regression analyses determined whether age, gender, and race/ethnicity predicted self-presentation. Few profiles were indicative of successful aging due to the low prevalence of the first two criteria; the third criterion, however, was identified in many profiles. Native Americans were significantly less likely than other ethnic groups to highlight the first two criteria. Younger age predicted presenting the first criterion. Women’s presentation of the third criterion remained significantly high with age. The findings suggest that the criteria may be unimportant to older adults when seeking partners, or they may reflect the exclusivity of this construct.
During the history of research on multiple maternities, Hellin's law has played a central role as a rule of thumb. It is mathematically simple and approximately correct, but shows discrepancies that are difficult to explain or to eliminate. It has been mathematically proven that Hellin's law does not hold as a general rule. Varying improvements to this law have been proposed. In this paper, we consider how Hellin's law can be used and tested in statistical analyses of the rates of multiple maternities. Such studies can never confirm the law, but only identify errors too large to be characterized as random. It is of particular interest to determine why the rates of higher multiple maternities are sometimes too high or too low when Hellin's law is used as a benchmark. Excesses of triplet and quadruplet maternities are particularly unexpected and challenging. Our analyses of triplet and quadruplet rates indicated that triplet rates are closer to Hellin's law than quadruplet rates. According to our analyses of the twinning rate and the transformed triplet rate and quadruplet rate for Sweden (1751–2000), both triplet and quadruplet rates showed excesses after the 1960s. This is mainly caused by artificial fertility-enhancing reproduction technologies. Regression analyses of twinning and triplet rates yield rather good fits, but deficiencies in the triplet rates are commonly present. We introduced measures of concordance between triplet rates with Hellin's law. According to these measures, historic data showed deficiencies in triplet rates, but recent data revealed excesses, especially found among older mothers. The excesses obtained are in good agreement with other studies of recent data.
Stillbirth rates among single and multiple births show markedly decreasing temporal trends. In addition, several studies have demonstrated that the stillbirth rates are dependent on maternal age, in general, showing a U- or J-shaped association with maternal age. In this study, the temporal trends in and the effect of maternal age on the stillbirth rate were considered simultaneously. Our goal was to split the variation into temporal trends and maternal age effects. We applied two-dimensional analysis of variance because no linear association between maternal age and stillbirth rate can be assumed. The temporal trends of stillbirth rates also were not clearly linear. However, the possibility of applying regression analyses based on linear time trends was also considered. Our study is mainly based on official data from England and Wales for the period between 1927 and 2004. These results were compared with registered birth data from Finland between 1937 and 1997. The best fit was obtained when the models were built for the logarithm of the stillbirth rate. Our interpretation of this result is that an association exists between the effects of the factors and the mean stillbirth rate, and consequently, a multiplicative model was applied. Relatively high stillbirth rates were observed among twin births of young mothers and among all births of older mothers.
In a mature lowland ‘terra firme’ forest near Araracuara in Colombia, a study was conducted to determine the above-ground biomass by means of regression analysis. Dry weight, DBH (i.e. stem diameter at 1.3 m above ground level, or just above buttresses if these surpassed 1.3 m in height), total height and specific wood density were measured on 54 harvested trees, chosen in a ‘selected random’ manner. Nine different regression models were evaluated for statistical correctness, accuracy of the estimates and for practical use. The logarithmically transformed models with DBH2, and DBH2 × height as independent variables appeared to be the only models meeting the above criteria, the latter being the most accurate.
The exclusion of big trees (DBH >45 cm) from the regression did not result in significant changes of the regression coefficients.
The relationship between body fat and stature-adjusted weight indices was explored. Assuming the term height2 is a valid indicator of a subject's lean body mass, height2/weight was shown to be an accurate measure of percentage lean body mass and, as such, a better predictor of percentage body fat than the traditional body mass index (BMI; weight/height2). The name, lean body mass index (LBMI), is proposed for the index height2/weight. These assumptions were confirmed empirically using the results from the Allied Dunbar National Fitness Survey (ADNFS). Using simple allometric modelling, the term heightp explained 74% of the variance in lean body mass compared with less than 40% in body weight. For the majority of ADNFS subjects the fitted exponent from both analyses was approximately p = 2, the only exception being the female subjects aged 55 years and over, where the exponent was found to be significantly less than 2. Using estimates of percentage body fat as the dependent variable, regression analysis was able to confirm that LBMI was empirically, as well as theoretically, superior to the traditional BMI. Finally, when the distributional properties of the two indices were compared, BMI was positively skewed and hence deviated considerably from a normal distribution. In contrast, LBMI was found to be both symmetric and normally distributed. When height and weight are recorded in centimetres and kilograms respectively, the suggested working normal range for LBMI is 300–500 with the median at 400.
Recommend this
Email your librarian or administrator to recommend adding this to your organisation's collection.