


Introduction
Changes in polar environments in the twentieth and twenty-first centuries are associated with global and regional warming trends (Turner et al. Reference Turner, Lachlan-Cope, Colwell and Marshall2005, Siegert et al. Reference Siegert, Atkinson, Banwell, Brandon, Convey and Davies2019). For the Antarctic Peninsula (AP) and the South Shetland Islands, such as King George Island (KGI), there is evidence of an atmospheric temperature increase greater than the global mean since 1850 ce (Siegert et al. Reference Siegert, Atkinson, Banwell, Brandon, Convey and Davies2019), promoting the progressive melting of glaciers (Dziembowski & Bialik Reference Dziembowski and Bialik2022) and changes in mass balance and retreat rates, increases in ice-free areas and vegetation abundance and exposure of subglacial reliefs, among other geomorphological changes (Cuffey & Paterson Reference Cuffey and Paterson2010, Siegert et al. Reference Siegert, Atkinson, Banwell, Brandon, Convey and Davies2019).
Glaciers can serve as important proxies for reconstructing palaeoclimates at different timescales (decades to millennia). Glacier fluctuations help us to understand past, present and future climate changes. Grounding-line positions can be recorded from morainal banks and other glacial landforms (Mackintosh et al. Reference Mackintosh, Anderson and Pierrehumbert2016). Fjords maintain relationships of terrestrial, cryospheric, oceanic and atmospheric dynamics within the Earth system. These dynamical processes occurring in fjords provide important information on how they respond to environmental modifications related to the climate (Bianchi et al. Reference Bianchi, Arndt, Willian, Benn, Bertrand and Cui2020).
Geomorphological mapping of Admiralty Bay (AB) at KGI and its surroundings could improve our understanding of proximal and distal processes at the current glacier margin and provide insightful information on the spatial configuration of glacial flow. Palaeoclimatic studies help to determine the deglaciation processes since the Last Glacial Maximum (LGM) and stillstand of the grounding line related to Neoglacial events (between 3500 and 2600–1600 years bp) and in the Little Ice Age (LIA; 1550–1800 ce). During the LGM on KGI the ice expanded onto adjacent continental shelves. The Early Climate Optimum lasted from 11 100 to 9500 years BP and was characterized by significant retreat across the AB. A prolonged cooling associated with the Neoglacial period (3000–2700 years bp) could have changed the provenance of beach deposits and environmental conditions along Joinville Island, north-eastern AP (Theilen et al. Reference Theilen, Garcia, Dewitt, Zurbuchen and Gernant2023). Simms et al. (Reference Simms, Bentley, Simkins, Zurbuchen, Reynolds and Dewitt2021) proposed the LIA to have significantly impacted the AP between 1550 and 1860 ce, when two major glacial advances occurred.
This work reconstructs changes in the grounding-line position, flow direction and thermal regime of glaciers as recorded by moraine ridges, morainal banks and other glacial landforms in AB throughout the Holocene.
Study area
KGI (Fig. 1) has an ice cap that flows towards the glacimarine (Bremer et al. Reference Bremer, Arigony-Neto and Simões2004). AB, located on the south coast of the KGI, is an elongated fjord with steep walls and a U-shaped valley reaching depths of up to 510 m (Magrani Reference Magrani2014).
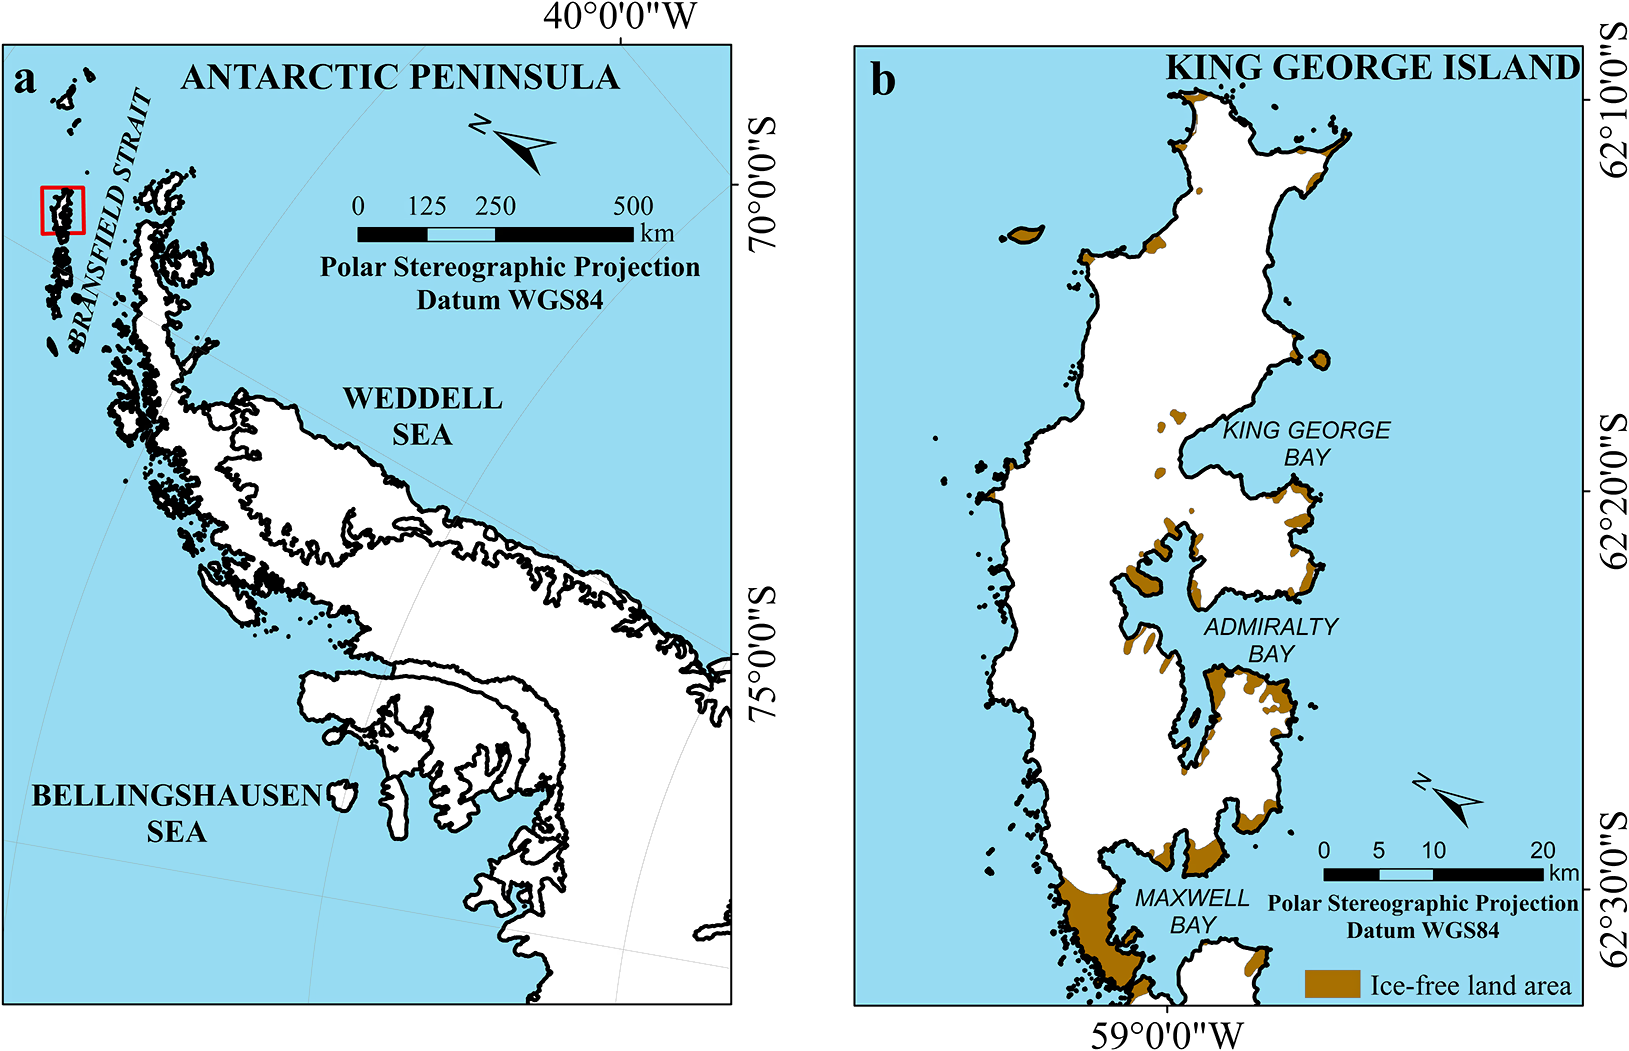
Figure 1. Localization map of Admiralty Bay, King George Island, Antarctica: a. Antarctic Peninsula; b. King George Island. Coastlines by Gerrish et al. (Reference Gerrish, Fretwell and Cooper2022); Antarctic Specially Managed Area (ASMA) limits by Simões et al. (2001).
The mean annual air temperature is −2.8°C. In the winter months, temperatures range from −5.5°C to −1.0°C, and in the summer it ranges from −1.3°C to 2.7°C (Ferron et al. Reference Ferron, Simões, Aquino and Setzer2004). The region’s climate is influenced by cyclones that provide rain, drizzle and snow in the summer months. However, when cyclones form in the Weddell Sea region (Fig. 1a), they bring cold air, snow and a decrease in temperature to the study area (Setzer et al. Reference Setzer, Francelino, Schaffer, Costa, Bremer and Schaefer2004).
Glacial retreat occurring on KGI is associated with atmospheric and ocean warming in recent decades in the AP region (Angiel & Dąbski Reference Angiel and Dąbski2012, Lorenz et al. Reference Lorenz, Rosa, Petsch, Perondi, Idalino and Auger2023). Dobrowolski Glacier (2200 m in length and a maximum height of 525 m) has significantly retreated since 1950. Its area decreased from 8.2 km2 in 1979 to 6.7 km2 in 2021. The glacier’s surface, including its thickness and height, has changed since the LIA (~4400 m in length and a maximum height of 550 m; Perondi et al. Reference Perondi, Rosa, Magrani, Petsch, Vieira, Ayers-Neto and Simões2023).
Materials and methods
Geospatial data
The geomorphological mapping was carried out through in situ fieldwork and interpretation of geospatial data (Table I). The geomorphological mapping of the glacier-free area since the 1950 sector (subaerial) analysis was carried out using the interpretation of the following geospatial data: TanDEM-X, Reference Elevation Model of Antarctica (REMA), SPOT satellite images from 1979, 1988 and 2000, Sentinel-2 (2018 and 2020), WorldView-2 (2014) and PlanetScope (2019).
-
1) TanDEM-X: The objective of TanDEM-X/TerraSAR-X is to generate high-precision three-dimensional images of the Earth; that is, a global digital elevation model (DEM) corresponding to High Resolution Terrain Elevation, level 3 (HRTE-3), covering areas where other satellites have not obtained coherent data, with exact elevation information. The output has a 12 m spatial resolution and a vertical accuracy of less than 2 m.
-
2) REMA: REMA data are available with a spatial resolution of 2 m for almost the entire Antarctic continent. This DEM was created using sub-metre-resolution stereoscopic images obtained by WorldView-1 satellites during the summer between 2015 and 2016. Each DEM was vertically registered according to Cryosat-2 and ICESat satellites, with less than 1 m of absolute uncertainty (Howat et al. Reference Howat, Porter, Smith, Noh and Morin2019).
-
3) Sentinel-2 images (2018 and 2020): Acquired from the United States Geological Survey (USGS) website, with a spatial resolution of 10 m and at processing level 1C.
-
4) WorldView-2 image: Obtained on 6 March 2014, with a spatial resolution of 50 cm, orthorectified and enhanced, covering an area of 60 km2. It was acquired at the end of the 2014 ablation season due to the absence of clouds. The WorldView-2 satellite has a spatial resolution of 50 cm.
-
5) PlanetScope image (2019): The images generated by this constellation of nanosatellites have high spatial resolution and radiometric and geometric corrections, with a daily revisit time. The image used for this work is from 2019, with a resolution of 3 m (Planet Team 2018).
-
6) Geological maps by Birkenmajer (Reference Birkenmajer2003) and the generation of maps of lithological units based on data from Barton (Reference Barton1965), Smellie et al. (Reference Smellie, Pankhurst, Thomson and Davies1984, Reference Smellie, Hunt, Mcintosh and Esser2021) Storey (Reference Storey1992) and Troedson & Smellie (Reference Troedson and Smellie2002) and on Polar Rock Repository data from Matsuoka et al. (Reference Matsuoka, Skoglund, Roth, Pomereu, Griffiths and Headland2021).
-
7) Geomorphometric products: Based on the generated DEM, hypsometric, slope and aspect maps were prepared (spatial resolutions of 4 and 10 m), as well as analytical hillshade models and three-dimensional perspective scenes.
Table I. Geospatial data used for the integrated geomorphological mapping of the study area. The use of data from different years and scales is due to data scarcity for Antarctica.
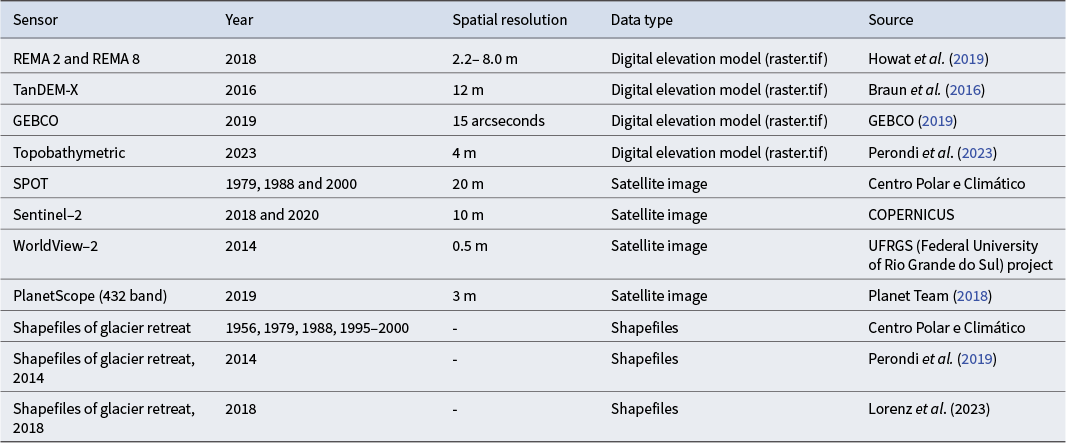
GEBCO = General Bathymetric Chart of the Oceans; REMA = Reference Elevation Model of Antarctica.
For the geomorphological mapping of the submarine environment, the following geospatial data were used: bathymetry of AB, REMA (described earlier) and the General Bathymetric Chart of the Oceans (GEBCO, 2019), along with shapefiles of frontal glacier retreat since 1956 and geomorphometric products.
-
1) Bathymetry of AB: Acoustic and bathymetric multi-resolution data were collected during three Brazilian Antarctic expeditions (OPERANTAR): OPERANTAR XXVIII (2009/2010), OPERANTAR XXXI (2012/2013) and OPERANTAR XXXII (2013/2014) aboard the Polar Ship Admiral Maximiano (H41), with the support of the Brazilian Navy, using Edgetech 512i sub-bottom and Kongsberg SBP 300 seismic profilers and a Simrad EM 302 multibeam echo-sounder (30 kHz frequency). The Kongsberg SBP 300 sub-bottom profiler was operated with a ping rate of 1000 ms, 2 ms pulses and a frequency envelope from 2.5 to 6.5 kHz. Magrani (Reference Magrani2014) shows the track map with the locations of the profiler lines of the Kongsberg SBP 300 sub-bottom profiler and Edgetech 3200 surveys. The Simrad EM 302 multibeam echo-sounder aboard the SKUA boat from the Brazilian Antarctic Station Commander Ferraz was used for covering the shallower depths (including below 200 m deep) in five non-uniform spacing and parallel transects along the fjord (Perondi et al. Reference Perondi, Rosa, Vieira, Magrani, Ayers-Neto and Simões2022). The bathymetric model was generated using inverse distance weighting and based on the methodology of Ajvazi & Czimber (Reference Ajvazi and Czimber2019).
-
2) GEBCO: This project aims to create a comprehensive set of nautical charts covering all seas and oceans by combining bathymetry data (GEBCO 2019). The 2019 data grid provides higher-resolution bathymetric data compared to the products from 2014. The Global Digital Elevation Model 2019 consists of a global data grid at a 15 arc-second interval, using SRTM15+ as the base version (GEBCO 2019).
Identification of the glacial landforms and geochronology
Geospatial data were integrated into a Geographic Information System (GIS) using ArcGIS software to identify erosional and depositional glacial landforms. The identification of landforms was based on identification criteria proposed by Bennett & Glasser (Reference Bennett and Glasser1996), Ottesen & Dowdeswell (Reference Ottesen and Dowdeswell2006), Benn & Evans (Reference Benn and Evans2010), Streuff et al. (Reference Streuff, Forwick, Szczucinski, Andreassen and Ó Cofaigh2015) and Wölfl et al. (Reference Wölfl, Wittenberg, Feldens, Hass, Betzler and Kuhn2016), which included characterizing the morphology, morphometric characteristics, depositional environment, sedimentology, genesis and the context of the glacier (parallel or perpendicular to the flow of ice). Geomorphometric data such as slope, hypsometry, shading relief and topographic profile data were used to interpret the morphology of the landforms.
For the geochronology of the environments in the study area, existing dating, changes in geomorphological and topographical aspects of the terrain and the distance from the current glacier fronts were used to infer the temporal sequence of their exposure. For the ordering of the legend, a database was created and inserted into a GIS that temporally detailed the formation and exposure of AB since the LGM, with an emphasis on the Holocene.
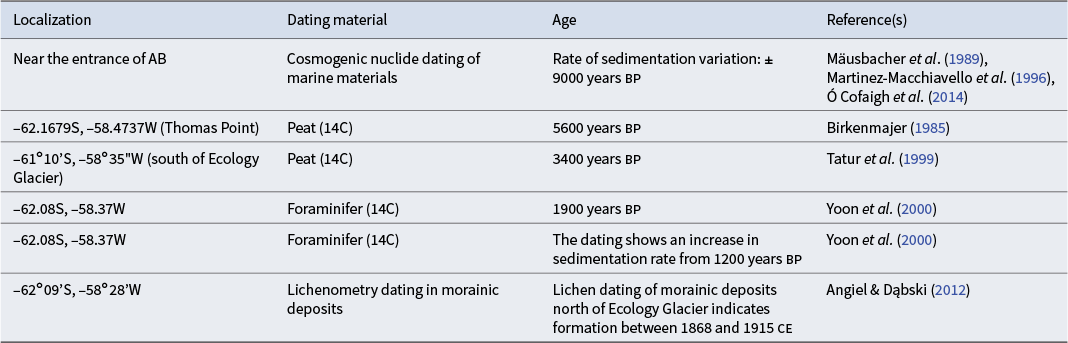
The geochronology of recent subaerial and submarine landforms (after 1956) was inferred based on historical data of the fluctuations of the glacier margins. For environments and features formed in periods before 1956, pre-existing dating data (Fig. 2 & Table II) and bathymetry data were used.
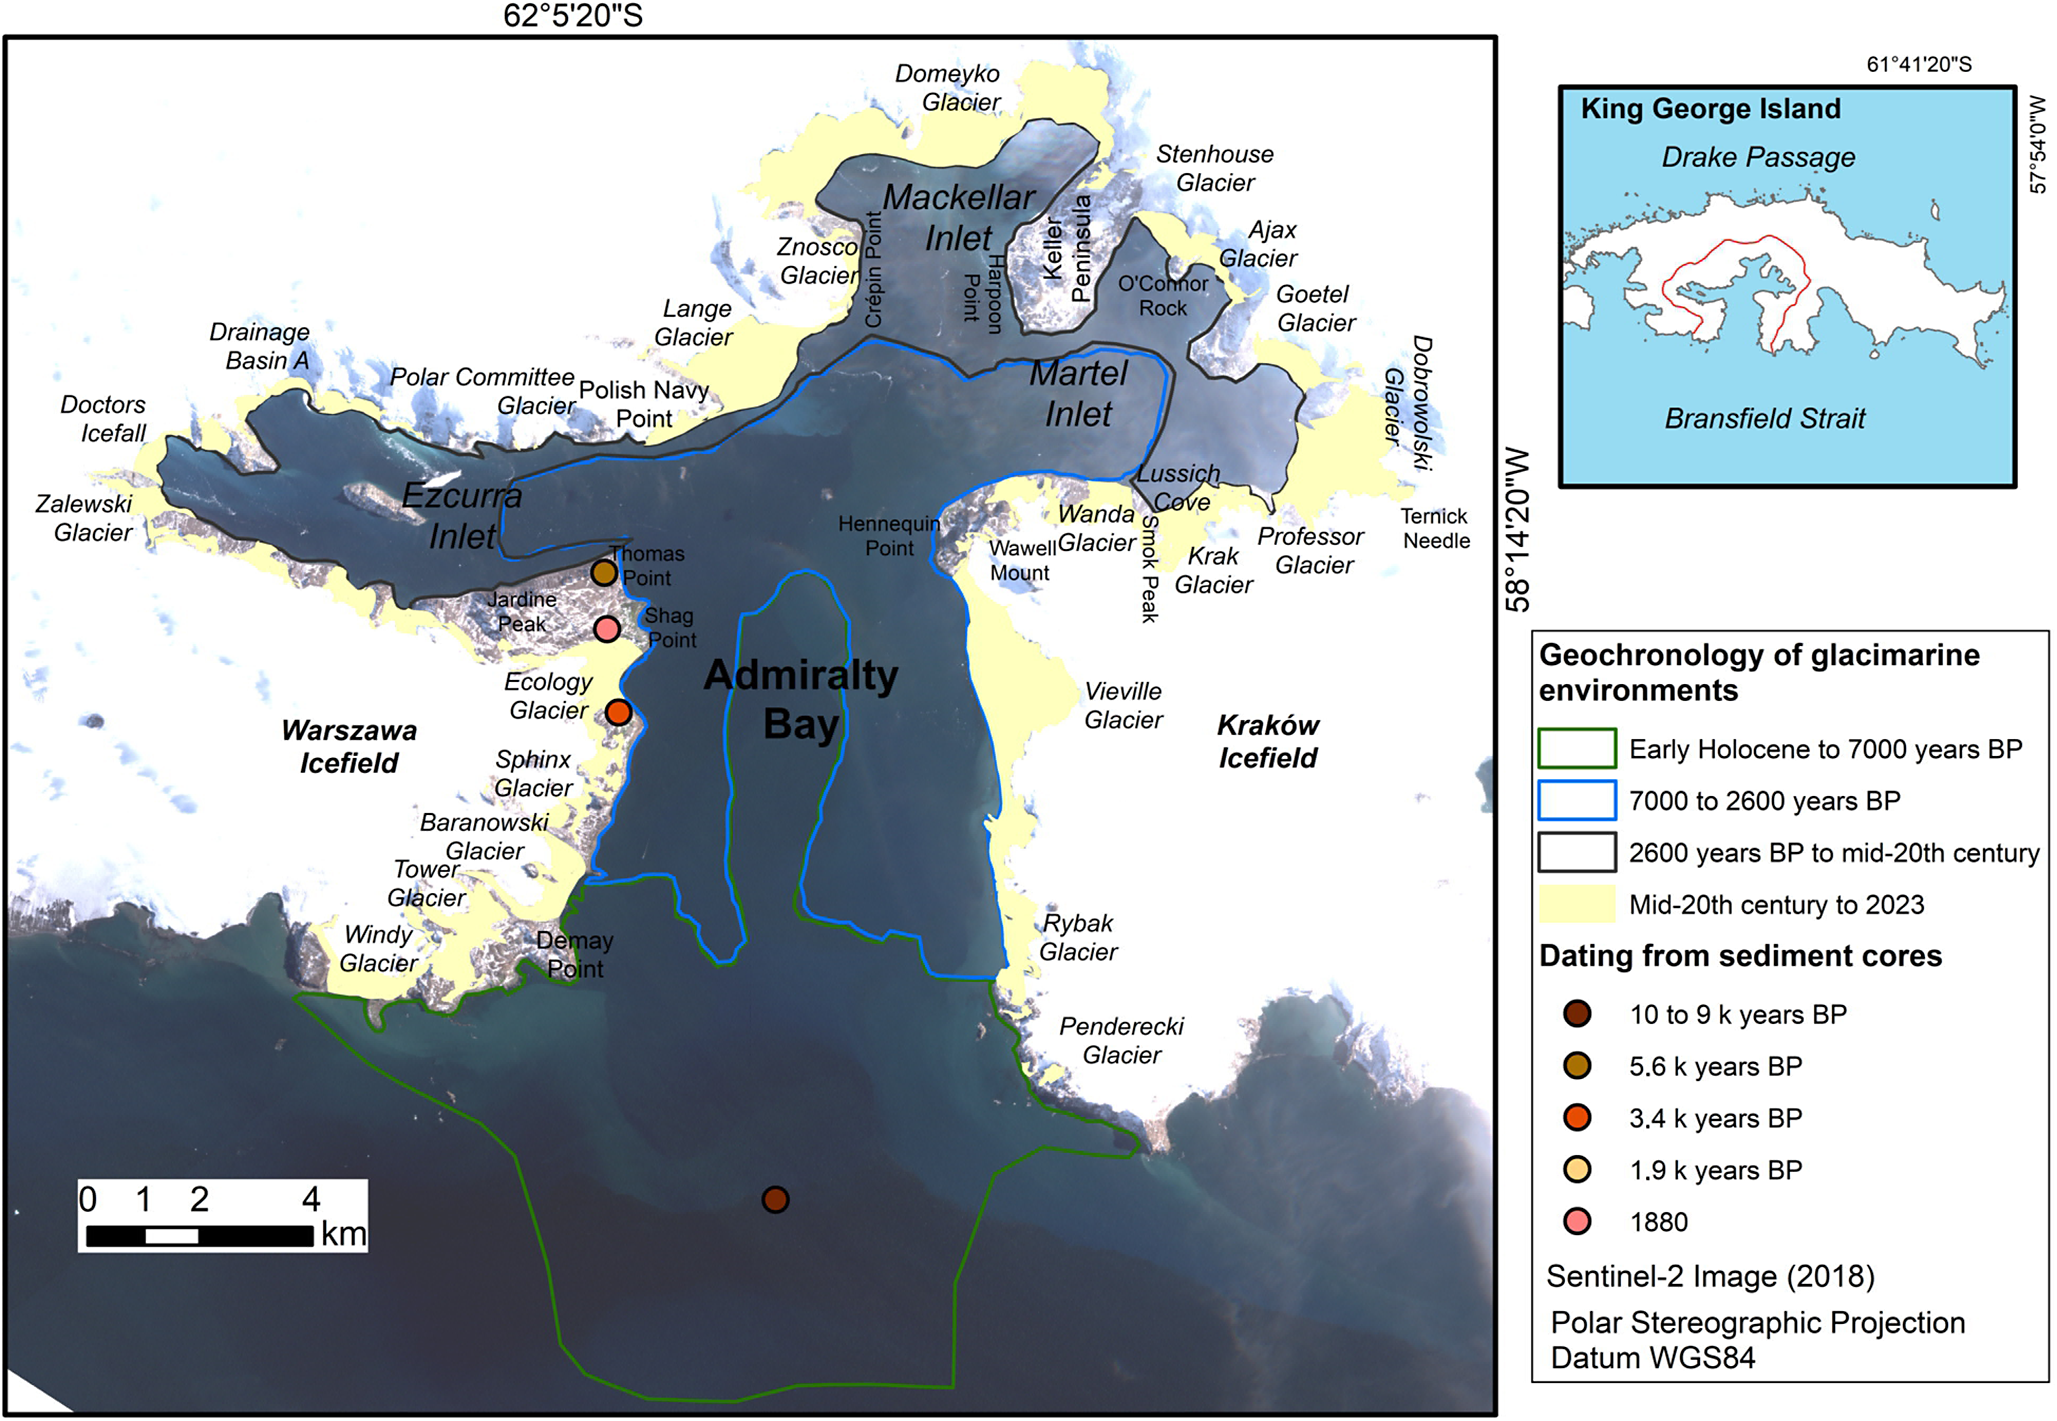
Figure 2. Geochronology of glacimarine environments and dating in the study area.
Table II. Dating for Admiralty Bay (AB).
Results
The inner region (Fig. 3) of AB has a maximum depth of 210 m. The middle region has a maximum depth of 518.6 m and a minimum depth of 508 m. The outer region has a maximum depth of 662 m. The outer region has an average terrain slope of 10.9°, the middle region has an average terrain slope of 12.9° and the inner region has an average terrain slope of 8.9° (Fig. 3b). The highest slopes are observed between 1.0 and 1.5 km from the coast in the outer and middle regions. In the adjacent subaerial areas, the steepest sectors are associated with ice contact, such as Krak, Dragon, Dobrowolski, Stenhouse, Ajax, Goetel and Domeyko (Fig. 2) glaciers, which are located on the north coast of the fjord. There are also glacier-free areas with high slopes near the fjord end (eastern coast of AB) and along the Hennequin Point and Keller Peninsula coasts (Figs 2 & 3b).
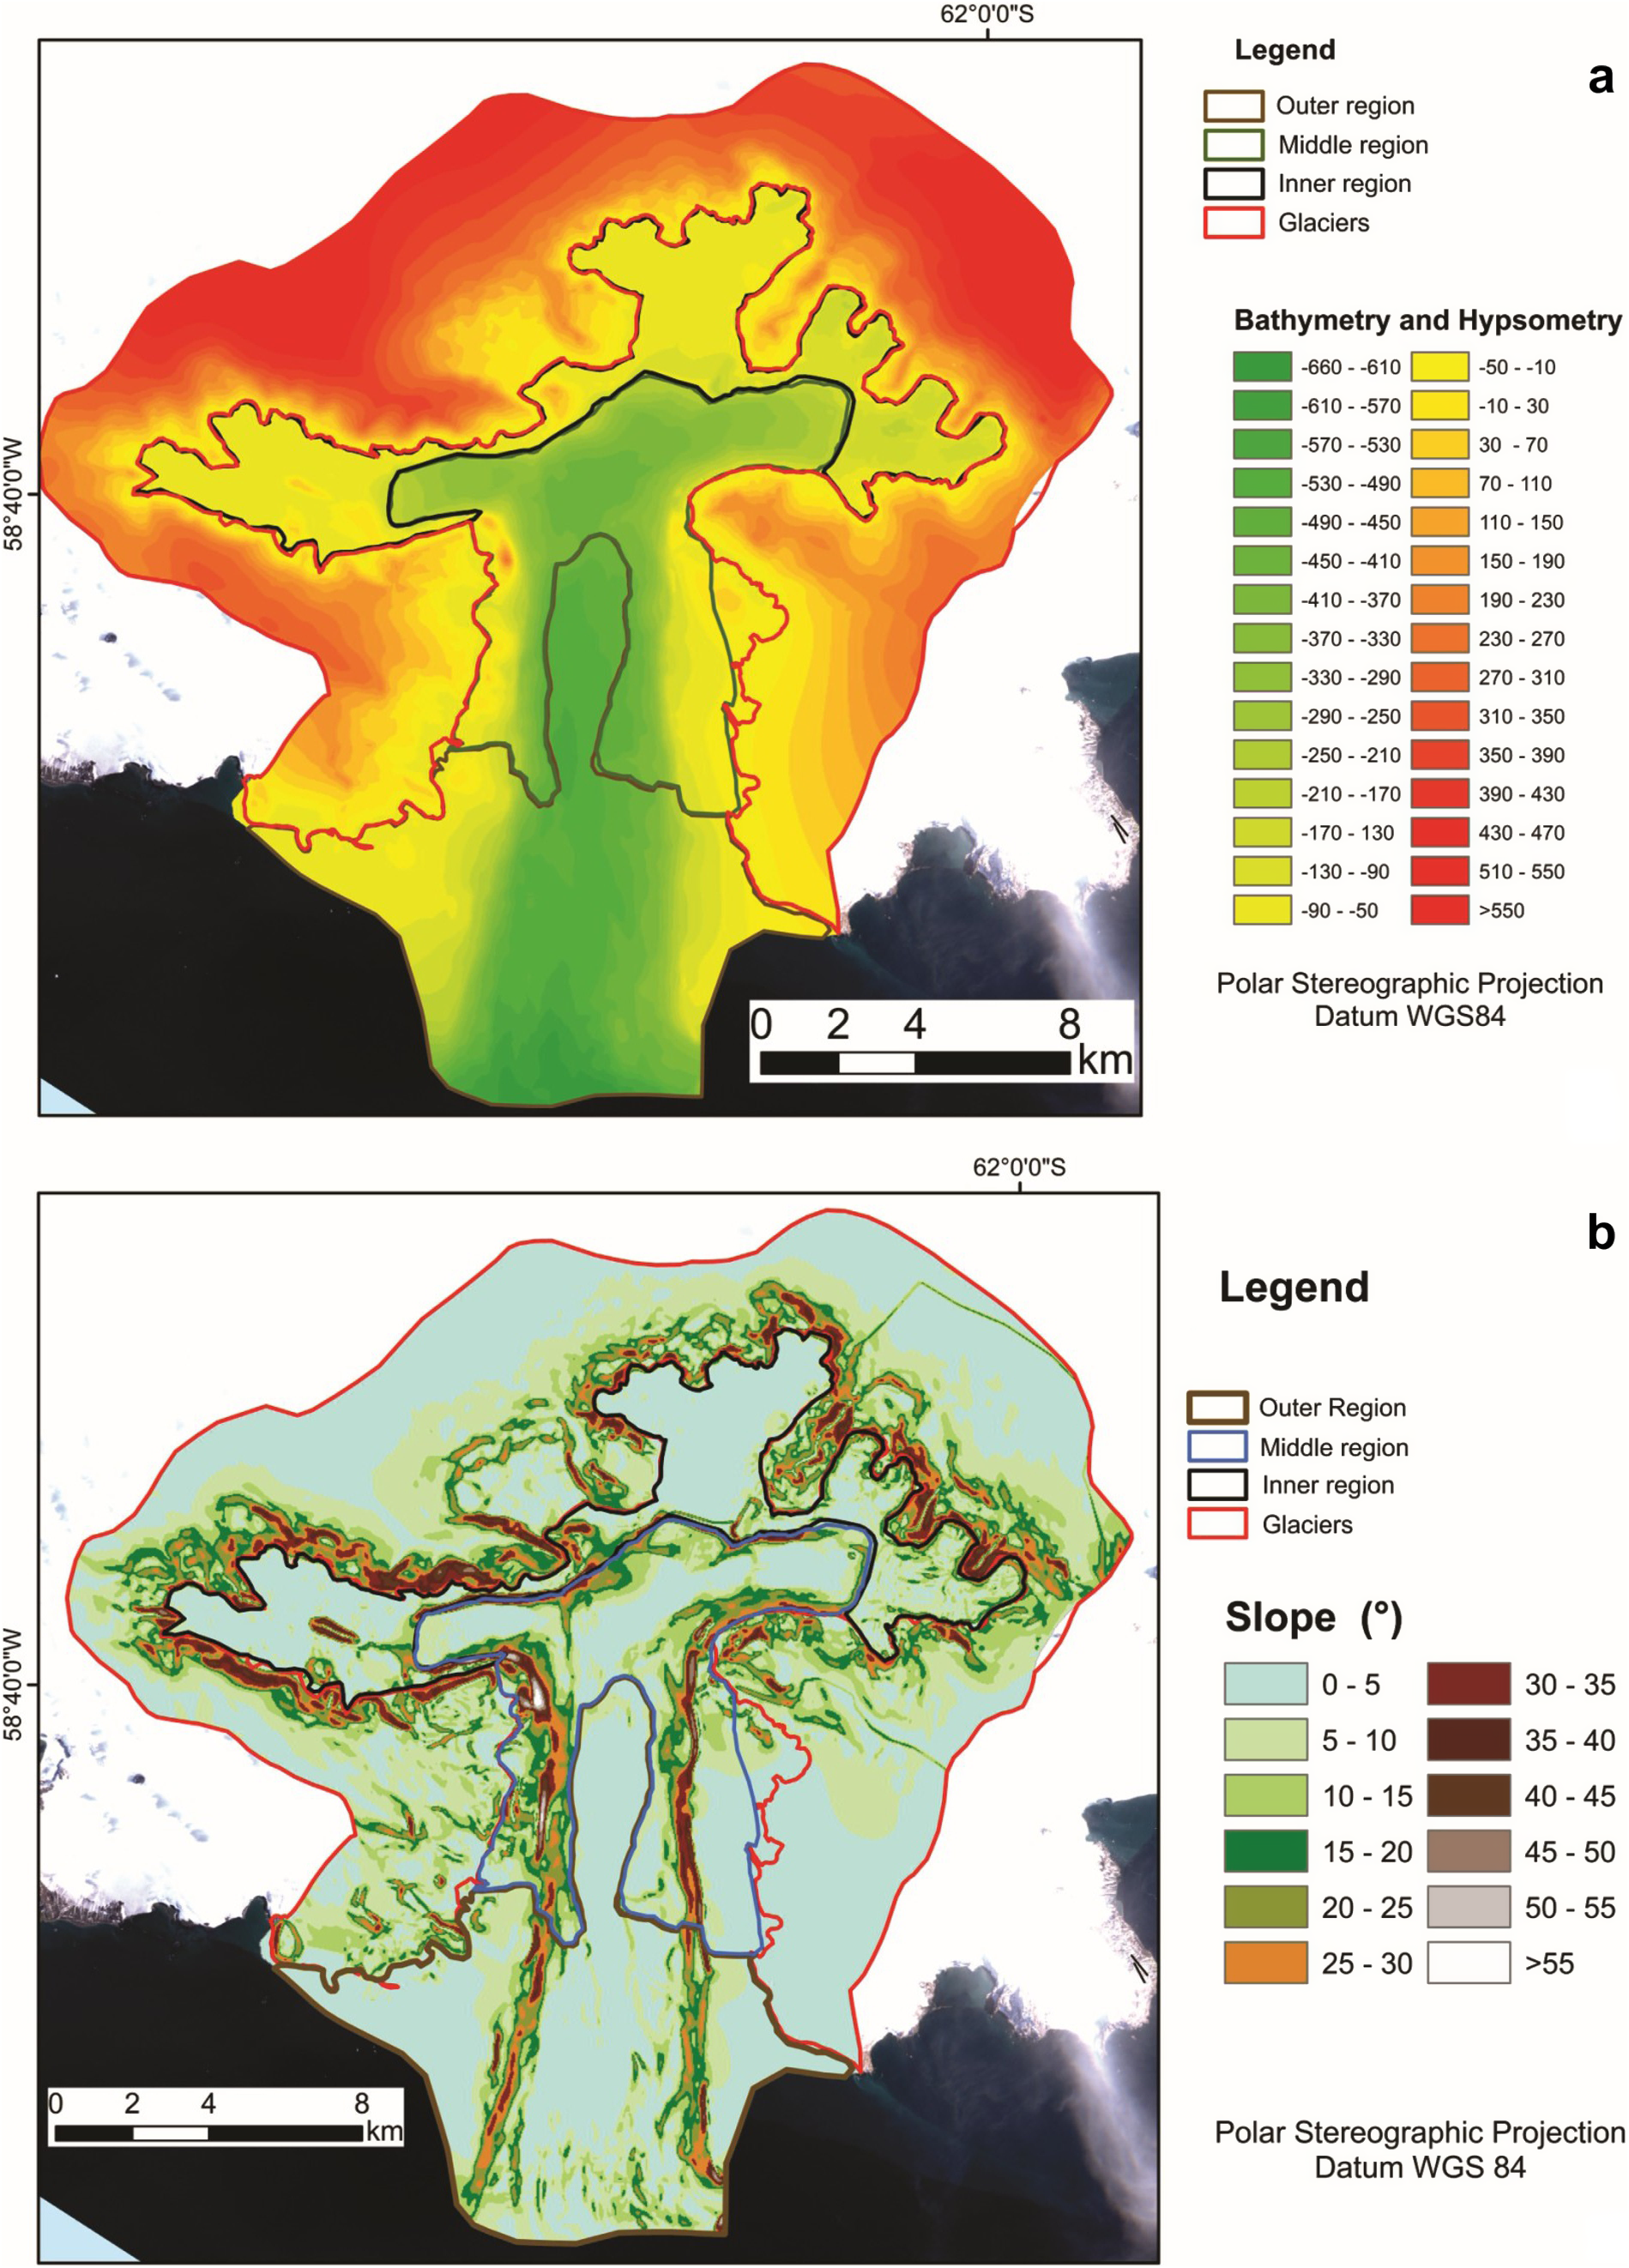
Figure 3. a. Hypsometric map of the study area and geochronology of the fjord environment by sector. b. Slope map of the study area and geochronology of the fjord environment by sector.
AB is characterized by significant roughness. The outer region has a relatively smoothed valley floor compared to the sector at the head of the fjord. Well-preserved depositional landforms are observed in the fjord and are related to morainal banks, eskers and glacial lineations. Mesoscale erosional features in the fjord, such as gullies, were identified mainly on the steeper slopes of the fjord, such as at Martel Inlet.
Glacier erosion sculpted the valleys (U-shaped and cirque) along the plateau’s escarpments and depressions. Glacial erosion landforms in glacier-free areas show horns, nunataks and arêtes (Figs 4 & 5) and striated pavements observed at Martel Inlet (Fig. 4d).
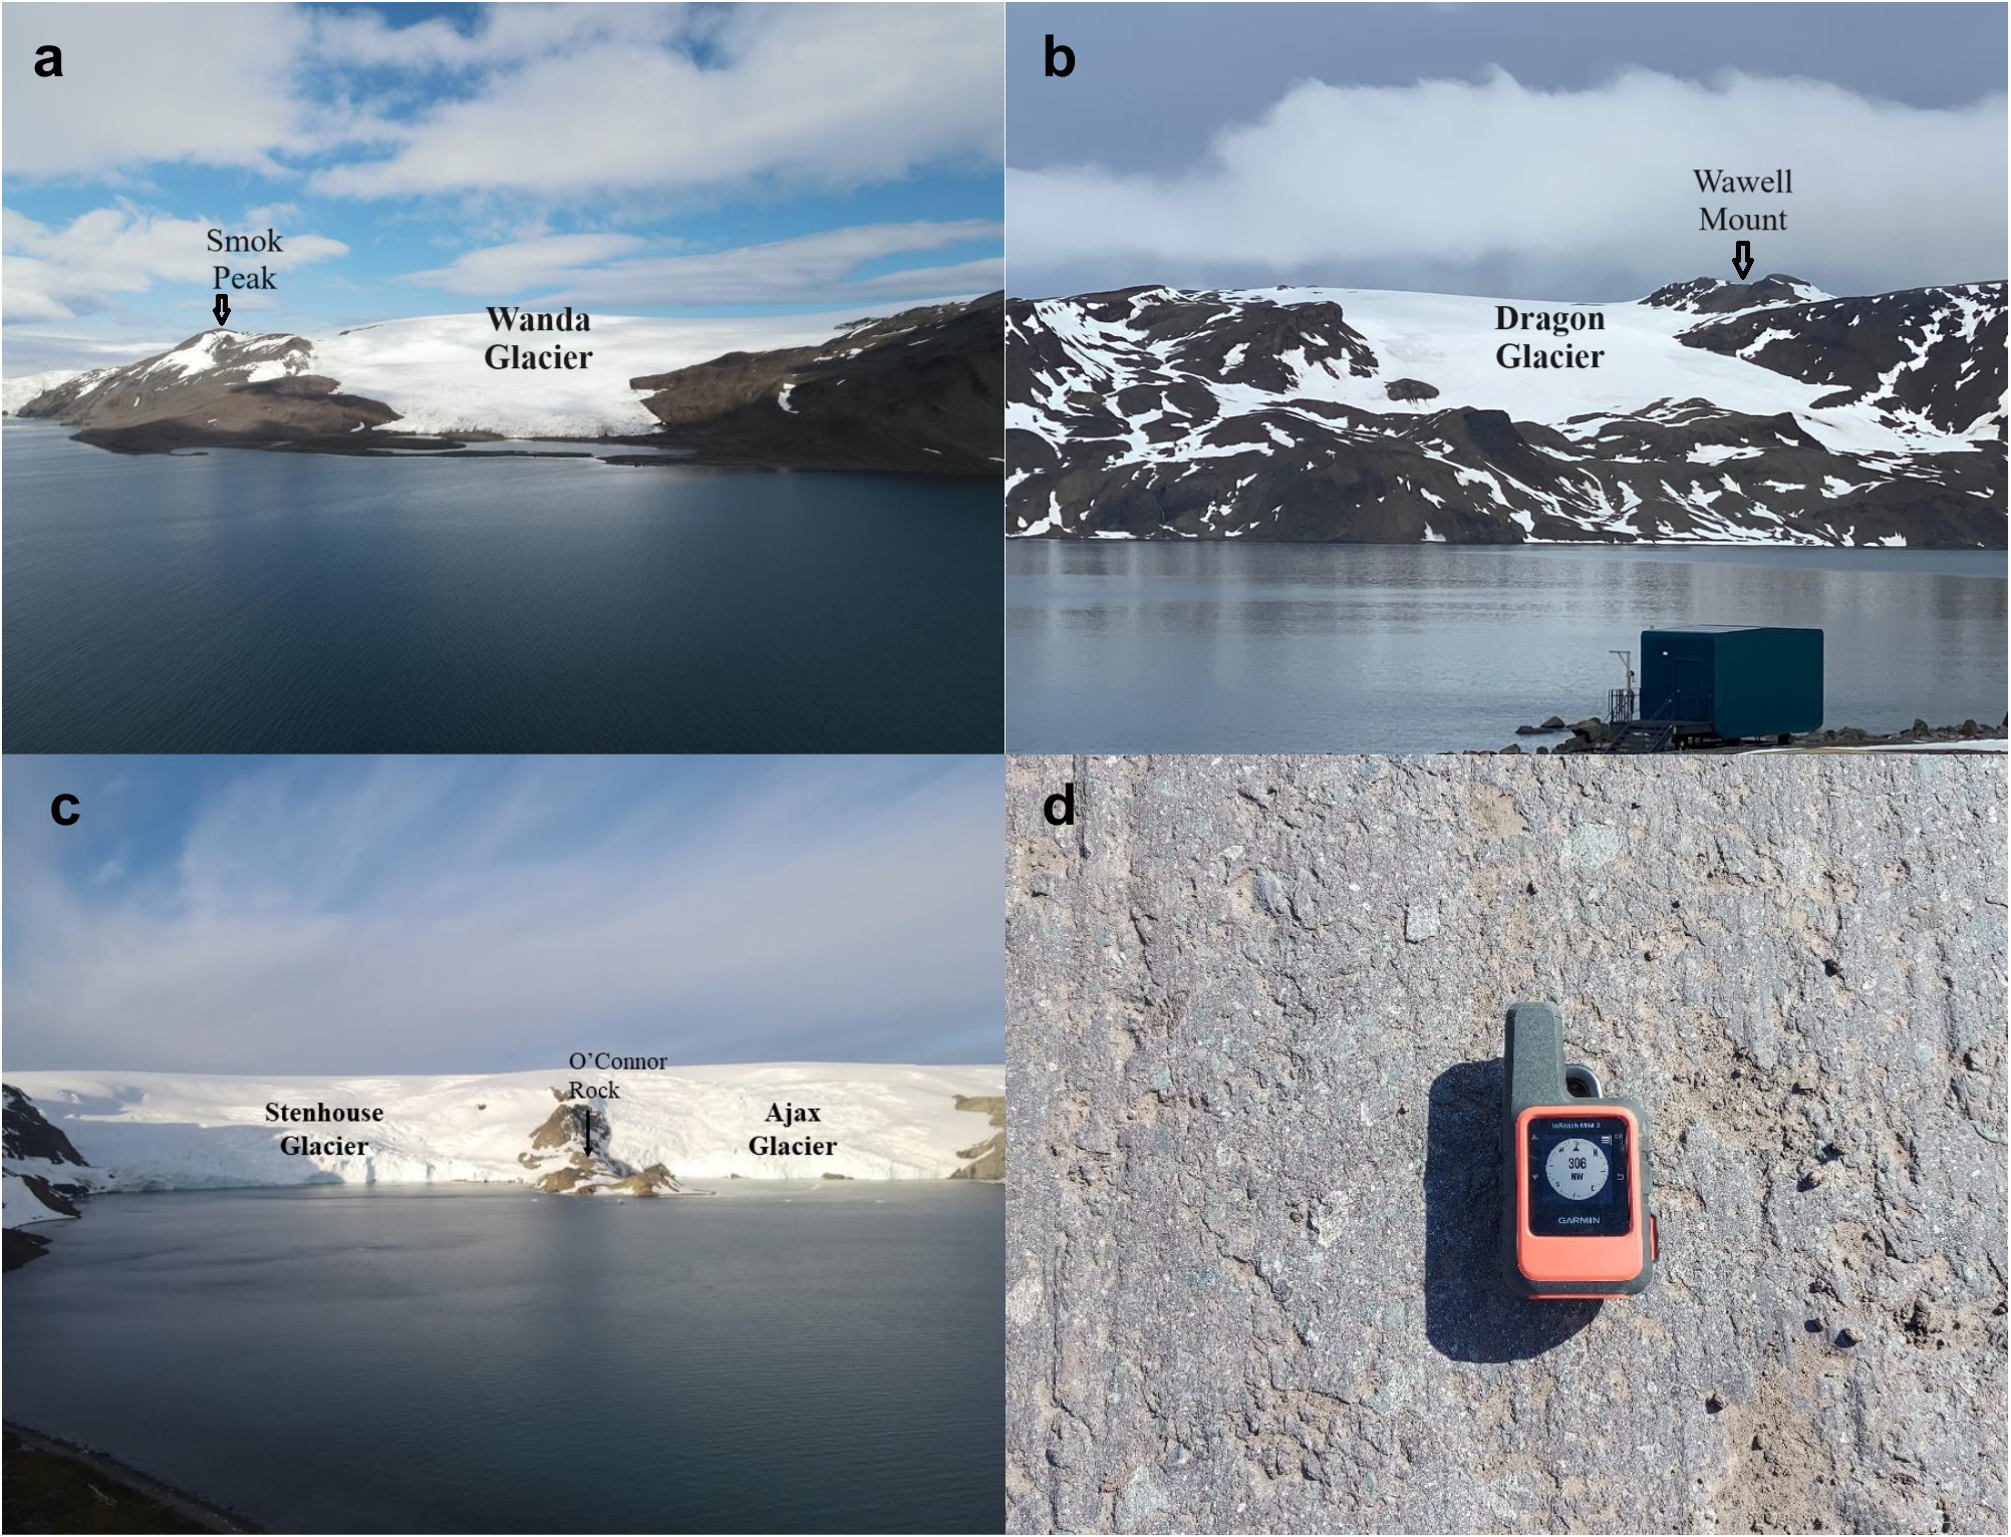
Figure 4. a. Smok Peak. b. Wawell Mount. c. O’Connor Rock. Photographs a.–c. taken by Santos Nascimento (2021). d. Striated pavement. Photograph taken by Luiz Felipe Velho and Carina Petsch (2023).
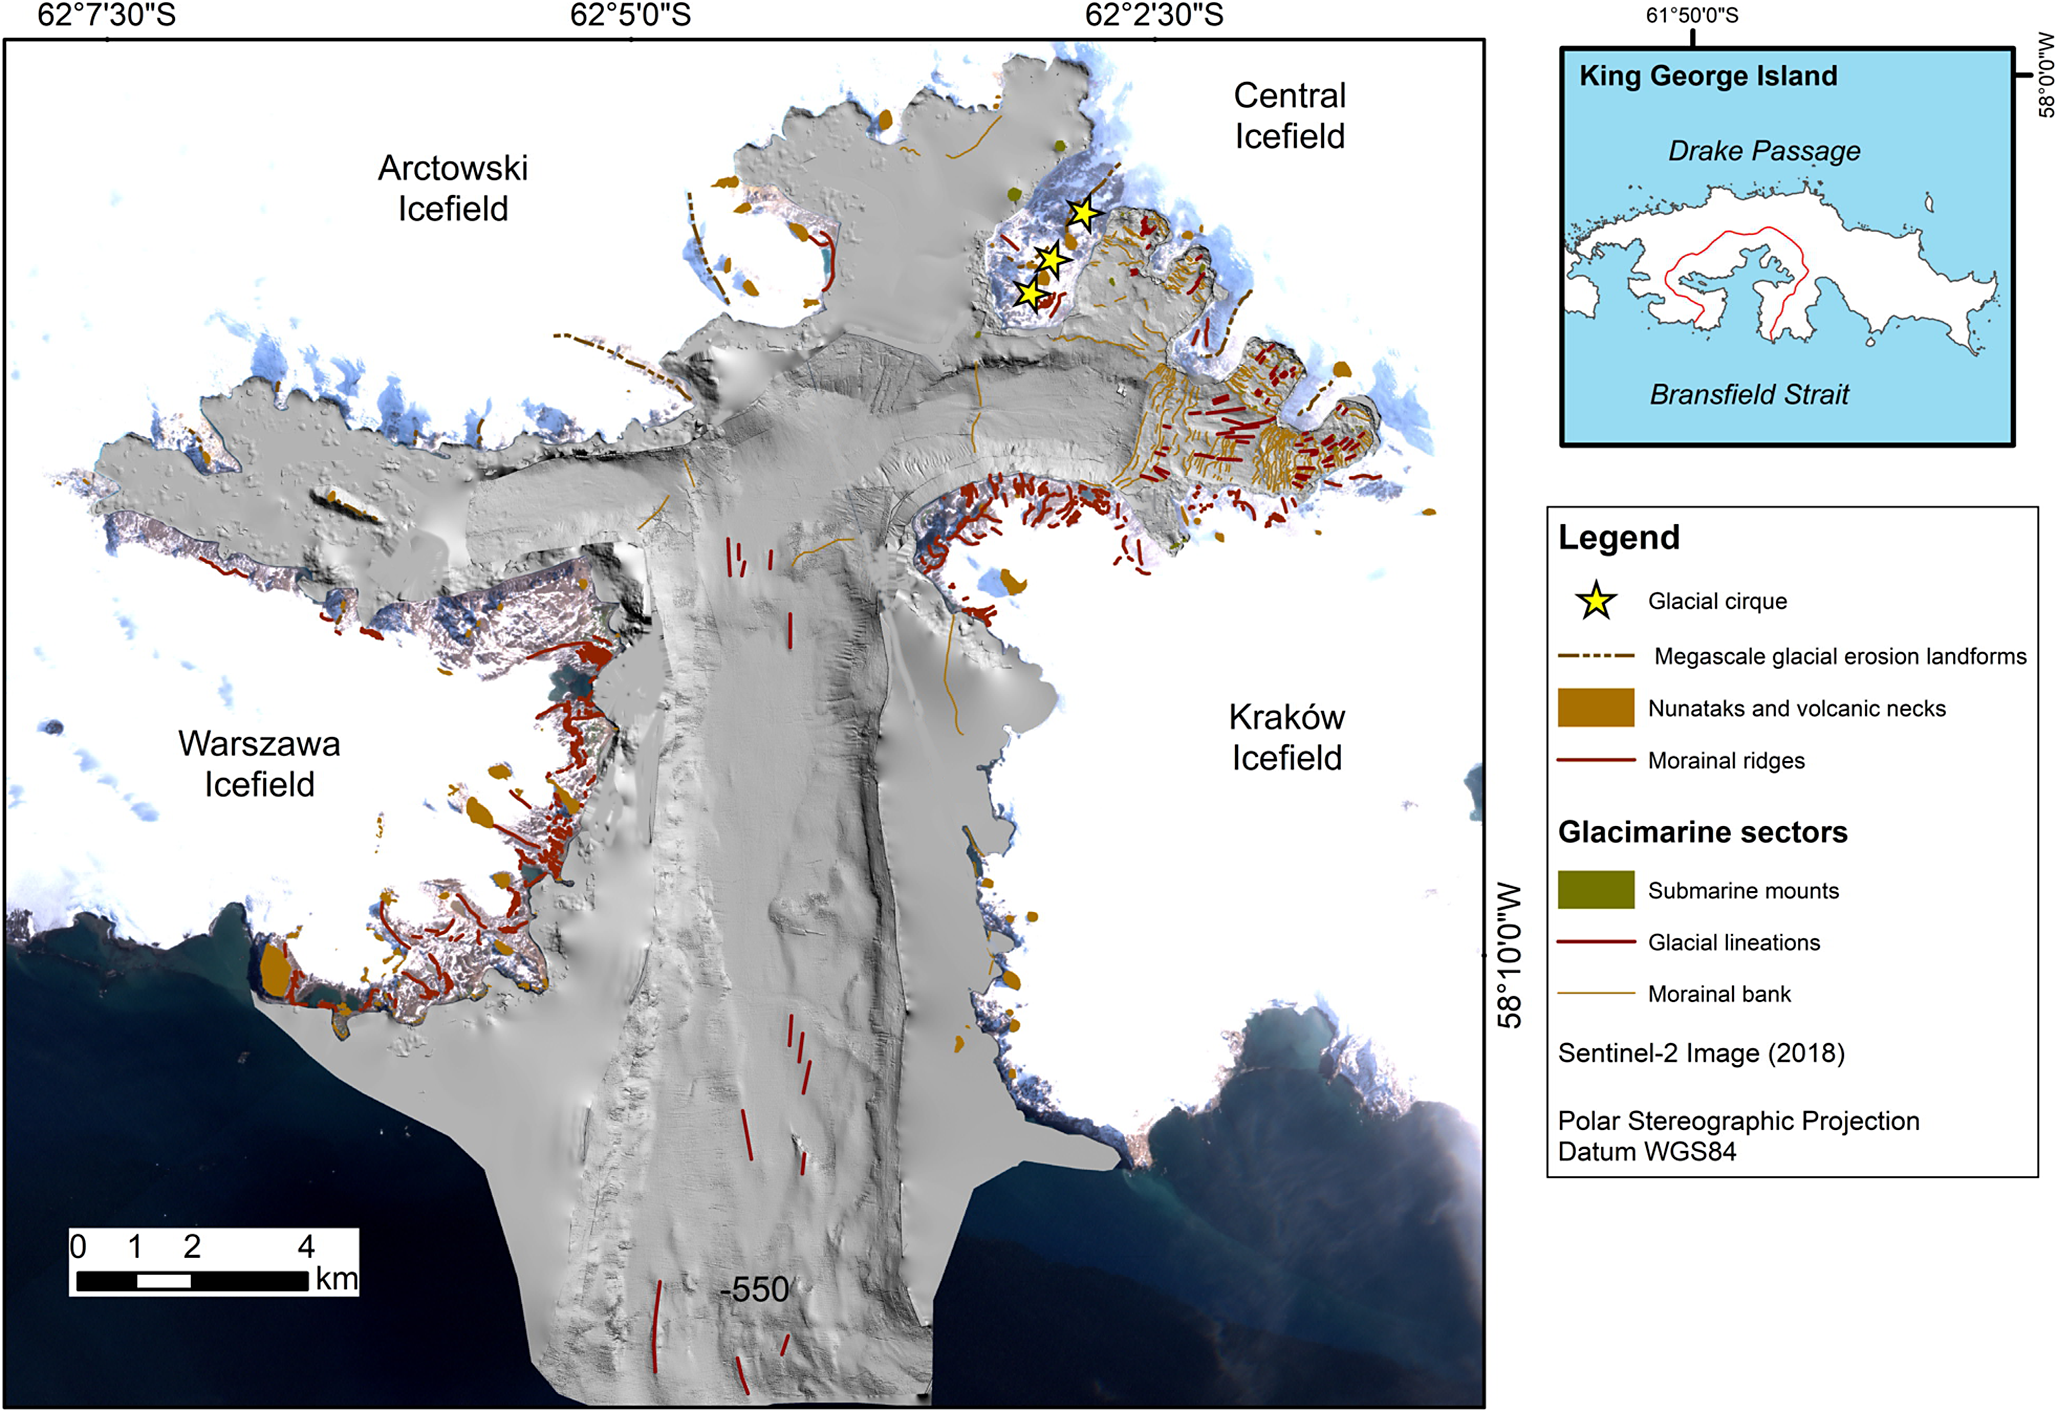
Figure 5. Geomorphological map of glacial landforms.
The longitudinally aligned corrugations are most confidently interpreted as mega-scale glacial lineations. They have an north to south orientation in the outer sector. In the inner sector of Martel Inlet, these landforms have a north-east to south-west orientation (near Dobrowolski Glacier; Fig. 5). At Martel Inlet, the mega-scale glacial lineations are aligned north to south and north-north-east to south-south-west near the ice margin of the inner sector, and they change to a north-east to south-west orientation in the deep zones of the inner sector.
The morainal banks are transverse to the glacial palaeoflow of AB. Across AB, 289 morainal banks were identified. The three morainal banks, MB9 (Fig. 5 & 6), MB10 and MB7, are prominent and are located in the middle sector (Figs 5, 7 & 8). A seismic record shows a morainal bank (MB9) of ~100 m height from its seafloor base, at a depth 250 m at Ezcurra Inlet (Fig. 6).
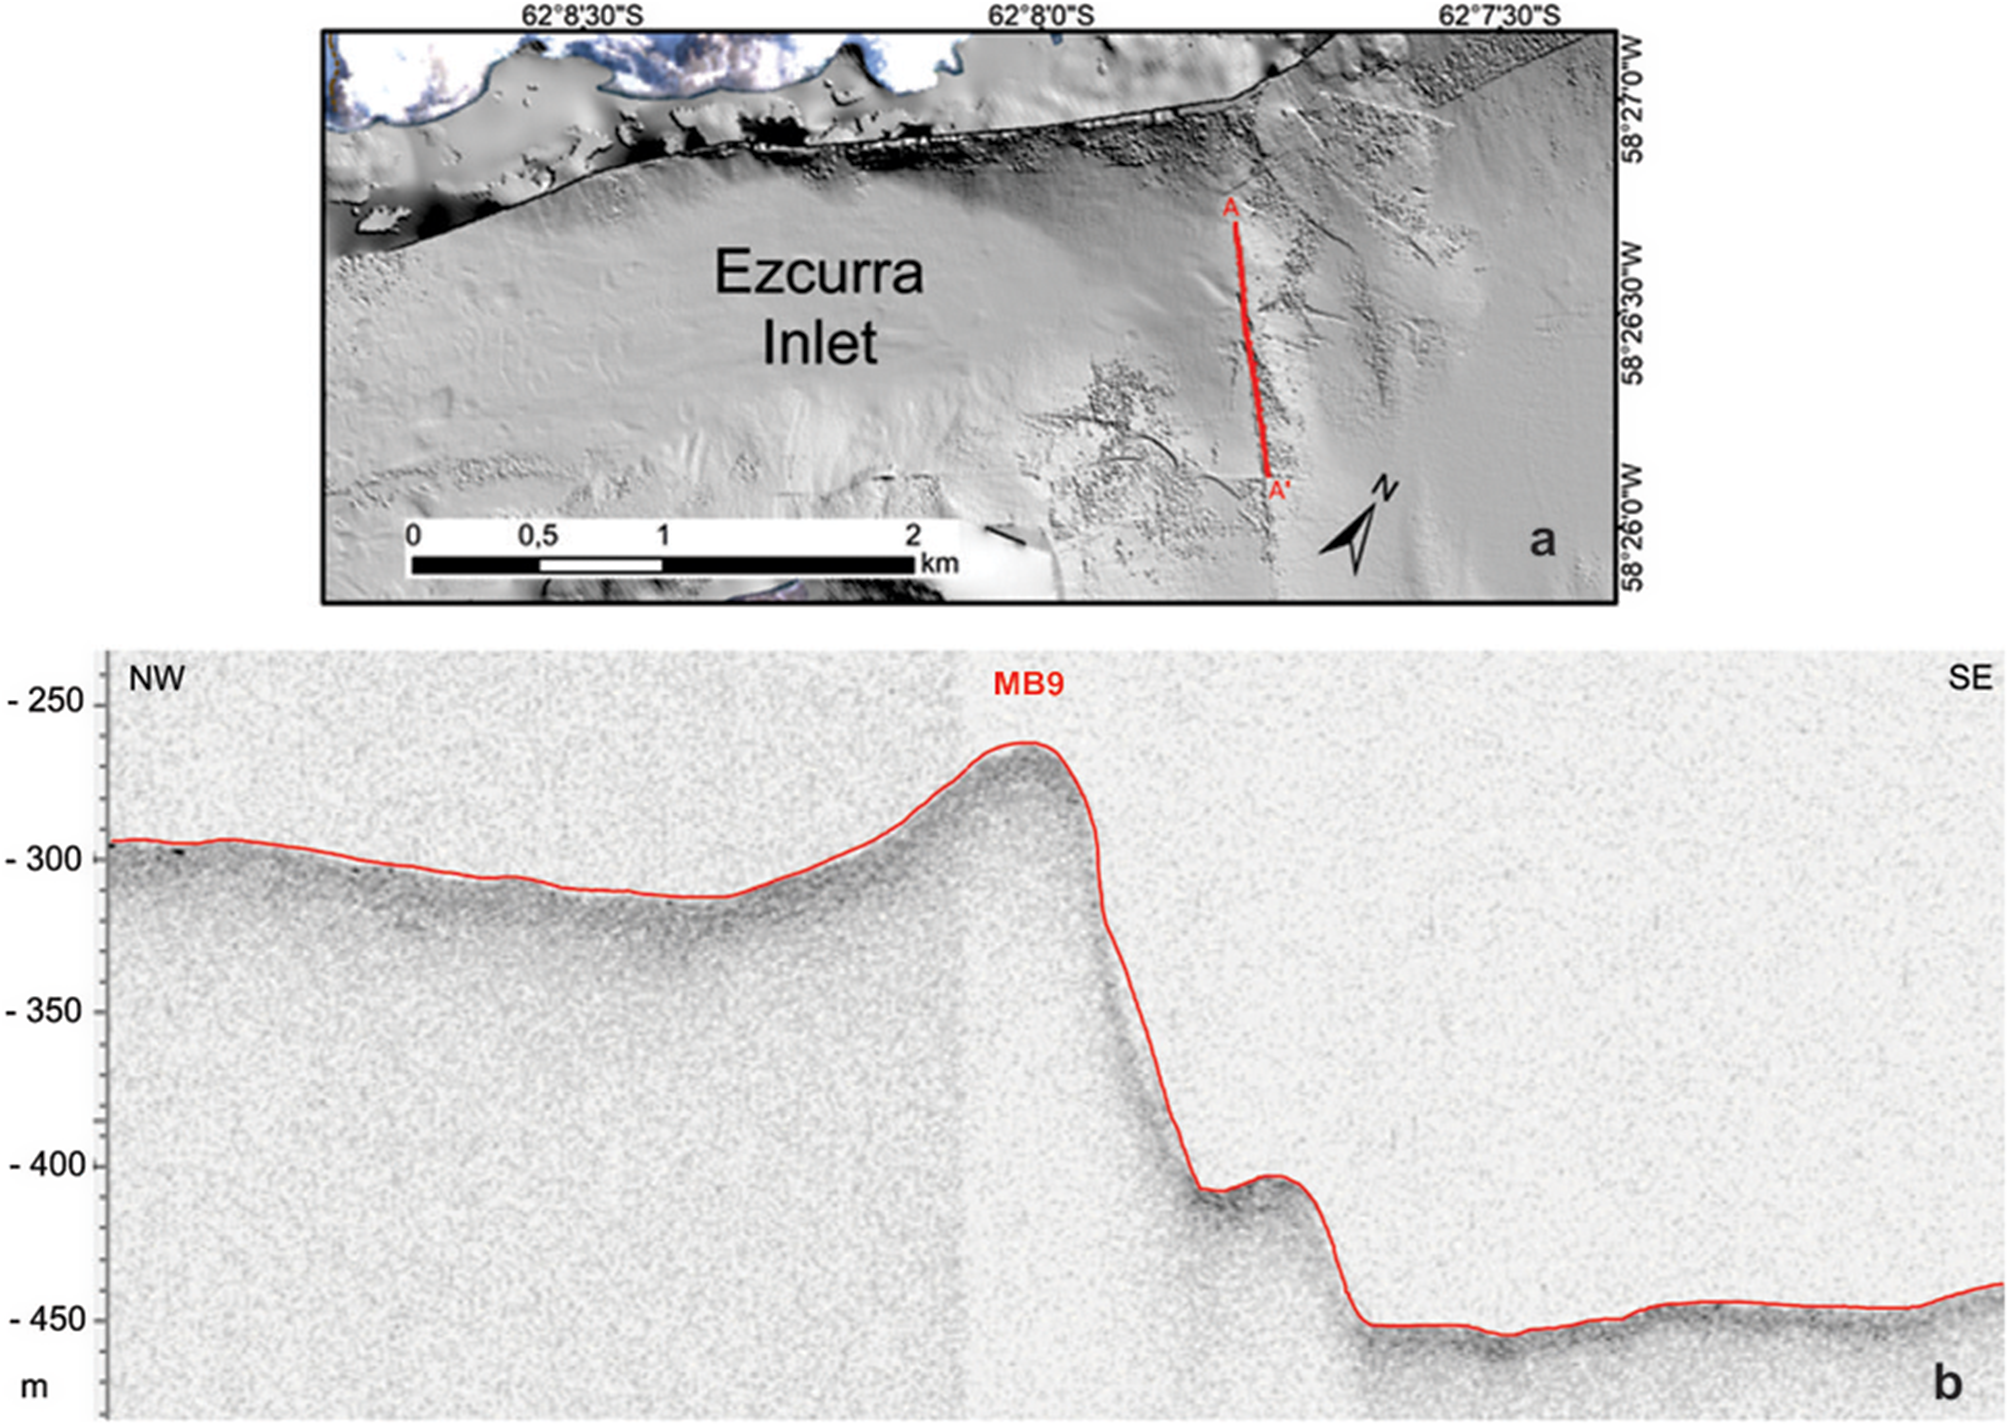
Figure 6. Morainal bank. a. Transect of the hill-shaded map. b. Seismic profile of morainal bank MB9 located at 250 m depth between Shag Rock Point and the south of Icefall Committee Glacier.
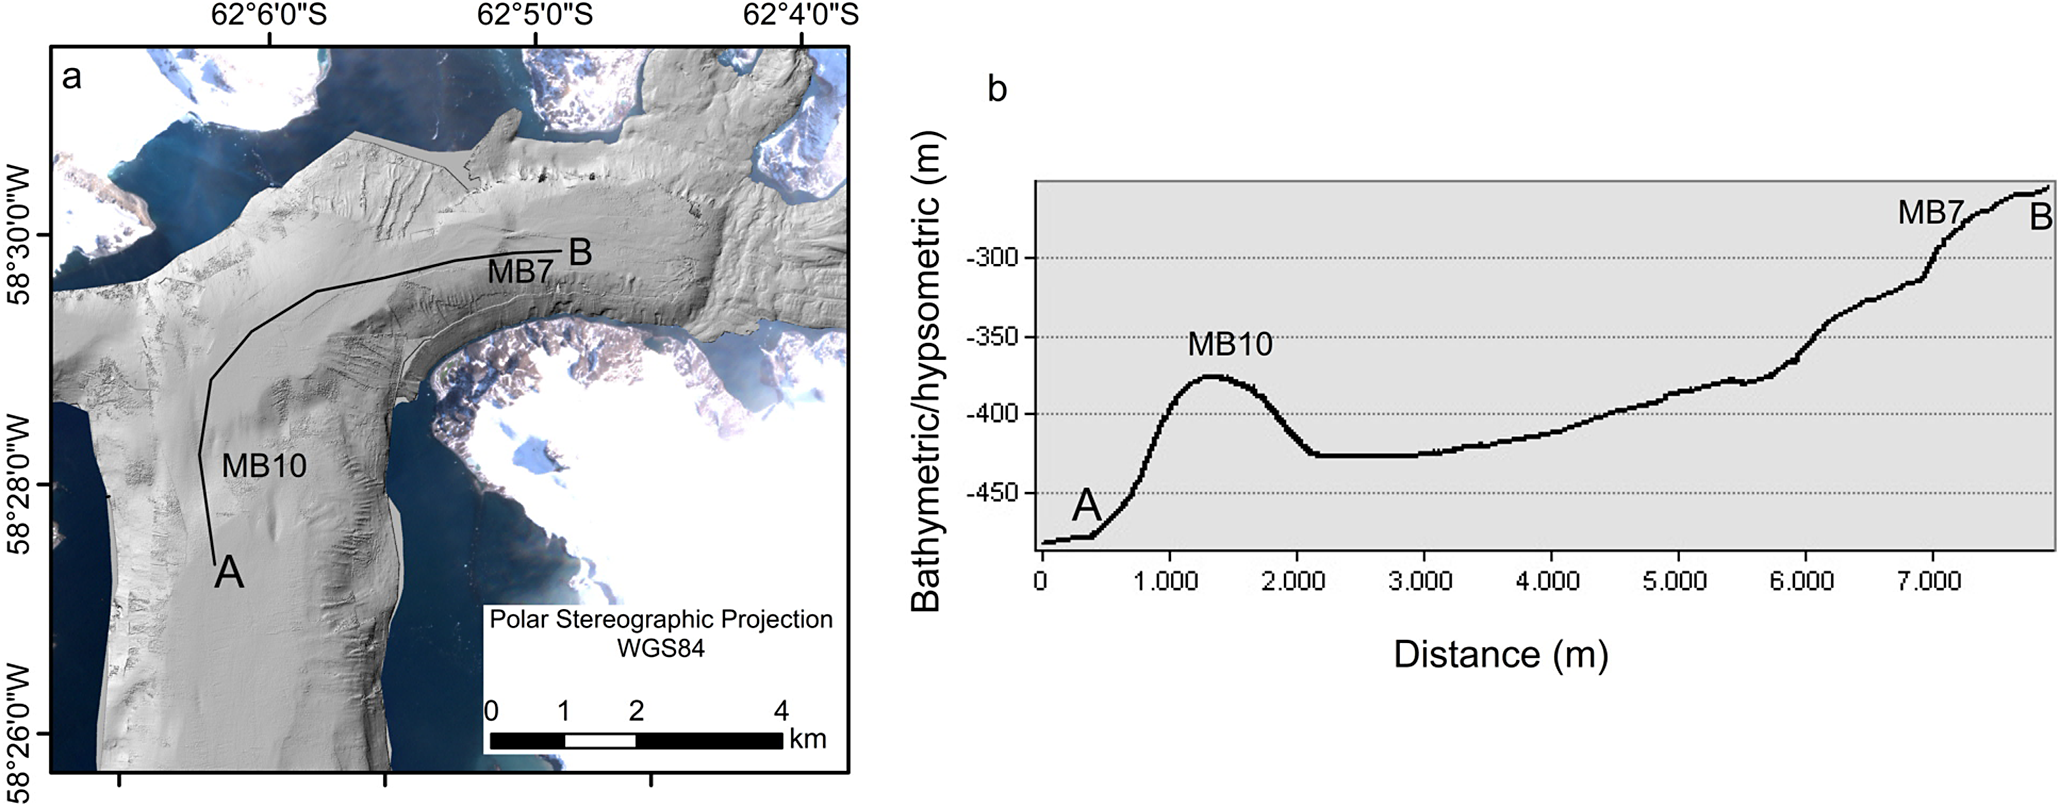
Figure 7. a. Transect of the hill-shaded map. b. Topographic profile of Admiralty Bay illustrating MB10 and MB7 in the fjord. Letter A indicates the start of the profile and B indicates the end of it.
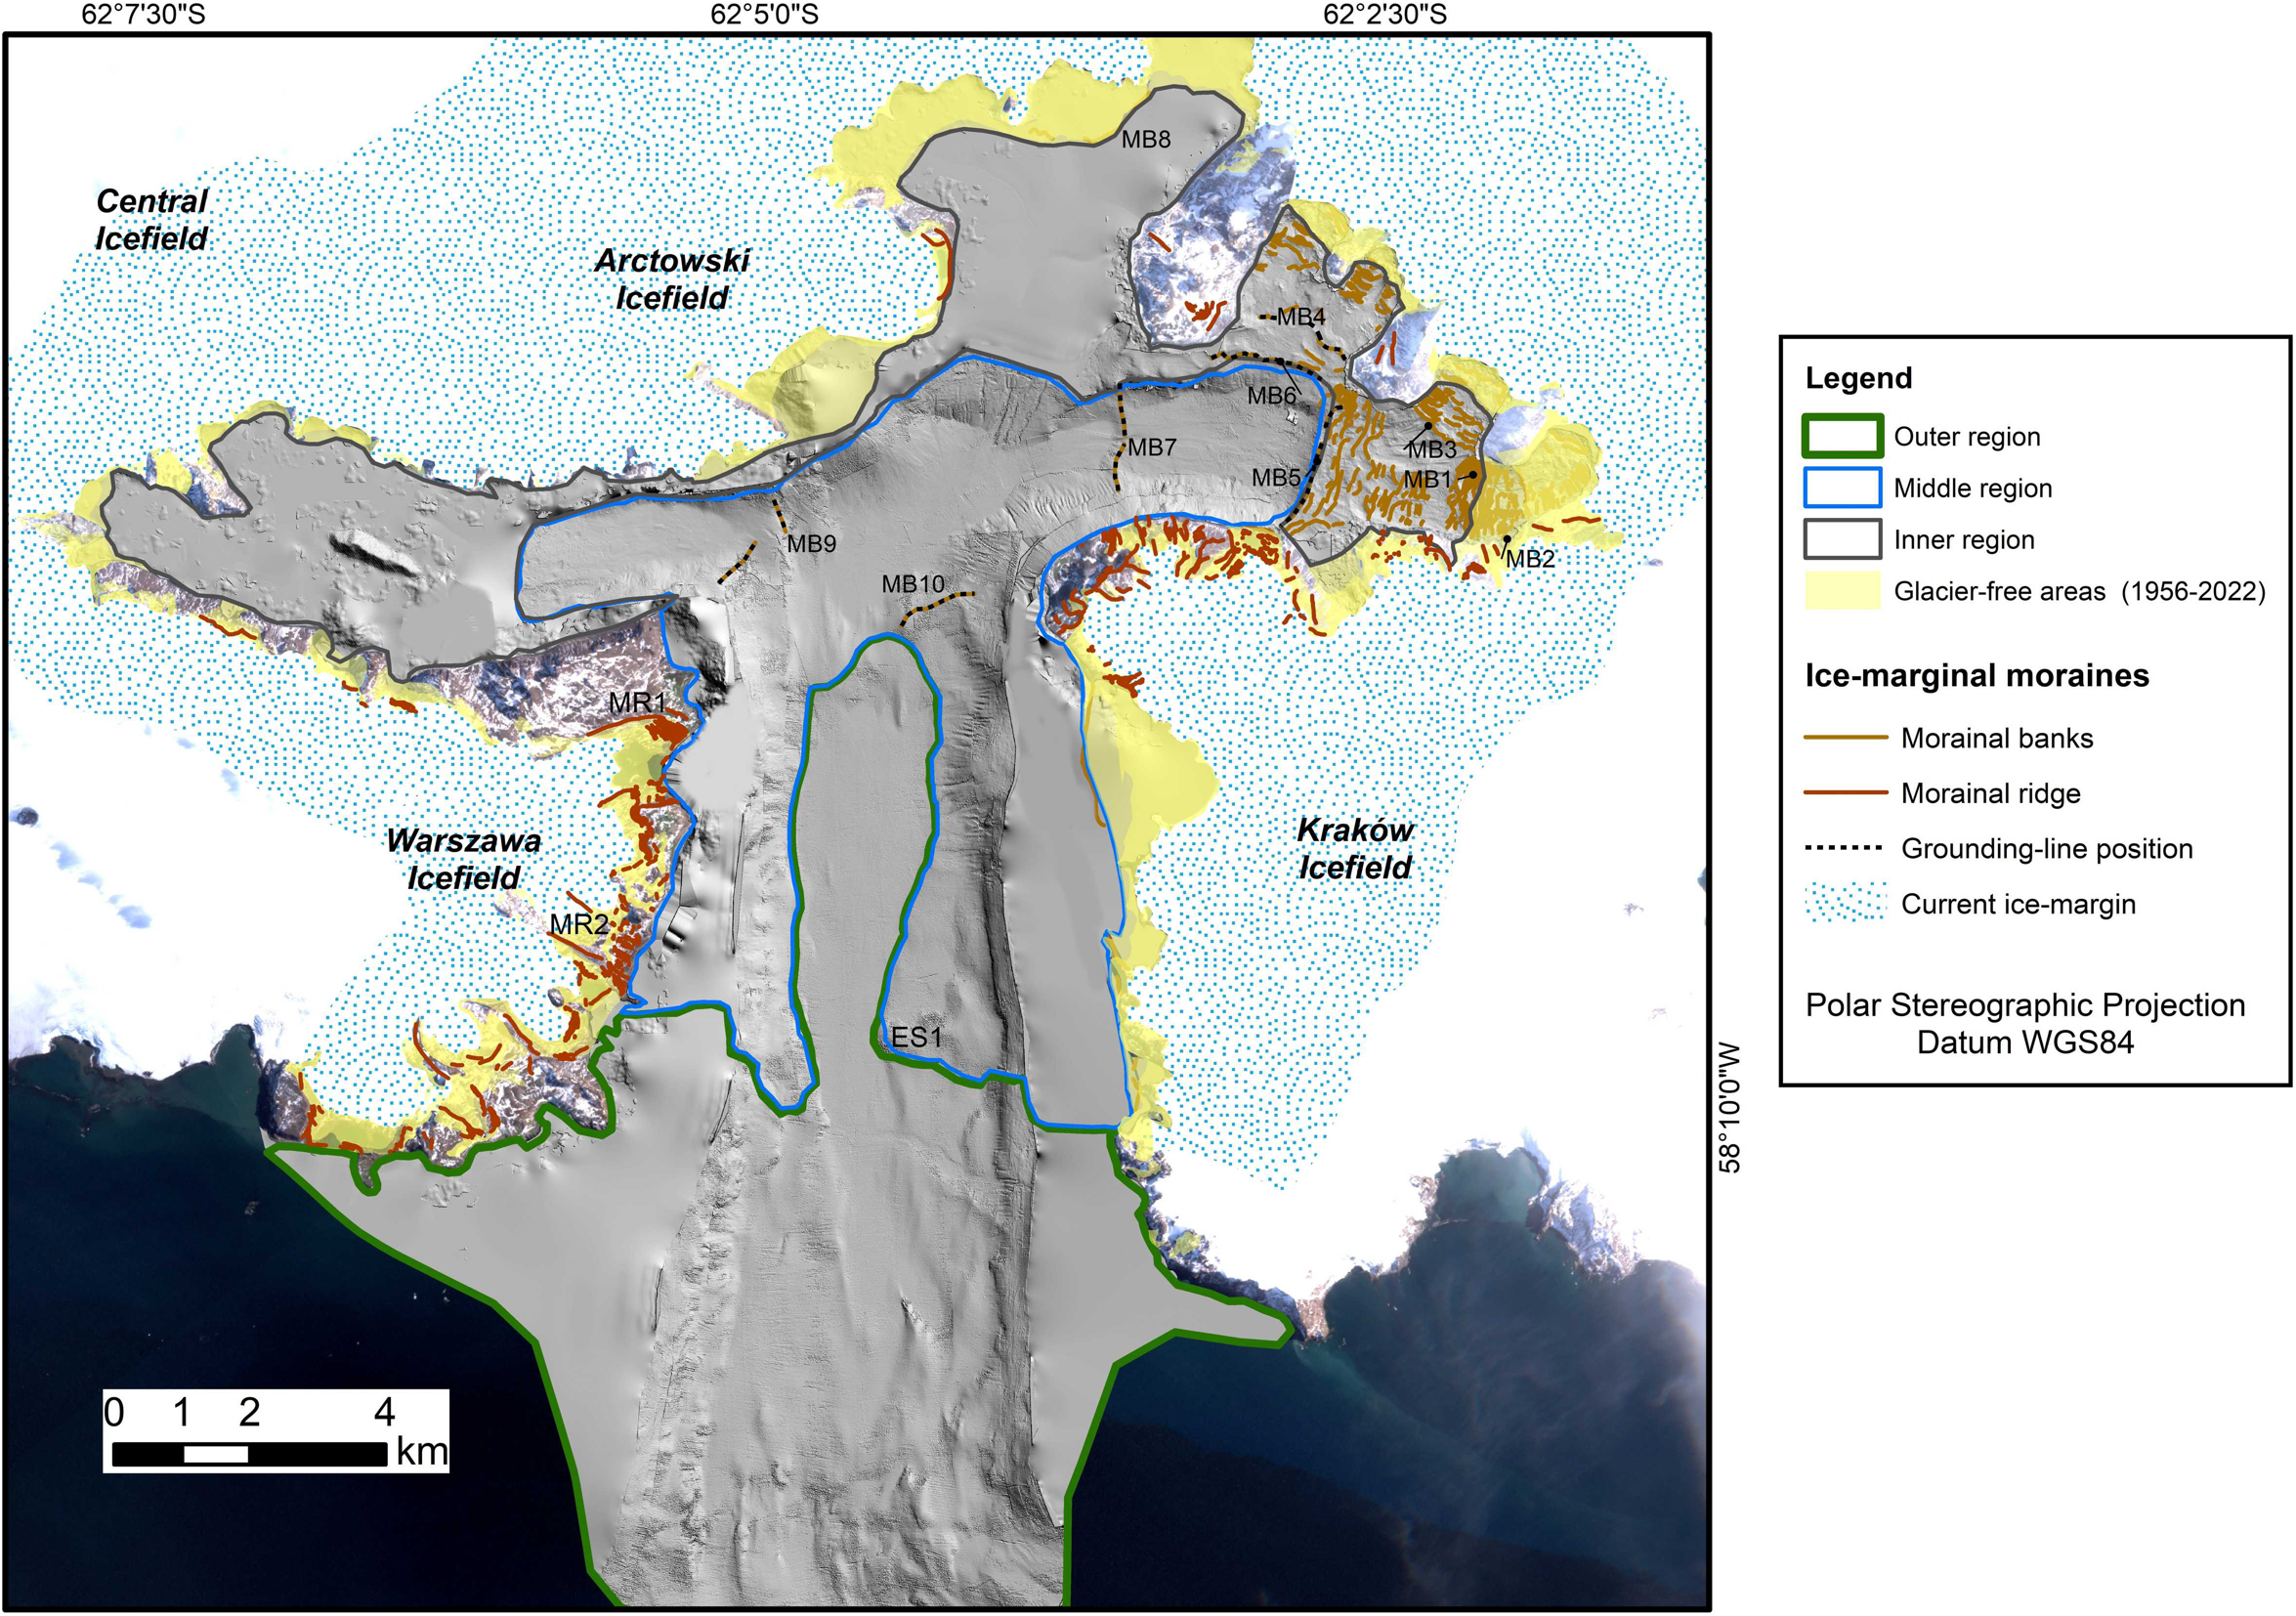
Figure 8. Evolution of the deglaciation on the fjord and morainal banks, morainic ridges (glacier-free areas) and grounding-line positions.
Eskers were identified in the inner sector of Martel Inlet. They appear sinuous and are parallel to the glacial palaeoflow. An esker (ES1; Fig. 8; east to west orientation) was identified in the middle sector and is sinuous and parallel to an ancient glacial ice flow from the Kraków Icefield.
The glaciers deposited a prominent lateral morainic ridge on proglacial areas on KGI and shallow and large morainal banks (MB5, MB1 and MB3) in AB. The morainal bank MB5 (Figs 8 & 9) measures ~1.4 km in length and 8 m in height from its base (with some sections presenting lower elevations of 3–5 m) and a base width of 60 m. It is recorded at a distance of 4.4 km from the present glacial margin of Dobrowolski Glacier, at a depth of 52 m.
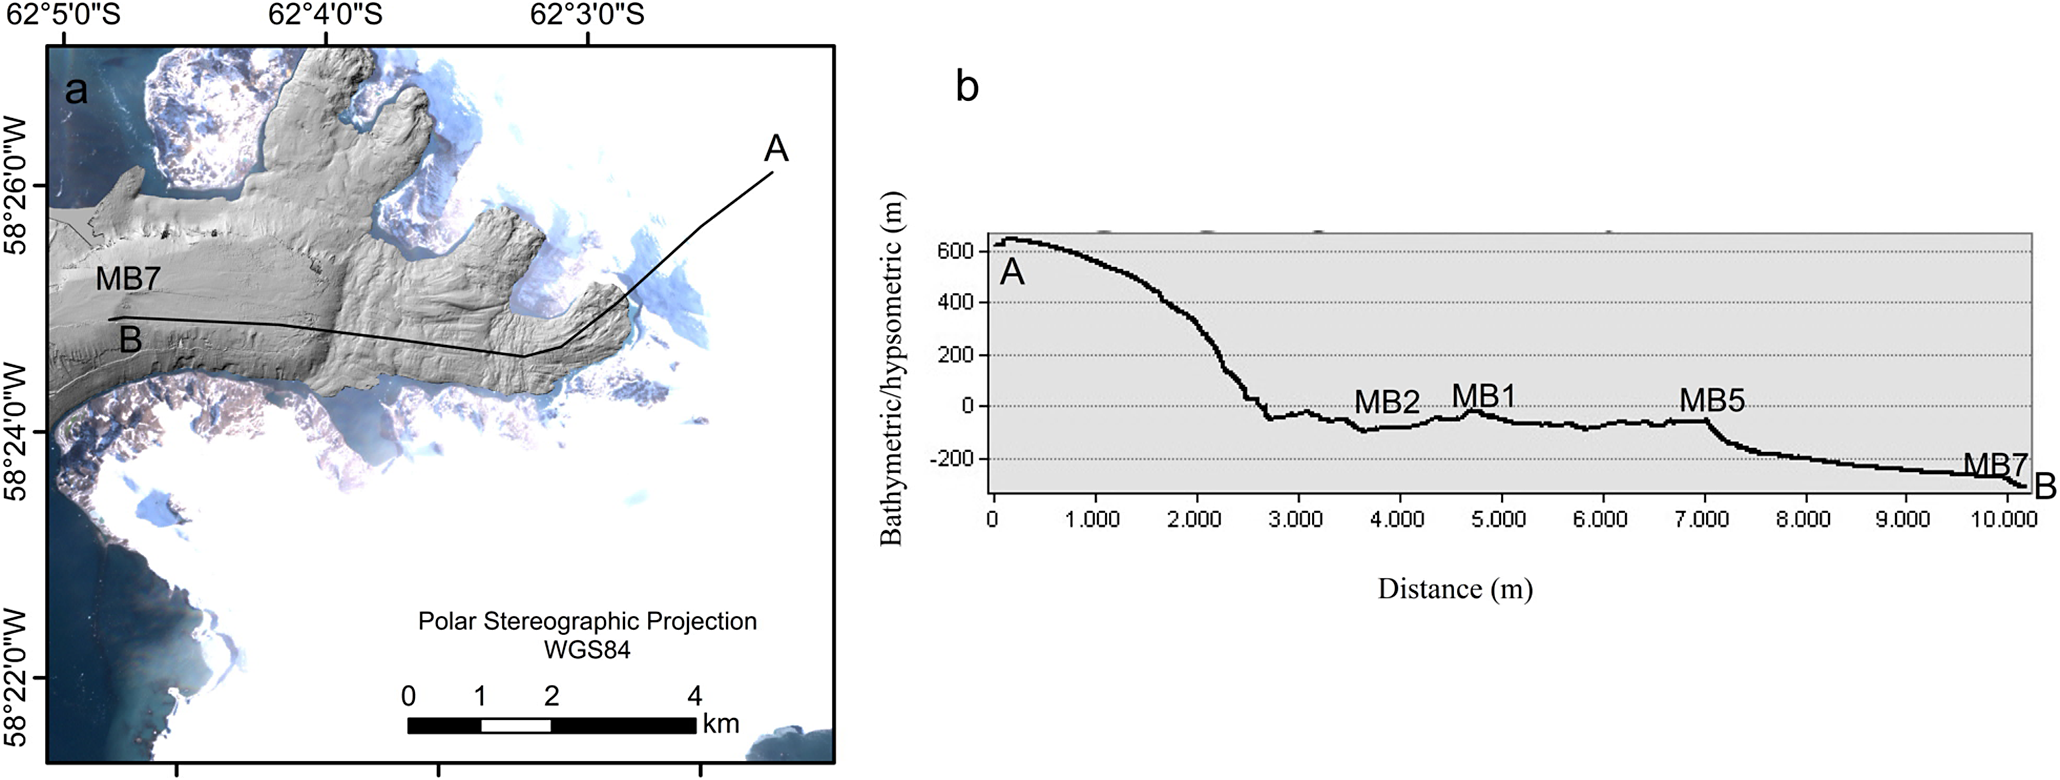
Figure 9. a. Bathymetry of Martel Inlet. b. Length of the glacial palaeoflow at 3500 years bp. Letter A indicates the start of the profile and B indicates the end of it.
A feature transverse to the ice flow (MB1; Fig. 9) at ~30 m in height from its base (it can reach 60 m at some points), 675 m in length and 50 m in width is recorded at a distance of 2200 m from the ice margin (Dobrowolski Glacier). There are smaller, discontinuous and spaced morainal banks in the middle sector of deglaciation of Martel Inlet (Fig. 8). The position of the grounding line, recorded by morainal banks, was analysed to reconstruct the palaeo-ice stream glacier’s extension when it occupied AB in the past (Fig. 10).
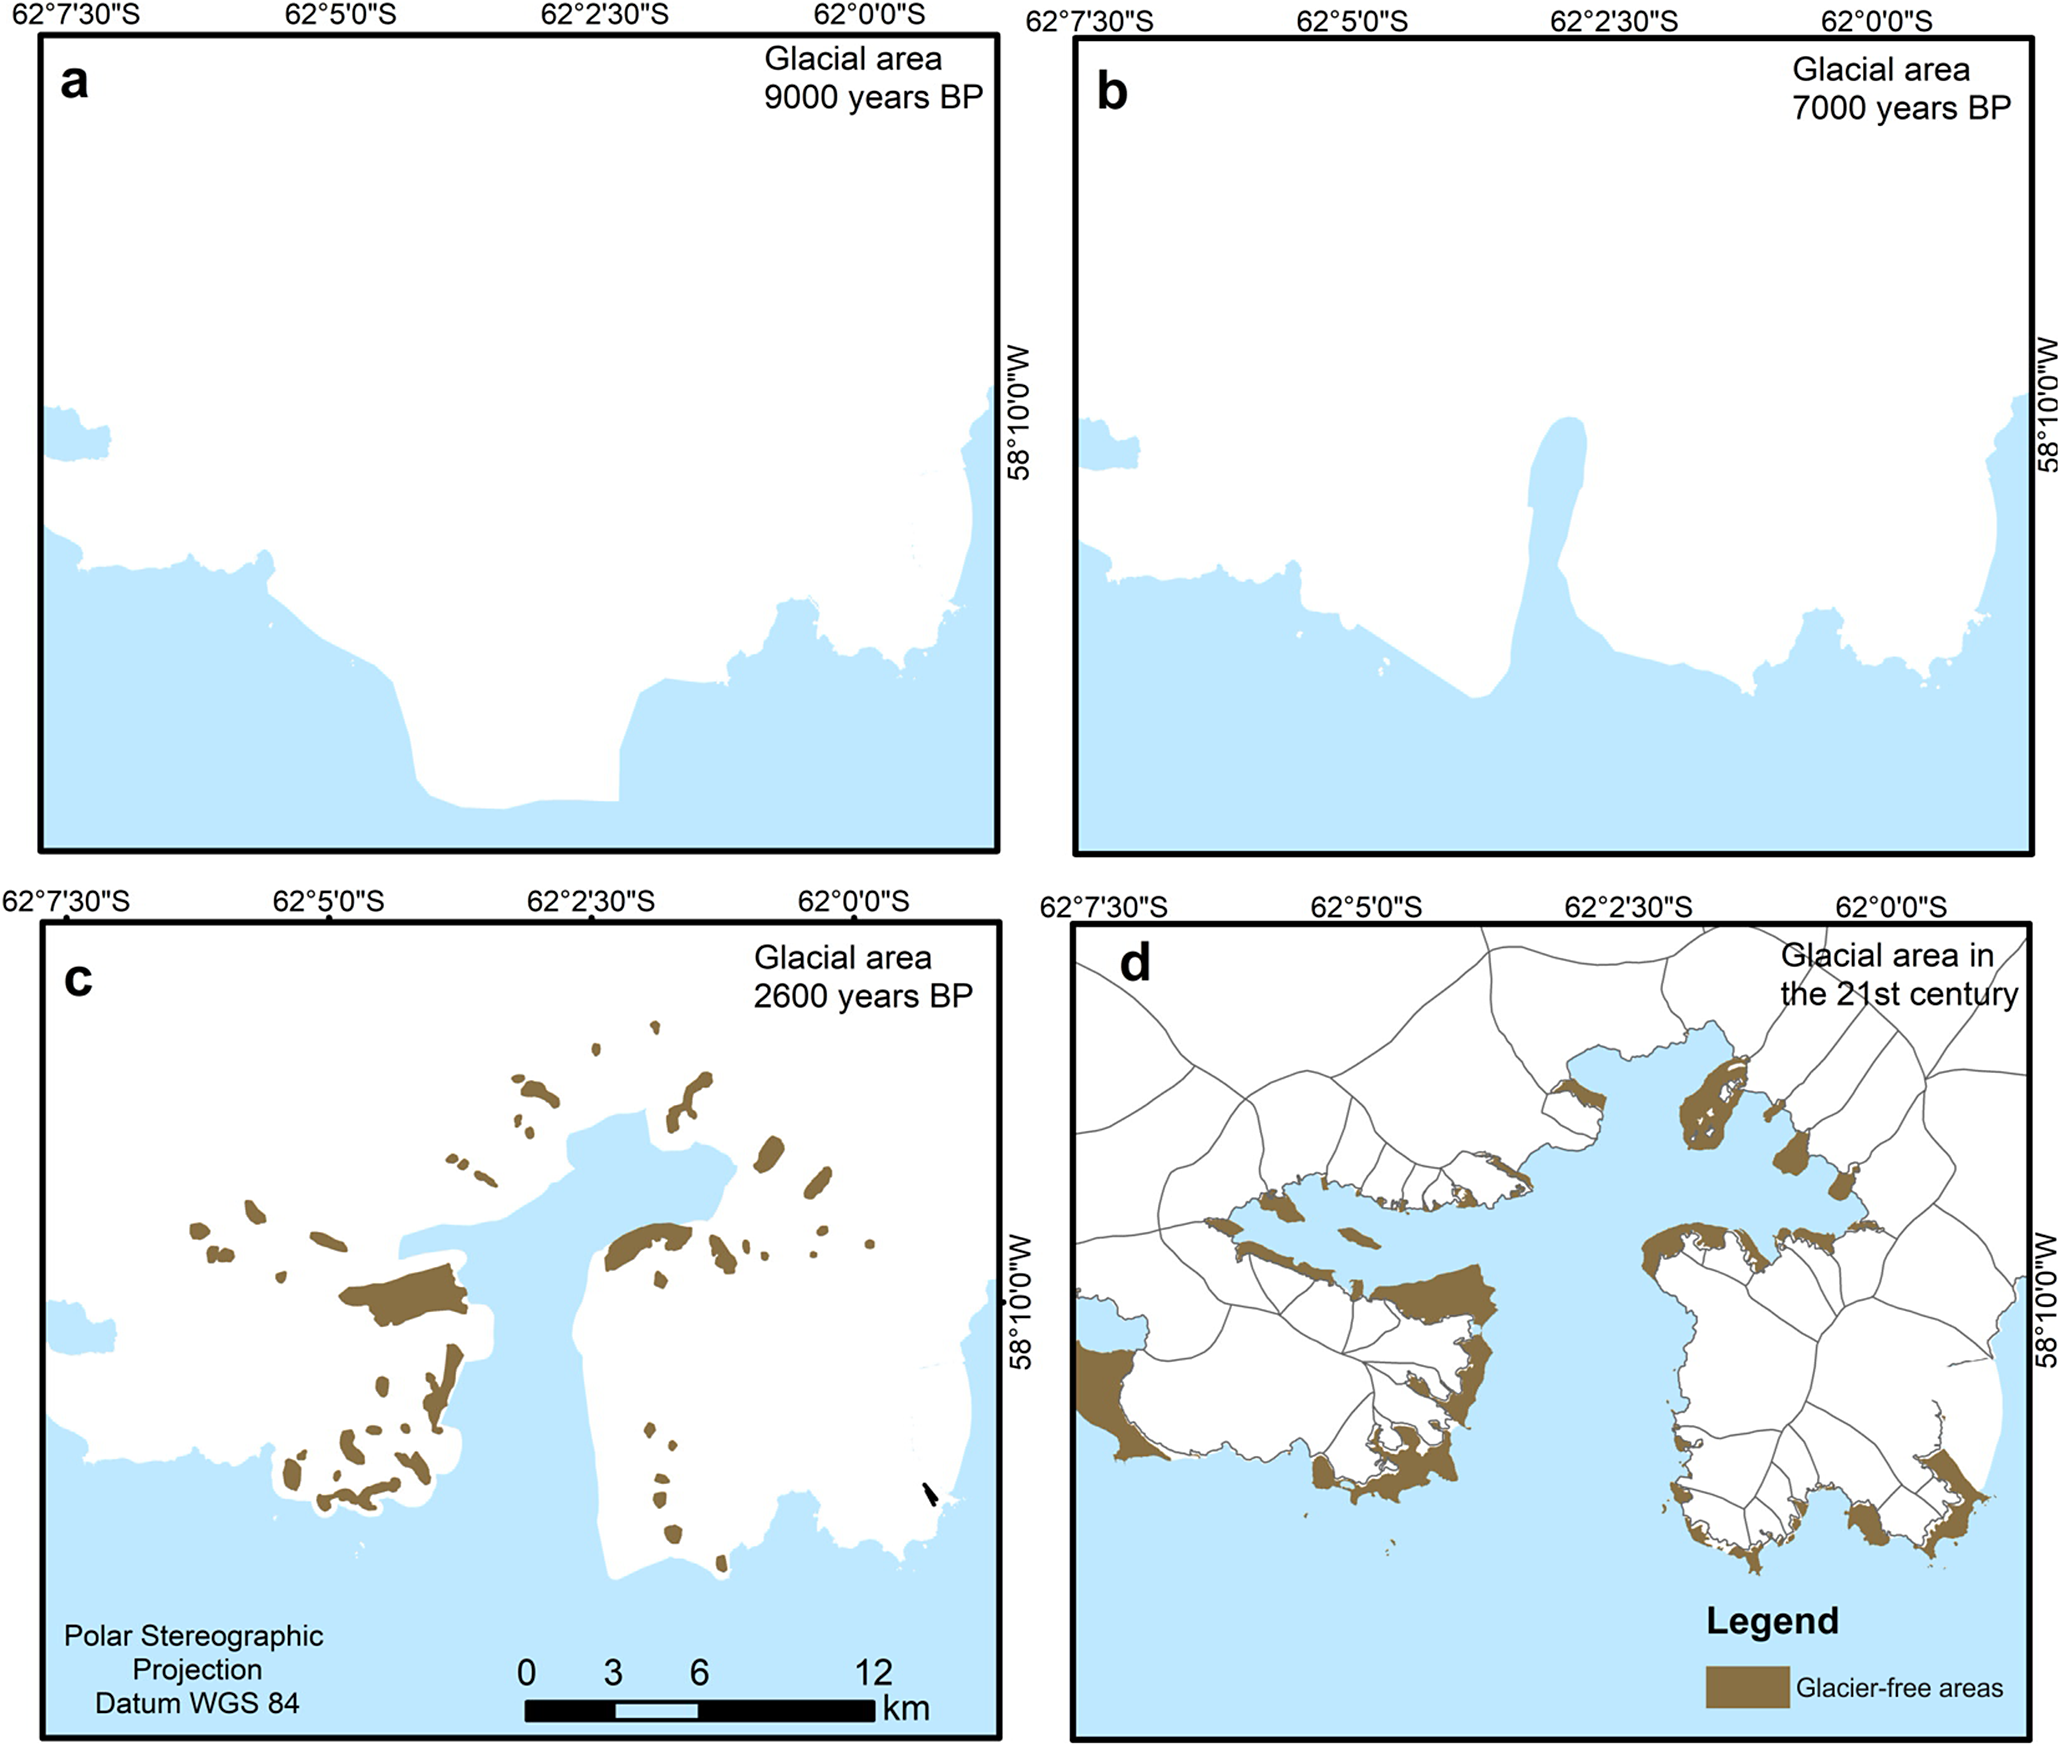
Figure 10. Reconstruction of the glacier’s extension in Admiralty Bay since 9000 years bp. a. The ice margin at the end of the fjord. b. Ice-margin position during the stillstand in the middle region and the calving bay configuration. c. Ice-margin position during the stillstand in the inner region (Neoglacial at 2600 years bp). d. Glacial area in 2022.
The mesoscale erosional features (linear depressions) observed in AB are most confidently interpreted as gullies. They are observed mainly on the steep slopes of Martel Inlet and in smaller quantities in AB, in the vicinity of Vieville Glacier and at the end of Mackellar Inlet. These features are small valleys observed on the fjord slope, representing the initial stage of canyon development (Benn & Evans Reference Benn and Evans2010). A palaeochannel eroded by subglacial meltwater flowing from the glacial margin to the mouth of the inlet was identified from the bathymetry data, indicating a wet basal thermal regime for the ice mass that occupied Mackellar Inlet. Magrani (Reference Magrani2014) also identified 1 km-long submarine channels at the site, indicating the contribution of meltwater and sediments to the glacial-marine environment.
Discussion
Deglaciation of the palaeo-ice stream in the fjord
In the Early Holocene, an ice stream flowed from the highest part of the central KGI icefield, with a north-south orientation, towards AB and eroded a U-shaped valley (Fig. 5). The grounding-line position was at AB’s end at 9000 years bp (Mäusbacher et al. Reference Mäusbacher, Müller, Munnich and Schmidt1989, Martinez-Macchiavello et al. Reference Martinez-Macchiavello, Tatur, Servant-Vildary and del Valle1996). Some elongated features record this palaeo-ice flow and are located at a depth of ~550 m (Fig. 5).
The outer sector has a relatively smooth valley floor compared to the sector at the head of the fjord. Marine currents, such as abyssal currents, and the accumulation of fine glacial-marine sediments, reworked particles and landforms in the deeper areas form a gentle topography.
The ice retreat on land after the deglaciation from the LGM across KGI occurred during the 11 000–8000 years bp period (Watcham et al. Reference Watcham, Bentley, Hodgson, Roberts, Fretwell and Lloyd2011, Oliva et al. Reference Oliva, Antoniades, Giralt, Granados, Pla-Rabes and Toro2016, Reference Oliva, Antoniades, Serrano, Giralt, Liu and Granados2019, Heredia Barión et al. Reference Heredia Barión, Strelin, Roberts, Spiegel, Wacker and Nidermann2023). In AB, the deglaciation progressed and paused in the middle region. A prominent morainal bank (MB10) in AB recorded a stillstand of the grounding line. This event could be associated with a decline in atmospheric temperature at ~8000–7000 years bp, as Mulvaney et al. (Reference Mulvaney, Abram, Hindmarsh, Arrowsmith, Fleet and Triest2012) reported. The findings of Mäusbacher et al. (Reference Mäusbacher, Müller, Munnich and Schmidt1989), Hjort et al. (Reference Hjort, Ingólfsson, Björck, Yoshida, Kaminuma and Shiraishi1992) and Ingólfsson et al. (Reference Ingólfsson, Hjort, Björck and Smith1992) indicate a prolonged period of decreasing mean air temperature on KGI and the advance or major stillstand of the palaeo-ice stream between 8000 and 7000 years bp. Morainal bank MB10 (depth of 450 m) is located at a fault-zone boundary over the Ezcurra Fault. Thus, there is evidence of structural conditioning.
At the time, it is inferred that the ice margin had formed a calving bay over the fjord and that the main ice flow had tributary glaciers. Locations such as Hennequin Point and Polish Navy Point (Fig. 2), today being glacier-free areas, were probably covered by ice at that time. Esker ES1, in the middle sector, indicates an ice flow in a west to east direction, following the orientation of the Kraków Fault.
The continued retreat of the palaeo-ice stream in the Holocene possibly led to the formation of the division of the palaeo-ice stream (main ice flow in a north to south direction) into glaciers with ice flows moving in east to west, north to south and west to east directions.
MB7 and MB9 indicate the positions of the grounding lines of glaciers during a major stillstand at the ends of the inlets. The grounding line at the end of Ezcurra Inlet was anchored on a morainal bank (MB9; Fig. 6) at 250 m deep, identified between Shag Rock Point and the south of Icefall Committee Glacier.
MB9 and MB7 mark the grounding-line positions during the stillstand and could be conditioned by the basement and fjord geometry. Mäusbacher (Reference Mäusbacher1991) and Ingólfsson (Reference Ingólfsson2014) found evidence of glacial expansion on KGI between 5000 and 4000 years bp. Additionally, records indicate a glacial advance on Brabant Island at ~5300 years bp (Hansom & Flint Reference Hansom and Flint1989, Ingólfsson Reference Ingólfsson2014). For James Ross Island, the data suggest a glacial advance at ~4600 years bp (Rabassa Reference Rabassa, Evenson, Scluchter and Rabassa1983). A sediment sample collected at the mouth of Ezcurra Inlet shows at its base the presence of dropstones and larger sand grains deposited by glaciers (ice-rafted debris) shortly after a glacier advance phase; this is at the same location as MB9 (Magrani Reference Magrani2014).
The deglaciation of Dobrowolski Glacier in Martel Inlet
The deglaciation led to the retreat of glaciers towards the inlets in response to climatic variability (Mid-Holocene, at 4500–2800 years bp) and conditioned by the deep bathymetry. In the AP, this warm period is associated with rapid and increased marine sedimentation (Totten et al. Reference Totten, Anderson, Fernandez-Vasquez and Wellner2015).
At Martel Inlet, where the morphology is rugged compared to AB’s middle region, the Dobrowolski Glacier grounding-line position (Fig. 9) was recorded by a prominent morainal bank (MB5). The distal part of the morainal bank is covered by sandy sediments and glacial debris (Magrani Reference Magrani2014).
The MB5 position recorded a significant stillstand, possibly in response to the decline in atmospheric and sea temperature anomalies at ~2600 years bp (Fig. 9). An anomalous bump characterizes this sector of the fjord and possibly marks the grounding-line position at 3500 years bp. Dating in moraines suggests a major advance of Collins Glacier located in Fildes Peninsula, KGI, during this period (Hall Reference Hall2007, Reference Hall2010). The last cooling (from 3500 to 2600 years bp) was part of a variability in climate on a millennial scale, with opposite anomalies occurring at East and West Antarctica (Mulvaney et al. Reference Mulvaney, Abram, Hindmarsh, Arrowsmith, Fleet and Triest2012). MB5 is similar to the outermost marine moraine complex identified at Potter Cove by Wölfl et al. (Reference Wölfl, Wittenberg, Feldens, Hass, Betzler and Kuhn2016) and Heredia Barión et al. (Reference Heredia Barión, Strelin, Roberts, Spiegel, Wacker and Nidermann2023). Wölfl et al. (Reference Wölfl, Wittenberg, Feldens, Hass, Betzler and Kuhn2016) argued that this feature provides evidence of the maximum position of Fourcade Glacier in the late Holocene readvance dated to ~2600–1600 years bp.
The glaciers nearby (Stenhouse and Ajax) were possibly anchored on morainal bank MB6 at depths of 50 m and at 2600 m from the ice margin. Comparatively, Wölfl et al. (Reference Wölfl, Wittenberg, Feldens, Hass, Betzler and Kuhn2016) recorded an extensive morainal bank at Fourcade Glacier dated to 2600 years bp. This event was also recorded by Björck et al. (Reference Björck, Håkansson, Olsson, Barnekow and Jansens1993), pointing to a glacial advance on Byers Peninsula, Livingston Island, southern South Shetland Islands, due to atmospheric cooling.
The frontal moraine crest, formed near the base of Mount Flagstaff with large boulders, indicates transport over long distances by a larger glacier during a Neoglacial event with stronger drag capacity than the small cirque valley glaciers that currently occupy Keller Peninsula (Francelino Reference Francelino2004). The O’Connor Rock outcrop (Fig. 4c) was probably an ice divide by that time.
By 2600 years bp, the main ice-flow direction was south-east to north-west (Fig. 10c). The tributary glaciers were Goetel, Professor and Krak. The grounding line of Dobrowolski Glacier was anchored on a morainal bank (MB5) at depths between ~40 and 60 m. This glacier eroded the bedrock outcrop, forming a striated pavement (Fig. 4d). During this period, Smok Peak and Mount Wawell (Fig. 4; elevations of 150 and 85 m, respectively) were ice divides between Wanda, Dragon and Viéville glaciers.
After 2600 years bp, Dobrowolski Glacier had retreated towards the headwaters and shallower areas of Martel Inlet. According to Yoon et al. (Reference Yoon, Park, Kim and Kim2000), a temperature increase occurred between 1900 and 1200 years bp, and the grounding line retreated to the shallower portion of Potter Cove. A sediment core collected near Dobrowolski Glacier indicates an increase in fine sedimentation after 1200 years bp, pointing to a shift to an open marine environment at this location (Yoon et al. Reference Yoon, Park, Kim and Kim2000). Before this, sedimentation at the core site was predominantly till, which would be characteristic of an ice-contact environment.
Glacial lineation and eskers (Figs 5 & 8) indicate a wet basal thermal regime for the glaciers at ~2600 years bp. Moreover, glacial lineation indicates rapid glacial flow to Dobrowolski Glacier during this period.
A shallow and prominent morainal bank (MB1 at ~2200 m from its Dobrowolski Glacier ice margin) records the stillstand of grounding lines on KGI more recently during the LIA (~1550–1800 ce). Compared to the other glaciers, Goetel Glacier (Martel Inlet) has a more prominent morainal bank (MB3), ~1150 m from its ice margin; Stenhouse and Ajax glaciers (Martel Inlet) formed a morainal bank at 920 and 890 m away from the ice margins, respectively, during the LIA, when they were pinned and stabilized.
A long-term temperature decrease trend occurred during the 600–300 years bp period (Mulvaney et al. Reference Mulvaney, Abram, Hindmarsh, Arrowsmith, Fleet and Triest2012, Abram et al. Reference Abram, Mulvaney, Wolff, Triest, Kipfstuhl and Trusel2013), representing the LIA. Abram et al. (Reference Abram, Mulvaney, Wolff, Triest, Kipfstuhl and Trusel2013) noted a decrease in melting linked to this period of pronounced cooling.
The outer lateral moraine (MR1; Fig. 8), to the north of Ecology Glacier, was dated to the end of the nineteenth century, corresponding to the end of the LIA (Angiel & Dąbski Reference Angiel and Dąbski2012). Other moraines with the same location and size are laterally present on Baranowski Glacier (MR2). This scenario is attributed to the maximum glacial extension during the LIA.
The retreat of marine-terminating glaciers at Martel Inlet was influenced by fjord geometry. Stenhouse and Ajax glaciers have a higher retreat rate than the other glaciers at Martel Inlet until the 2022 grounding-line position (10D), with a few spaced morainal banks (identified from the bathymetry data given their proximity to AB; Figs 4 & 6). Stenhouse and Ajax glaciers flowed through a wider valley than Goetel and Dobrowolski glaciers. Carr et al. (Reference Carr, Stokes and Vieli2014) highlighted that glaciers retreat more rapidly when occupying a wider valley. A pinning point is related to a decrease in retreat rates. When the glacier loses this anchorage, the iceberg calving rate increases, leading to increased retreat (Bianchi et al. Reference Bianchi, Arndt, Willian, Benn, Bertrand and Cui2020). The increase or decrease in iceberg calving also depends on the fjord’s depth and width; the calving rate is lower in narrower fjords (Carr et al. Reference Carr, Stokes and Vieli2014). Tidewater glaciers tend not to respond linearly and are asynchronous to regional climatic and oceanographic signals (Motyka et al. Reference Motyka, Cassotto, Truffer, Kjeldsen, Van and Korsgaard2017). Wölfl et al. (Reference Wölfl, Wittenberg, Feldens, Hass, Betzler and Kuhn2016) also point to the stabilization of Fourcade Glacier due to the narrow geometry of the fjord.
Conclusions
The glacial geomorphological mapping of both the terrestrial and submarine environments of AB and adjacent glacier-free areas was interpreted, and it revealed changes in the extent, flow direction and thermal regime of palaeo-ice streams in AB and at Dobrowolski Glacier.
The grounding-line position of the palaeoglacier fluctuated in response to climate changes. The prominent morainal bank (MB10) represents periods when the palaeoglacier’s grounding line was pinned in the middle of the fjord.
The proximal parts of AB display an irregular morphology and thin layers of sedimentary deposits, with some points demonstrating bedrock outcrops. The MB1 moraine bank was established when Dobrowolski Glacier experienced a major stillstand during the LIA period. The morainal banks in the proximal environments at Martel Inlet are smaller, discontinuous and spaced, indicating the retreat pattern in recent decades.
The subglacial landforms also indicate a wet basal thermal regime. Rapid ice flow characterized the ice dynamics in the past. The glacial lineation from our records indicates active flow of the ice stream in AB during the Early Holocene.
In the submarine environment, depositional features show changes in glaciers and anchoring points at the fjord. The retreat rate in the deeper areas of the fjord was faster, as suggested by smaller or non-existent morainal banks, compared to that in the shallow areas of the fjord (inner region). After the loss of two anchoring points, the retreat rates of Dobrowolski Glacier possibly became greater in response to the warming climate trend. After the glacier’s last maximum advance, recent and discontinuous moraine banks can be identified in the deglaciated area.
The glacier fluctuations responded to oceanic and climatic inputs, bedrock pinning points and the (narrow) geometry of the fjord. They were also possibly conditioned by geological structural patterns, as can be seen at Ezcurra Fault.
Acknowledgements
We thank the Postgraduate Program in Geography of the UFRGS.
Financial support
We thank the Conselho Nacional de Desenvolvimento Científico e Tecnológico (CNPq) Project 465680/2014-3 (INCT da Criosfera), Coordenação de Aperfeiçoamento de Pessoal de Nível Superior (CAPES), Brazilian Antarctic Program (PROANTAR), Observation of Research Support of the State of Rio Grande do Sul (FAPERGS) for financial support.
Competing interests
The authors declare none.
Author contributions
ClP, KKdR, CaP, FJGM and LFV: conception, approach and execution of the experiment. ClP, KKdR, FJGM and LFV: preparation of figures. ClP, CaP, KKdR, JCS, RV, AAN and FJGM: drafting of the initial manuscript and revision of the final article.


 Open access