


Introduction
The Southern Ocean (SO) is experiencing regionally dependent climate-linked changes in sea ice, primary productivity and community composition that may affect the ecosystem services they provide to upper trophic levels (Massom et al. Reference Massom, Reid, Stammerjohn, Raymond, Fraser and Ushio2013, Thomalla et al. Reference Thomalla, Nicholson, Ryan-Keogh and Smith2023, Clem et al. Reference Clem, Raphael, Adusumilli, Amory, Baiman and Banwell2024). From analyses of diet and tracking data collated for far-ranging top predators, McCormack et al. (Reference McCormack, Melbourne-Thomas, Trebilco, Blanchard, Raymond and Constable2021) showed the Indian and west Pacific oceans’ mid-level food webs were dominated by mesopelagic fish and krill species other than Euphausia superba, while E. superba predominated at mid-trophic levels in the east Pacific and Atlantic oceans. As predator populations respond to the productivity of lower trophic levels, their status provides insights into the integrated state of ecosystems, and some top predator species may act as ‘sentinels of change’ (Hazen et al. Reference Hazen, Abrahms, Brodie, Carroll, Jacox and Savoca2019). Identification and management of the effects of anthropogenic pressures on marine wildlife require a robust understanding and the delivery of essential biological and ecosystem variables (e.g. BioEco EOVs; https://goosocean.org/) in relation to population status and long-term trends (Constable et al. Reference Constable, Melbourne-Thomas, Corney, Arrigo, Barbraud and Barnes2014, Miloslavich et al. Reference Miloslavich, Bax, Simmons, Klein, Appeltans and Aburto-Oropeza2018).
Southern elephant seals (Mirounga leonina Linn.) are major consumers of mid-level SO productivity (Hindell et al. Reference Hindell, Bradshaw, Guinet, Harcourt, Gales, Hindell and Kirkwood2003). Four distinct meta-populations are recognized (Slade et al. Reference Slade, Moritz, Hoelzel and Burton1998, Hoelzel et al. Reference Hoelzel, Campagna and Arnbom2001, Corrigan et al. Reference Corrigan, Fabiani, Chauke, McMahon, de Bruyn and Bester2016), with a combined circumpolar foraging area (Hindell et al. Reference Hindell, McMahon, Bester, Boehme, Costa and Fedak2016). Their largest populations are at South Georgia in the south Atlantic Ocean (n = 397 000) and at Iles Kerguelen in the southern Indian Ocean (n = 348 000; Hindell et al. Reference Hindell, McMahon, Bester, Boehme, Costa and Fedak2016, Laborie et al. Reference Laborie, Authier, Chaigne, Delord, Weimerskirch and Guinet2023). Macquarie Island in the south (west) Pacific Ocean has a smaller population of ~60 000 and has experienced a sustained decrease in numbers since the 1940s when counts began (van den Hoff et al. Reference van den Hoff, McMahon, Simpkins, Hindell, Alderman and Burton2014, Hindell et al. Reference Hindell, Sumner, Bestley, Wotherspoon, Harcourt and Lea2017). In contrast, the Peninsula Valdes population, south Atlantic Ocean, of ~56 000 seals, has increased (Ferrari et al. Reference Ferrari, Lewis, Pascual and Campagna2009, Reference Ferrari, Campagna, Condit and Lewis2013), along with two south Indian Ocean populations at Iles Kerguelen and Crozet Archipelago, also following periods of decrease and stabilization (Laborie et al. Reference Laborie, Authier, Chaigne, Delord, Weimerskirch and Guinet2023). The South Georgia population and the Heard Island population (n = 62 000), south Indian Ocean, are thought to be stable (Hindell et al. Reference Hindell, McMahon, Bester, Boehme, Costa and Fedak2016), but that understanding is based on surveys conducted almost 30 years ago (Boyd et al. Reference Boyd, Walker and Poncet1996, Slip & Burton Reference Slip and Burton1999, Hindell et al. Reference Hindell, McMahon, Bester, Boehme, Costa and Fedak2016). The differing regional patterns in population trends suggest that southern elephant seal populations are principally responding to large-scale factors affecting food availability in their distinct foraging areas (McMahon et al. Reference McMahon, Burton and Bester2003, Reference McMahon, Bester, Burton, Hindell and Bradshaw2005, Reference McMahon, Harcourt, Burton, Daniel and Hindell2017, Clausius et al. Reference Clausius, McMahon and Hindell2017a,b, Hindell et al. Reference Hindell, Sumner, Bestley, Wotherspoon, Harcourt and Lea2017), but local factors such as predation pressure can also influence their population trajectories (Laborie et al. Reference Laborie, Authier, Chaigne, Delord, Weimerskirch and Guinet2023).
Female elephant seals (cows) are philopatric (Hindell & Little Reference Hindell and Little1988), returning twice each year to their natal islands for reproduction and for moulting. Their polygynous breeding system means that reproductively active cows aggregate into harems, where they can be counted repeatedly during the annual breeding season (September–November). Here, we analysed a long-term study of southern elephant seal numbers at Macquarie Island to reassess the status and the trend of the population. Quasi-regular surveys began in 1949, becoming annual since 1985, providing 46 years of survey data. We review the relationship between count estimates for the main isthmus study area (ISA) and that for the island as a whole, and we test whether the phenology of cow arrivals has changed over time. Finally, we quantified the relationship between inter-annual variability in the numbers of cows ashore and environmental variability using a subset of the Southern Annular Mode (SAM) index as a proxy for change in the seals’ summer foraging environment.
Methods
A standardized census area (the ISA)
A change in methodology over the duration of this study was the extent of the ISA. Historically, the ISA extended from Catch-Me Point to Hasselborough Corner on the west coast and from Garden Beach to Half-Way Hill on the east coast. The Half-Way Hill beach was excluded from the ISA after 1993, and the beaches of West Beach, to the west Hasselborough Corner, were included. Adding and/or removing census areas to previously defined study areas make it difficult to compare across years without diligent data quality control. We provide the complete quality-controlled dataset for future reference in Table S1. West Beach was never part of the ISA, and therefore all counts of those harems were excluded from our census area and population estimates. Here, we have standardized the modelled count data to the ISA, as is shown in Fig. S1. Any future census and reanalyses of the southern elephant seals population on Macquarie Island should bear this in mind when allocating resources to the task of data collection.
Data collection
The Macquarie Island southern elephant seal population is amongst the most studied of all southern elephant seal populations, with the cows on the beaches counted within the ISA (Carrick & Ingham Reference Carrick and Ingham1962). Each harem (aggregation of cows) in the ISA was counted at least once per year between 1 September and 15 November, with a focus in later years (2006+) on the week surrounding 15 October (see later). The ISA was surveyed on 59 occasions between 1949 and 2023, 46 of which had counts on at least 2 days (Table S1).
Whole-island counts were made less frequently (20 times between 1959 and 2024), and only on a single survey day as near to 15 October as practical in each year, depending on availability of personnel. Estimates of maximum numbers of cows for the whole island were obtained by applying correction factors by date to the observed data. Correction factors (i.e. the proportion (p) between 0 and 1) applied to the whole-island count data were based on the Gaussian pattern (see later) of the arrivals and departures of cows within the ISA, and centred on the date of maximum numbers (Hindell & Burton Reference Hindell and Burton1987).
Estimating total number of breeding cows each year (pup production) within the ISA
Prior to 1993, counts were usually made by a single observer, recording the number of cows present in each harem. After that, each harem was counted by two observers, and recounted when the two estimates varied by more than 5%. We assumed that counts still may vary between individual counters and account for this variability within the model (described later), which fits a curve to the raw counts. Daily counts of cows throughout the breeding season approximate a Gaussian distribution, with a peak in numbers in mid-October (McCann Reference McCann1980, Pascal Reference Pascal1981, Hindell & Burton Reference Hindell and Burton1987). This pattern of arrivals and departures has remained consistent over time for the majority of southern elephant seal populations (Barrat & Mougin Reference Barrat and Mougin1978, Condy Reference Condy1979, Pascal Reference Pascal1981, Guinet et al. Reference Guinet, Jouventin and Weimerskirch1992, Slip & Burton Reference Slip and Burton1999, Lewis et al. Reference Lewis, Campagna and Zavatti2004, Authier et al. Reference Authier, Delord and Guinet2011, Oosthuizen et al. Reference Oosthuizen, Pistorius, Bester, Altwegg and de Bruyn2023). A Gaussian distribution enables maximum numbers to be estimated from discontinuous count data collected outside the date of maximum arrivals (Boyd et al. Reference Boyd, Walker and Poncet1996). Given that the duration of the breeding season (~75 days) is longer than an individual cow is present in the colony (~28 days), a count of cows ashore on any census day will underestimate the total number that were ashore to breed in any year (i.e. at any one time early-arriving cows will have weaned their pups and left the beaches, while others will have yet to arrive). We developed a statistical model based on a Gaussian distribution to estimate the total number of cows ashore over a breeding season based on the observed daily counts and accounting for the duration of stay for individuals. As the majority of cows give birth to a single pup (McMahon & Hindell Reference McMahon and Hindell2003), the estimated total number of cows ashore can be regarded as a robust measure of total pup production in that year (Fig. 1).
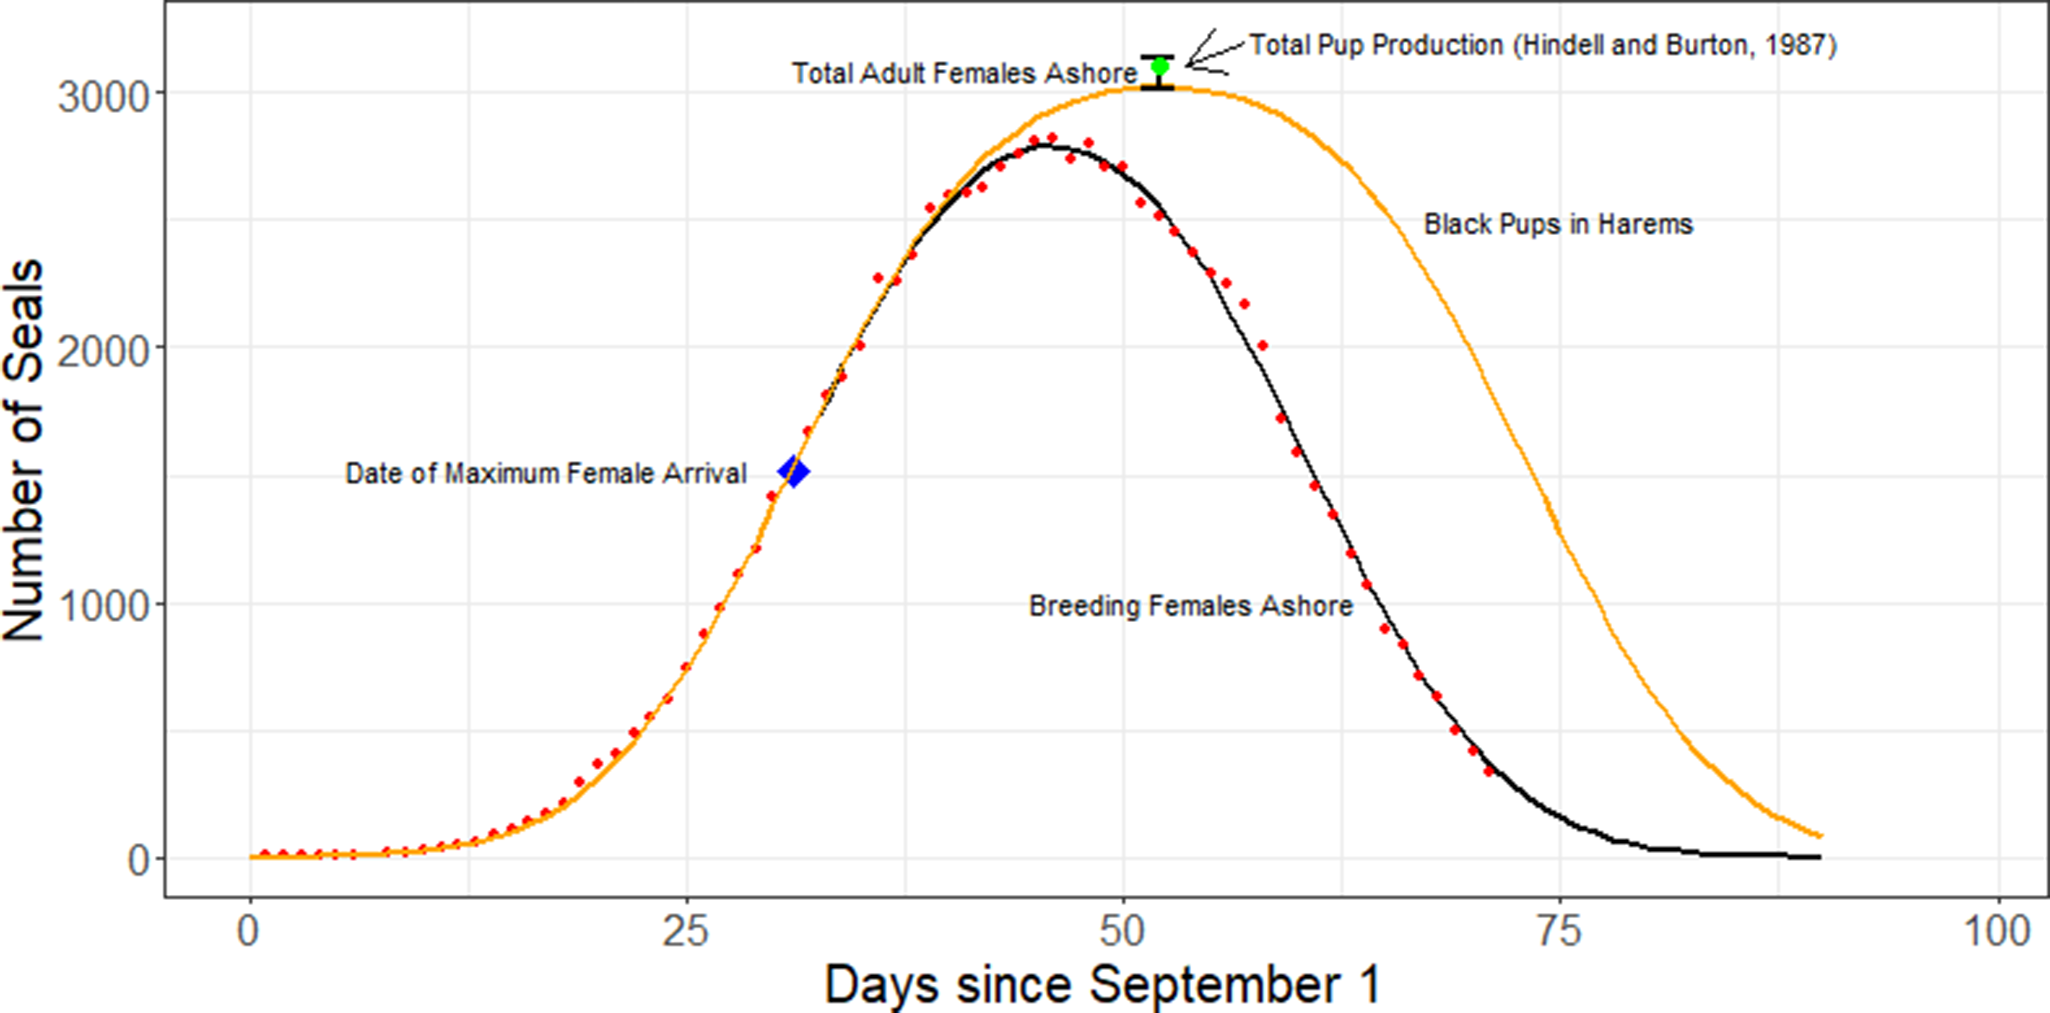
Figure 1. An example of a model output from southern elephant seal (Mirounga leonina) count data (red dots) collected during 1985 at Macquarie Island. The black line is the Gaussian fit used to estimate the number of breeding females ashore on each day. The orange line is the model-estimated number of pups in the harems (allowing for the mean duration of an individual female’s time ashore (d) of 28 days). The total estimated number of breeding females (n) for that year is indicated by the upper and lower 95% confidence limit (black error bar). The blue diamond indicates the date of maximum arrival rate (a). Also shown is the observed pup production for that year (green dot) based on counts for females, weaned pups and dead pups (Hindell & Burton Reference Hindell and Burton1987).
We developed an initial model in which the total number of cows in each year (n) was treated as a fixed effect, with random effects for mean arrival time (a) and duration of stay (d). The following model notation is for the nlme package in R:
-
Model 1 (null model with fixed terms) = nlme (Count ~ n*(pnorm(Day, a, s)-pnorm(Day, a + d, s)),
-
fixed = n + a + d + s ~ 1,
-
random = a ~ 1 | Survey,
-
start = c (n = 3200, a = 35, d = 28, s = 8), (note: for model optimization select start values specific to your study population)
-
data=data)
-
where:
-
Count = the observed number of cows ashore on a particular Day
-
Day = census date, expressed as number of days after 1 September
-
Survey = the year of the census
-
a = Day of maximum arrival (also termed ’date of maximum presence’ in Authier et al. (Reference Authier, Delord and Guinet2011), ’μ’ in Slip & Burton (Reference Slip and Burton1999) and ’mean arrival date’ in Oosthuizen et al. (Reference Oosthuizen, Pistorius, Bester, Altwegg and de Bruyn2023))
-
d = duration (days) cows are ashore (’S’ in Authier et al. (Reference Authier, Delord and Guinet2011) and Slip & Burton (Reference Slip and Burton1999) and ’average residence period’ in van den Hoff (Reference van den Hoff2024)). We assumed the average duration of stay (d) for all cows was 28 days (5 days prepartum and 23 days lactation (Hindell & Burton Reference Hindell and Burton1988, Authier et al. Reference Authier, Delord and Guinet2011))
-
s = standard deviation, a measure of synchrony (’σ’ in Authier et al. (Reference Authier, Delord and Guinet2011) and Slip & Burton (Reference Slip and Burton1999))
-
n = the estimated maximum number of cows ashore in that year = pup production
We then generalized Model 1 to allow cow numbers to vary from year to year:
-
Model 2 = nlme(Count ~ n*(pnorm(Day,a,s) - pnorm(Day, a + d, s)),
-
fixed = list(n ~ Survey −1,a + d + s ~ 1),
-
random = a ~ 1 | Survey,
-
start = c (n = rep (3200, a = 35, d = 20, s = 8),
-
control = nlmeControl (returnObject = TRUE, msMaxIter = 500),
-
data=data)
Finally, we included random effects for both mean arrival time (a) and duration of stay (d):
-
Model 3 = nlme (Count ~ n*(pnorm (Day, a, s) - pnorm (Day, a + d, s)), data=data,
-
fixed = list (n ~ Survey −1, a + d + s ~ 1),
-
random = a + d ~ 1 | Survey,
-
start = fief (Model 2),
-
control=nlmeControl(returnObject = TRUE, msMaxIter=500))
Comparison of the Akaike Information Criteria (AICs) indicated that Model 3 performed best (AIC(Model 2) = 17 945.85, AIC(Model 3) = 17 813.81). All models were fit in R using the nlme package.
Relationship between ISA counts and whole-island counts
The number of cows ashore within the ISA represents ~20% of the total Macquarie Island population (Hindell & Burton Reference Hindell and Burton1987). We tested whether the trend reported for the ISA would be representative of the whole island by correlating whole-island counts made on 18 years between 1959 and 2021 with the corresponding estimates of total number of cows within the ISA as described earlier.
Trends in total numbers of cows within the ISA from 1949 to 2023
We tested for a trend in the number of cows within the ISA between 1949 and 2023 by fitting a linear model to the natural log (ln) of the estimated number of cows ashore over time. We used the ln value as this accounts for non-linearity and allows for the estimation of the exponential rate of increase (r) for the population directly as the slope of the linear relationship between the ln of the number of cows and time (Caughley Reference Caughley1977).
Trends in date of peak arrival of breeding females in the isthmus from 1949 to 2023
Our model also provided an estimate of the day of peak arrival rate (a) for cows into the ISA, so we also tested for a trend in this date over the time series using a linear regression of a against year.
Variability in year-to-year numbers of cows ashore and the SAM
Due to the high level of covariance between the variables Summer SAM (i.e. the averaged December, January and February values) and Survey (year), it was not possible to test for the role of the SAM in the overall trend in cow numbers. All such analyses are inevitably confounded by time (both the count data and the environmental data vary through time), meaning that it is difficult to ascribe causality to any emerging relationships. We therefore used the relative number of all cows in each year (i.e. the residual of the ln ~ Survey regression), as this detrended the data and focused on the year-to-year variability (i.e. more or less than the expected number in a particular year). We tested whether the total number of cows ashore in a particular breeding year was influenced by ocean foraging conditions during the post-breeding period when cows recover condition lost during the preceding lactation period and before implantation of the blastocyst. Even then, we need to be careful to not over-parametrize the models because there are many potential explanatory variables, and simply including them all in a single analysis significantly increases the likelihood of type II errors (i.e. concluding that there is an effect when in fact there is none). We used our averaged Summer SAM as a proxy of ocean variability as SAM has been shown to be related to a number of physical and biological processes in the SO, including elephant seal weaning mass and overwinter foraging success and survival (McMahon & Burton Reference McMahon and Burton2005, van den Hoff et al. Reference van den Hoff, McMahon, Simpkins, Hindell, Alderman and Burton2014, Clausius et al. Reference Clausius, McMahon and Hindell2017a,b, McMahon et al. Reference McMahon, Harcourt, Burton, Daniel and Hindell2017, Volzke et al. Reference Volzke, McMahon, Hindell, Burton and Wotherspoon2021).
We obtained annual monthly SAM data from https://legacy.bas.ac.uk/met/gjma/sam.html and then averaged the December, January and February data (i.e. the Summer SAM) preceding each October–November breeding season. We also tested for temporal lags of 1–3 years (van den Hoff et al. Reference van den Hoff, McMahon, Simpkins, Hindell, Alderman and Burton2014). We then used generalized linear models (glm) to assess the relationship between the residual total number of cows (resid) in each Survey year with the Summer SAM value for the preceding summer (i.e. no lag). We included Survey year (= census year) in the model to enable us to assess the importance of the covariance between census year and the SAM. The models were assessed using AIC (Burnham & Anderson Reference Burnham and Anderson2001, Reference Burnham and Anderson2004), whereby models with the lowest AIC were taken to be the best models, and those with ΔAICs of < 2 were considered to be equivalent.
Results
Phenology of arrivals in the ISA from 1949 to 2023
The estimated date of peak cow arrival rate (model coefficient a) varied over time (Fig. 2a). When considering the entire dataset, there was no evidence for a trend change in a over the 74 years of this study (F 1,45, P = 0.062, r 2 = 0.54). However, after 1984 there has been a minor delay in a (F 1,45 = 12.28, P = 0.0003, r 2 = 0.28), indicating that cows were returning to the island later (on average by 0.9 h year−1, or a total of 1–2 days over the 40 year period; Fig. 2b).
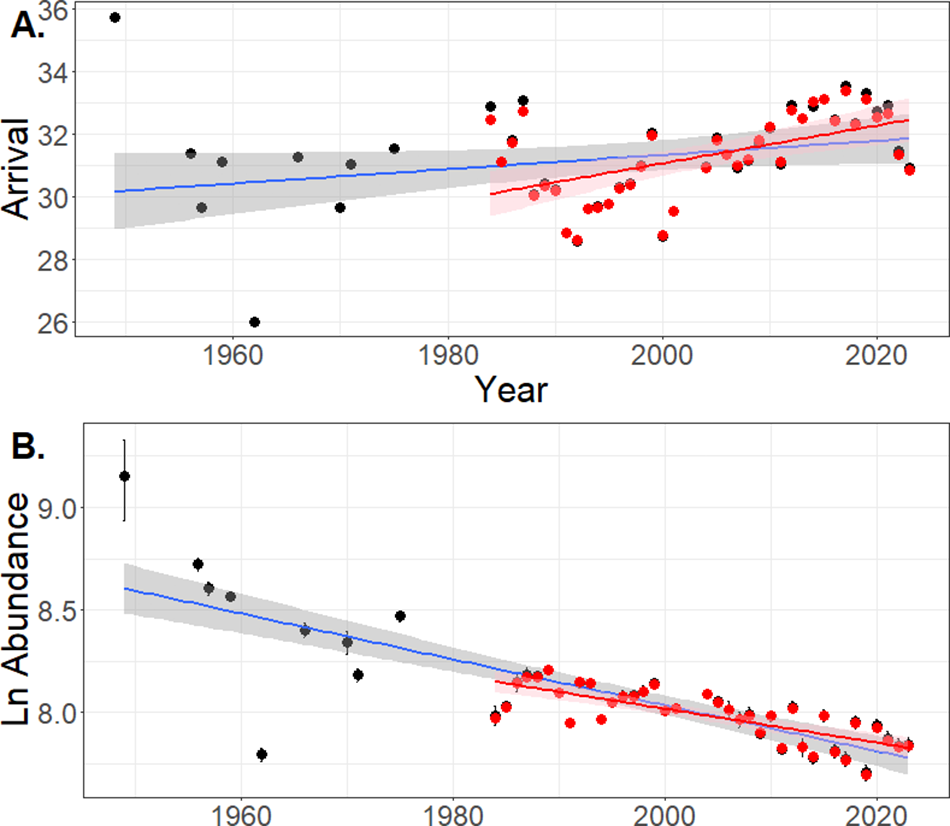
Figure 2. Trends in a. the day of peak arrival rate of the number of breeding female southern elephant seals (Mirounga leonina) on the Macquarie Island isthmus from 1949 to 2023, and b. temporal change in the natural log (ln) of model estimates for the maximum number of cows ashore. Black dots and blue lines encapsulate the 1949–2023 data, red dots and red lines are restricted to the near-continuous 1985–2023 data. In both, shading represents the 95% confidence interval of the estimated line of best fit.
Relationship between isthmus counts and whole-island counts
The estimated number of cows within the ISA was related to the total number of cows on the entire island (Fig. 3; F 1,16 = 125.8, P < 0.0001, r 2 = 0.8872), with the slope of the relationship being close to 1.0 (1.16 ± 0.104, coefficient ± standard error (SE)). This relationship remains even when the outlier value is removed from the analysis (F 1,15 = 66.1, P < 0.0001, r 2 = 0.8027).

Figure 3. The relationship between the natural logarithm (ln) of the total estimated number of breeding female southern elephant seals (Mirounga leonina) on the whole of Macquarie Island (whole island) plotted against ln total number within the isthmus study area during the same year (black dots). The solid blue line is the predicted relationship from a linear regression, with the shaded area representing the 95% confidence interval of the prediction.
Trends in total numbers of cows within the ISA from 1949 to 2023
Compared with the comprehensive breeding season count data collected after 1984, the earlier ISA counts were relatively few and irregular, resulting in larger SEs around some estimates of total numbers of cows ashore (Fig. 1 & Supplementary Material 1). We therefore considered the time series in two ways: 1) including all of the years and 2) restricting the analysis to after 1984 (Fig. 2a). Using the entire dataset, there was a negative trend in the ln number of cows in the ISA over time (F 1,45 = 88.7, P < 0.0001, r 2 = 0.656). The slope of this relationship was −0.011 ± 0.0011 cows ashore per year, which equates to an average exponential rate of change (r) of −1.1% year−1. Restricting the data to the post-1984 counts produced a very similar result (F 1,36 = 52.91, P < 0.0001, r 2 = 0.584), with a slope of −0.008 ± 0.0011 (r = −0.8% year−1). Allowing for the SE of the estimates, these slopes nearly, but not quite, overlap (Fig. 2b).
Year-to-year variability in total numbers of breeding cows ashore in the ISA
There was considerable year-to-year variability (± ~350 cows year−1) in the number of cows ashore within the ISA over the study period. Our hypothesis that ocean environmental conditions during the summer months influenced the total number of cows ashore in the following breeding season was not supported in any of the models we trialled (Table I). Indeed, Survey year alone was the top-ranked model, whereas our proxy of ocean environmental conditions, the Summer SAM, was the lowest-ranked model in each case (lower than the null model). This suggests that variability in ocean conditions during the proceeding summer had little if any effect on variability in cow numbers in the ISA. This was also the case for each of the lags that we modelled, with the Survey year-only model always ranking higher than the Summer SAM models.
Table I. Results of linear models relating the total number of breeding cows ashore on the isthmus (detrended) to the mean Summer SAM value from the preceding summer (December, January and February) and survey year (Year)). Also included are models using 1, 2 and 3 year lags (lag1, lag2 and lag3, respectively).
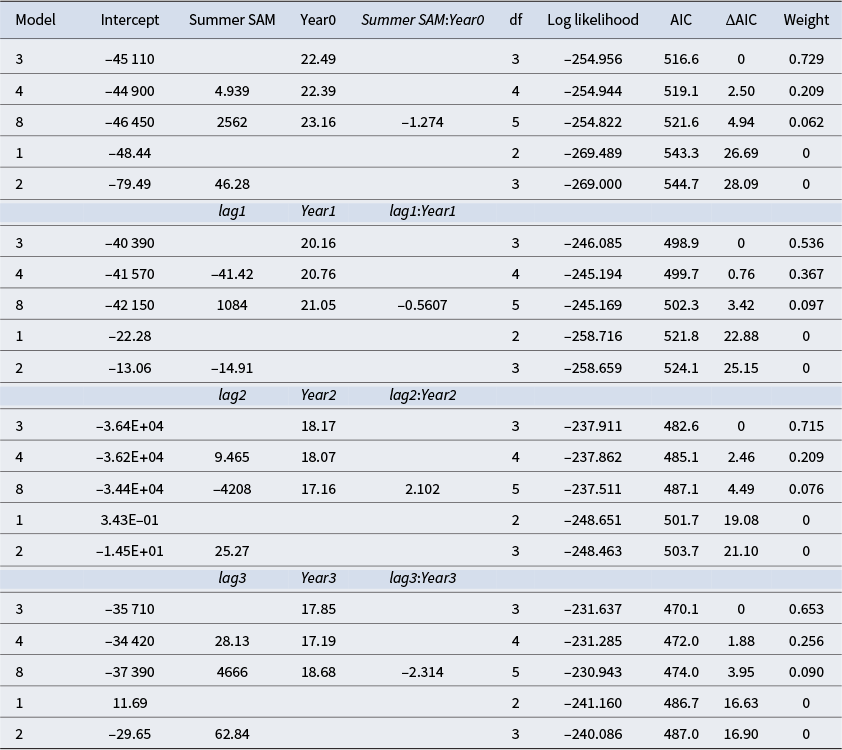
AIC = Akaike Information Criterion; df = degrees of freedom.
Discussion
Cow phenology
Documented shifts in the phenology of life history events for SO marine mammals are rare (de Kock et al. Reference de Kock, Oosthuizen, Beltran, Bester and de Bruyn2021). The small change in the day of maximum arrival rate we detected at the population level for Macquarie Island cows since the late 1980s (~2 days later in 2023 than in 1985) probably has little effect on the population overall. However, it may be indicative of changing resource availability, perhaps to a component (e.g. a particular age class) of the population (Oosthuizen et al. Reference Oosthuizen, Pistorius, Bester, Altwegg and de Bruyn2023).
The only other shifts detected in high-latitude Southern Hemisphere breeding phenology have been documented in seabirds. Peak laying dates of royal penguins at Macquarie Island moved to, on average, 2.1 days later between 1960 and 1990, where low-SAM years resulted in delayed laying dates (Hindell et al. Reference Hindell, Bradshaw, Brook, Fordham, Kerry, Hull and McMahon2012). In other seabird species, later laying dates were related to low sea ice and lower spring productivity (Barbraud & Weimerskirch Reference Barbraud and Weimerskirch2006). As food becomes scarcer, the birds are breeding later, presumably because they need to reach a threshold condition before breeding. A similar mechanism could be at play with the elephant seals, who also require an minimum mass to breed (Laws Reference Laws1956), with cows staying at sea longer to increase condition prior to breeding. However, it is important to note that elephant seal phenology at Marion Island did not change over 30 years of monitoring (Oosthuizen et al. Reference Oosthuizen, Pistorius, Bester, Altwegg and de Bruyn2023).
Long-term trends in cow numbers
The elephant seal population at the Macquarie Island ISA has decreased at a rate of 1.1% year−1 since it was first censused in 1949. We found that the change in numbers of cows within the ISA was correlated with the island’s total population. Therefore, the Macquarie Island southern elephant seal population can be effectively monitored through regular census of the ISA (Fig. S1).

Figure 4. The utilization distribution of 70 female southern elephant seals (Mirounga leonina) tracked from Macquarie Island during the post-moult winter period (March–October), showing the spatial extent across the southern Pacific Ocean where seals feed. The data are expressed as the number of seal days per 50 × 50 km grid (Harcourt et al. Reference Harcourt, Hindell, McMahon, Goetz, Charrassin and Heerah2021). The regions with the highest usage (defined as the 80% contour of the utilization distribution are outlined in pink. The tracking data were processed after Hindell et al. (Reference Hindell, McMahon, Guinet, Harcourt, Jonsen, Raymond and Maschette2022). The major frontal zones (Orsi et al. Reference Orsi, Whitworth and Nowlin1995) are indicated with dashed lines (ACC = Antarctic Circumpolar Current; APF = Antarctic Polar Front; sACC = southern boundary of the Antarctic Circumpolar Current; SAF = Sub-Antarctic Front; STF = Sub-Tropical Front). The red line indicates the position of the −1000 m isobath. Tracking data are from Hindell et al. (Reference Hindell, Sumner, Bestley, Wotherspoon, Harcourt and Lea2017), with two additional individuals included from recent tracking work in 2023.
In contrast to this continued decrease in numbers at Macquarie Island (south-west Pacific Ocean), the Iles Kerguelen (southern Indian Ocean) population, which also experienced decreases from the 1950s to the 1990s, has recently increased in numbers (Laborie et al. Reference Laborie, Authier, Chaigne, Delord, Weimerskirch and Guinet2023), and the South Georgia (south Atlantic Ocean) population is thought to have been stable since it was last censused in 1996 (Boyd et al. Reference Boyd, Walker and Poncet1996). Hindell et al. (Reference Hindell, Sumner, Bestley, Wotherspoon, Harcourt and Lea2017) suggested that regional changes in prey availability/quality within specific foraging ranges might explain those regional differences in elephant seal population trajectories. Applying that hypothesis to the three main elephant seal populations suggests that prey availability to cows has been stable in the south Atlantic Ocean sector, has fluctuated between poor and good within the southern Indian Ocean sector and has been decreasing in the south-west Pacific Ocean region. This is puzzling given that the mid- to high-latitude frontal zones of the Antarctic Circumpolar Current (ACC) are favoured foraging habitats of female southern elephant seals (Hindell et al. Reference Hindell, Sumner, Bestley, Wotherspoon, Harcourt and Lea2017), and the ACC is the world’s most powerful current, which flows west to east around the Antarctic continent, connecting all of the world’s oceans. As such, the ACC will have large-scale influences across all of the ocean basins, which may in turn dampen/mitigate more regional differences (Rintoul et al. Reference Rintoul, Hughes and Olbers2001). Other factors that may influence elephant seal population change, such as predation and competition with commercial fisheries and emigration, have been discounted for Macquarie Island (McMahon et al. Reference McMahon, Bester, Burton, Hindell and Bradshaw2005), even though they may play a role elsewhere (Pistorius et al. Reference Pistorius, de Bruyn and Bester2011).
Our results show that the mortality of female southern elephant seals from Macquarie Island has consistently exceeded recruitment into the breeding population. Tracking data collated across southern elephant seal breeding locations showed elephant seal cows from Macquarie Island use multiple core foraging areas within the southern Pacific Ocean (Bradshaw et al. Reference Bradshaw, Hindell, Sumner and Michael2004). The average rate of decrease for cows at Macquarie Island is small (~1% year−1), and, given the individual fidelity to feeding grounds (Bradshaw et al. Reference Bradshaw, Hindell, Sumner and Michael2004), we suggest that only a small proportion of the total female foraging area needs to have changed to produce the observed decrease (Hindell et al. Reference Hindell, Sumner, Bestley, Wotherspoon, Harcourt and Lea2017).
Differences in weaning mass have been correlated with population growth rates of elephant seals, with higher weaning masses associated with increasing populations and lower weaning masses associated with decreases in population size (Burton et al. Reference Burton, Arnbom, Boyd, Bester, Vergani, Wilkinson, Battaglia, Valencia and Walton1997). However, paradoxically, the weaning mass for the increasing Iles Kerguelen population (Laborie et al. Reference Laborie, Authier, Chaigne, Delord, Weimerskirch and Guinet2023) is lower (~102 kg; Mestre et al. Reference Mestre, Authier, Cherel, Harcourt, McMahon and Hindell2020) than that recorded at Macquarie Island (~135 kg; Clausius et al. Reference Clausius, McMahon and Hindell2017a) with a continuous decrease in cow numbers. The post-breeding cows from Macquarie Island range widely through the southern Indian and Pacific oceans, including along the Antarctic Continental Shelf (Fig. 4). This observation supports our hypothesis (Hindell et al. Reference Hindell, Sumner, Bestley, Wotherspoon, Harcourt and Lea2017) that the bulk of the Macquarie Island population is foraging successfully (hence the relatively high overall weaning masses), but that a small proportion of the population within a distinct foraging area is foraging less successfully, leading to the small but sustained decrease in total numbers. This could represent the subset of females that feed along the Antarctic Continental Shelf, and that increases in sea ice, restricting access to the shelf, may contribute to the overall population decrease (Hindell et al. Reference Hindell, Sumner, Bestley, Wotherspoon, Harcourt and Lea2017).
Inter-annual variability in cow numbers
Typically, elephant seal cows breed annually; however, individual cows do sometimes skip breeding, and the probability of skipping is higher in poor foraging years (Desprez et al. Reference Desprez, Gimenez, McMahon, Hindell and Harcourt2018). Delayed blastocyst implantation in mammals (Renfree & Shaw Reference Renfree and Shaw2000, Burgin et al. Reference Burgin, Colella, Kahn and Upham2018) is thought to ensure a synchronous birth pulse that allows both cows and weaned pups to take maximum advantage of the summer increase in prey density and quality in the SO (Sandell Reference Sandell1990). Delayed implantation may also allow cows to control when they breed, choosing not to in instances at which maternal body condition fails to reach a critical threshold during the post-breeding foraging period (Boyd Reference Boyd1984, Arnbom et al. Reference Arnbom, Fedak and Boyd1997). In such cases, the blastocyst may be resorbed at little cost to the female. We found no relationship between the inter-annual variability in numbers of cows ashore within the ISA at Macquarie Island and a zonally averaged index of Southern Hemisphere circumpolar environmental variability (the SAM) in the preceding summer months, even after allowing for multi-year lags. This suggests that environmental variability during the post-breeding (summer) foraging period had no detectable influence on blastocyst implantation, and therefore the propensity for cows to return in successive years.
Overwinter foraging success of cows from Macquarie Island has been linked to the SAM both in the year of breeding and 3 years earlier (van den Hoff et al. Reference van den Hoff, McMahon, Simpkins, Hindell, Alderman and Burton2014), suggesting that maternal foraging success influences the variability in the numbers of cows ashore in any year through increases/decreases in pup survival and the subsequent recruitment of cows into the breeding population (van den Hoff et al. Reference van den Hoff, McMahon, Simpkins, Hindell, Alderman and Burton2014, Clausius et al. Reference Clausius, McMahon, Harcourt and Hindell2017b, McMahon et al. Reference McMahon, Harcourt, Burton, Daniel and Hindell2017). Given that the SAM is positively correlated with sea-ice extent in the region where a subset of the Macquarie Island cows feed over winter from June to November (Schroeter et al. Reference Schroeter, O'Kane and Sandery2023), exclusion of cows from the productive Antarctic shelf waters may reduce their overwinter foraging success and the future mass of their weaned pups (Hindell et al. Reference Hindell, Sumner, Bestley, Wotherspoon, Harcourt and Lea2017). These relationships appear to differ regionally, with the SAM having little influence on the weaning mass of elephant seals at Marion Island, where chlorophyll a concentration was a better predictor (Oosthuizen et al. Reference Oosthuizen, Bester, Altwegg, McIntyre and de Bruyn2015). These differences are probably due to the different foraging distributions between the populations, with Marion Island seals remaining north of the winter sea-ice zone. This hypothesis could be tested due to the fact that, with the recent rapid decrease in sea-ice extent throughout the SO (Purich & Doddridge Reference Purich and Doddridge2023), the shelf-feeding cows from Macquarie would now have increased access to the continental shelf, thereby leading to a reduction in the rate of decrease in that population. Ongoing monitoring of the population, coupled with new tracking studies, will be required to test this hypothesis.
Dedication
We dedicate this paper to the memory of Harry Burton, a visionary and pioneer in Antarctic science. Harry’s research built the foundation on which much of what we know about southern elephant seals and, more broadly, pack- and fast-ice seal population behaviour and structure. Harry’s research defines much of what we do today and will continue to do so well into the future.
Supplementary material
To view supplementary material for this article, please visit http://doi.org/10.1017/S0954102025000161.
Acknowledgements
We thank the many expeditioners and researchers at Macquarie Island from 1949 to 2023 for their dedication to counting seals. The Australian Antarctic Division (AAD) through the Australian National Antarctic Research Expeditions (ANARE) supported this research. The study was carried out at Macquarie Island under Australian Antarctic Animal Ethics Committee (AAS 2265 and AAS 2794) and the Tasmania Parks and Wildlife Service ethics approvals. The seal tracking data were sourced from the Integrated Marine Observing System (IMOS) and the Australian Research Council (ARC) Discovery Programme DP180101667 and the ARC Special Research Initiative SR200100008 (under AAS 4630). IMOS is supported by the Australian Government through the National Collaborative Research Infrastructure Strategy. Logistics to Macquarie Island were provided by the AAD.
Author contributions
Conceptualization and manuscript writing: MAH, CRM, JvdH. Data collection: MAH, CRM, JvdH, ST. Data analysis: MAH, CRM, JvdH, SW. Manuscript reviewing: MAH, CRM, JvdH, ST, KC, SW.
Competing interests
The authors declare none.


 Open access