


Introduction
The coastal regions of the Antarctic Peninsula exhibit unique features: low sea-surface temperatures, long periods without sunlight, well-defined seasonality and extensive sea-ice cover for most of the year. These characteristics define a region that plays a crucial role in global climate regulation, ocean circulation and carbon sequestration (Stein et al. Reference Stein, Timmermann, Kwon and Friedrich2020, Wu et al. Reference Wu, Lembke-Jene, Lamy, Arz, Nowaczyk and Xiao2021). In recent decades, the Antarctic Peninsula has experienced accelerated warming (e.g. Mulvaney et al. Reference Mulvaney, Abram, Hindmarsh, Arrowsmith, Fleet and Triest2012, Naughten et al. Reference Naughten, Holland and De Rydt2023), with a new temperature record of 18.3°C set in February 2020 at the Argentine Esperanza Station, marking the highest recorded temperature for the Antarctic region (Francelino et al. Reference Francelino, Schaefer, de Los Milagros Skansi, Colwell, Bromwich and Jones2021). In addition, anomalous high temperatures were recorded throughout the summer of 2019/2020, leading to ice melting and the exposure of new ice-free areas (Robinson et al. Reference Robinson, Klekociuk, King, Pizarro Rojas, Zúñiga and Bergstrom2020).
In addition to interannual variations, short-term temperature fluctuations also occur. During the summer, particularly from January to March, increased solar radiation and milder temperatures cause snow and ice to melt from glaciers and land surfaces. The resulting meltwater runoff forms a fresher water lens on the sea surface, with salinity averaging ~33.2 (Dierssen et al. Reference Dierssen, Smith and Vernet2002). Therefore, these changes in late summer lead to dynamic fluctuations in physicochemical water parameters, including salinity, temperature, pH and suspended particulate matter (SPM). Such variations significantly impact marine ecosystems by influencing phytoplankton productivity, species distribution and the cycling of nutrients and contaminants (Casal et al. Reference Casal, Cabrerizo, Vila-Costa, Pizarro, Jiménez and Dachs2018, Lange et al. Reference Lange, Ligowski and Tenenbaum2018, Neder et al. Reference Neder, Fofonova, Androsov, Kuznetsov, Abele and Falk2022).
Several studies have assessed the temperature and salinity of the water column in Admiralty Bay, located at King George Island, Antarctic Peninsula, aiming to correlate them with nutrient levels and phytoplankton dynamics (e.g. Lange et al. Reference Lange, Tenenbaum, De Santis Braga and Campos2007, Cascaes et al. Reference Cascaes, de Albergaria-Barbosa, de Freitas, Colabuono, da Silva and Patire2011, Lima et al. Reference Lima, Moser, Piedras, da Cunha, Tenenbaum and Tenório2019). Interannual differences were observed with higher temperatures at the end of the summer, while salinity exhibited little variation (Lange et al. Reference Lange, Tenenbaum, De Santis Braga and Campos2007, Lima et al. Reference Lima, Moser, Piedras, da Cunha, Tenenbaum and Tenório2019). Additionally, Scigliano et al. (Reference Scigliano, da Rosa, Bastos and Braga2014) studied the sediment dispersion patterns in the frontal sectors of two glaciers, including correlations with temperature and salinity. They identified SPM as being associated with glacial erosion, meltwater input from the glacier front and glaciomarine circulation in the region. SPM concentrations have also been shown to vary in response to rainfall, storms and wind-driven resuspension due to increased freshwater discharge and sediment mobilization from the fjord floor (Pichlmaier et al. Reference Pichlmaier, Aquino, Da-Silva and Braun2004). However, so far, no study has specifically addressed the temporal variations in the physicochemical parameters of the water, considering the increasing temperatures throughout the summer and including all inlets (Mackellar, Ezcurra and Martel) of Admiralty Bay. This information is key to understanding the changes occurring in this coastal region, and it could offer insights into local responses to global environmental changes.
Therefore, this study aimed to evaluate the physicochemical parameters (temperature, salinity, pH and SPM) in surface water samples from Admiralty Bay during the summers of 2019/2020 and 2022/2023 in order to 1) comprehend the impacts of anomalously high temperatures during the summer of 2019/2020 on these water parameters by comparing data from different years, 2) verify the influence of rapid temperature fluctuations on the water column by evaluating results obtained during different periods of the summer of 2022/2023 and 3) identify the sources of SPM in Admiralty Bay by correlating atmospheric data with water column data. This research aims to contribute to a deeper understanding of the Antarctic coastal environmental dynamics during the rapid changes that occur throughout the summer.
Study area
Located near the northern part of the Antarctic Peninsula, Admiralty Bay lies on King George Island, the largest island in the South Shetland archipelago. The milder temperatures and proximity to South America provide favourable conditions for establishing scientific stations and the development of tourism, which are the main anthropogenic activities in Admiralty Bay (Olalla et al. Reference Olalla, Moreno and Valcárcel2020, Wu et al. Reference Wu, Chen, Yuan, Kang and Xie2020). The area hosts research stations operated by Brazil (Comandante Ferraz Antarctic Station; EACF), Poland (Henryk Arctowski Antarctic Station) and Peru (Machu Picchu Research Station), as well as scientific refuges from Ecuador (Republic of Ecuador Refuge) and the USA (Captain Pieter J. Lenie Base; Campos et al. Reference Campos, Montone, Moura, Verde and di Prisco2013).
The bay covers an area of 131 km2 and has a maximum depth of 600 m. It is divided by Mackellar and Martel inlets in its north-north-east section, while the Ezcurra Inlet lies to the south-west. It is connected to Bransfield Strait by a U-shaped channel, which is a characteristic of fjord regions. The tidal range in Admiralty Bay averages ~1.4 m, with a maximum of 2.1 m (Rakusa-Suszczewski Reference Rakusa-Suszczewski1980, Campos et al. Reference Campos, Montone, Moura, Verde and di Prisco2013).
The region’s water circulation patterns are influenced by tides, winds, bottom morphology, ice melt and exchange with Bransfield Strait waters (Robakiewicz & Rakusa-Suszczewski Reference Robakiewicz and Rakusa-Suszczewski1999, Campos et al. Reference Campos, Montone, Moura, Verde and di Prisco2013, Zhou et al. Reference Zhou, Zhu and Hu2020). Water entering the Bransfield Strait flows in from the west coast and out from the east coast, with a residence time of ~147 h (Zhou et al. Reference Zhou, Zhu and Hu2020); the currents in the centre of the bay are stronger than in the inlets (Campos et al. Reference Campos, Montone, Moura, Verde and di Prisco2013), and the greatest current speeds are observed at the western entrance of the bay due to the local bathymetry (Robakiewicz & Rakusa-Suszczewski Reference Robakiewicz and Rakusa-Suszczewski1999).
The major sources of suspended sediment in the bay are continental freshwater inputs, both subsurface from glacial melting and surface from snowmelt, as well as wind-driven resuspension of material previously deposited on the bottom, especially in the inner bays (Pichlmaier et al. Reference Pichlmaier, Aquino, Da-Silva and Braun2004).
Materials and methods
Sampling was divided into two phases and conducted as part of the Brazilian Antarctic Program. The schedule was adjusted, resulting in a gap between the 2020 and 2023 field activities due to restrictions imposed by the COVID-19 pandemic. The first step included one sampling campaign during the XXXLVIII Antarctic Expedition in the summer of 2019/2020 (January 2020). The second step was carried out during the XLI Antarctic Expedition in the summer of 2022/2023 and included five campaigns. The instantaneous nature of the sample represents an advantage for evaluating changes that occur on short timescales (Dauner & Martins Reference Dauner and Martins2015). This enabled the temporal evaluation of the parameters over five periods, starting in November 2022 during the spring and concluding in March 2023 at the end of the summer. Sixteen sampling sites were selected, including all of the inlets of Admiralty Bay (Mackellar, Martel and Ezcurra), allowing a comprehensive assessment of the entire bay (Fig. 1). Sampling was conducted at sites of ~30 m depth to maintain a similar pattern between periods (Table S1). Simultaneously with the water sampling, the water column parameters (salinity, temperature and pH) were measured using multi-parameter probes (HANNA® instruments).
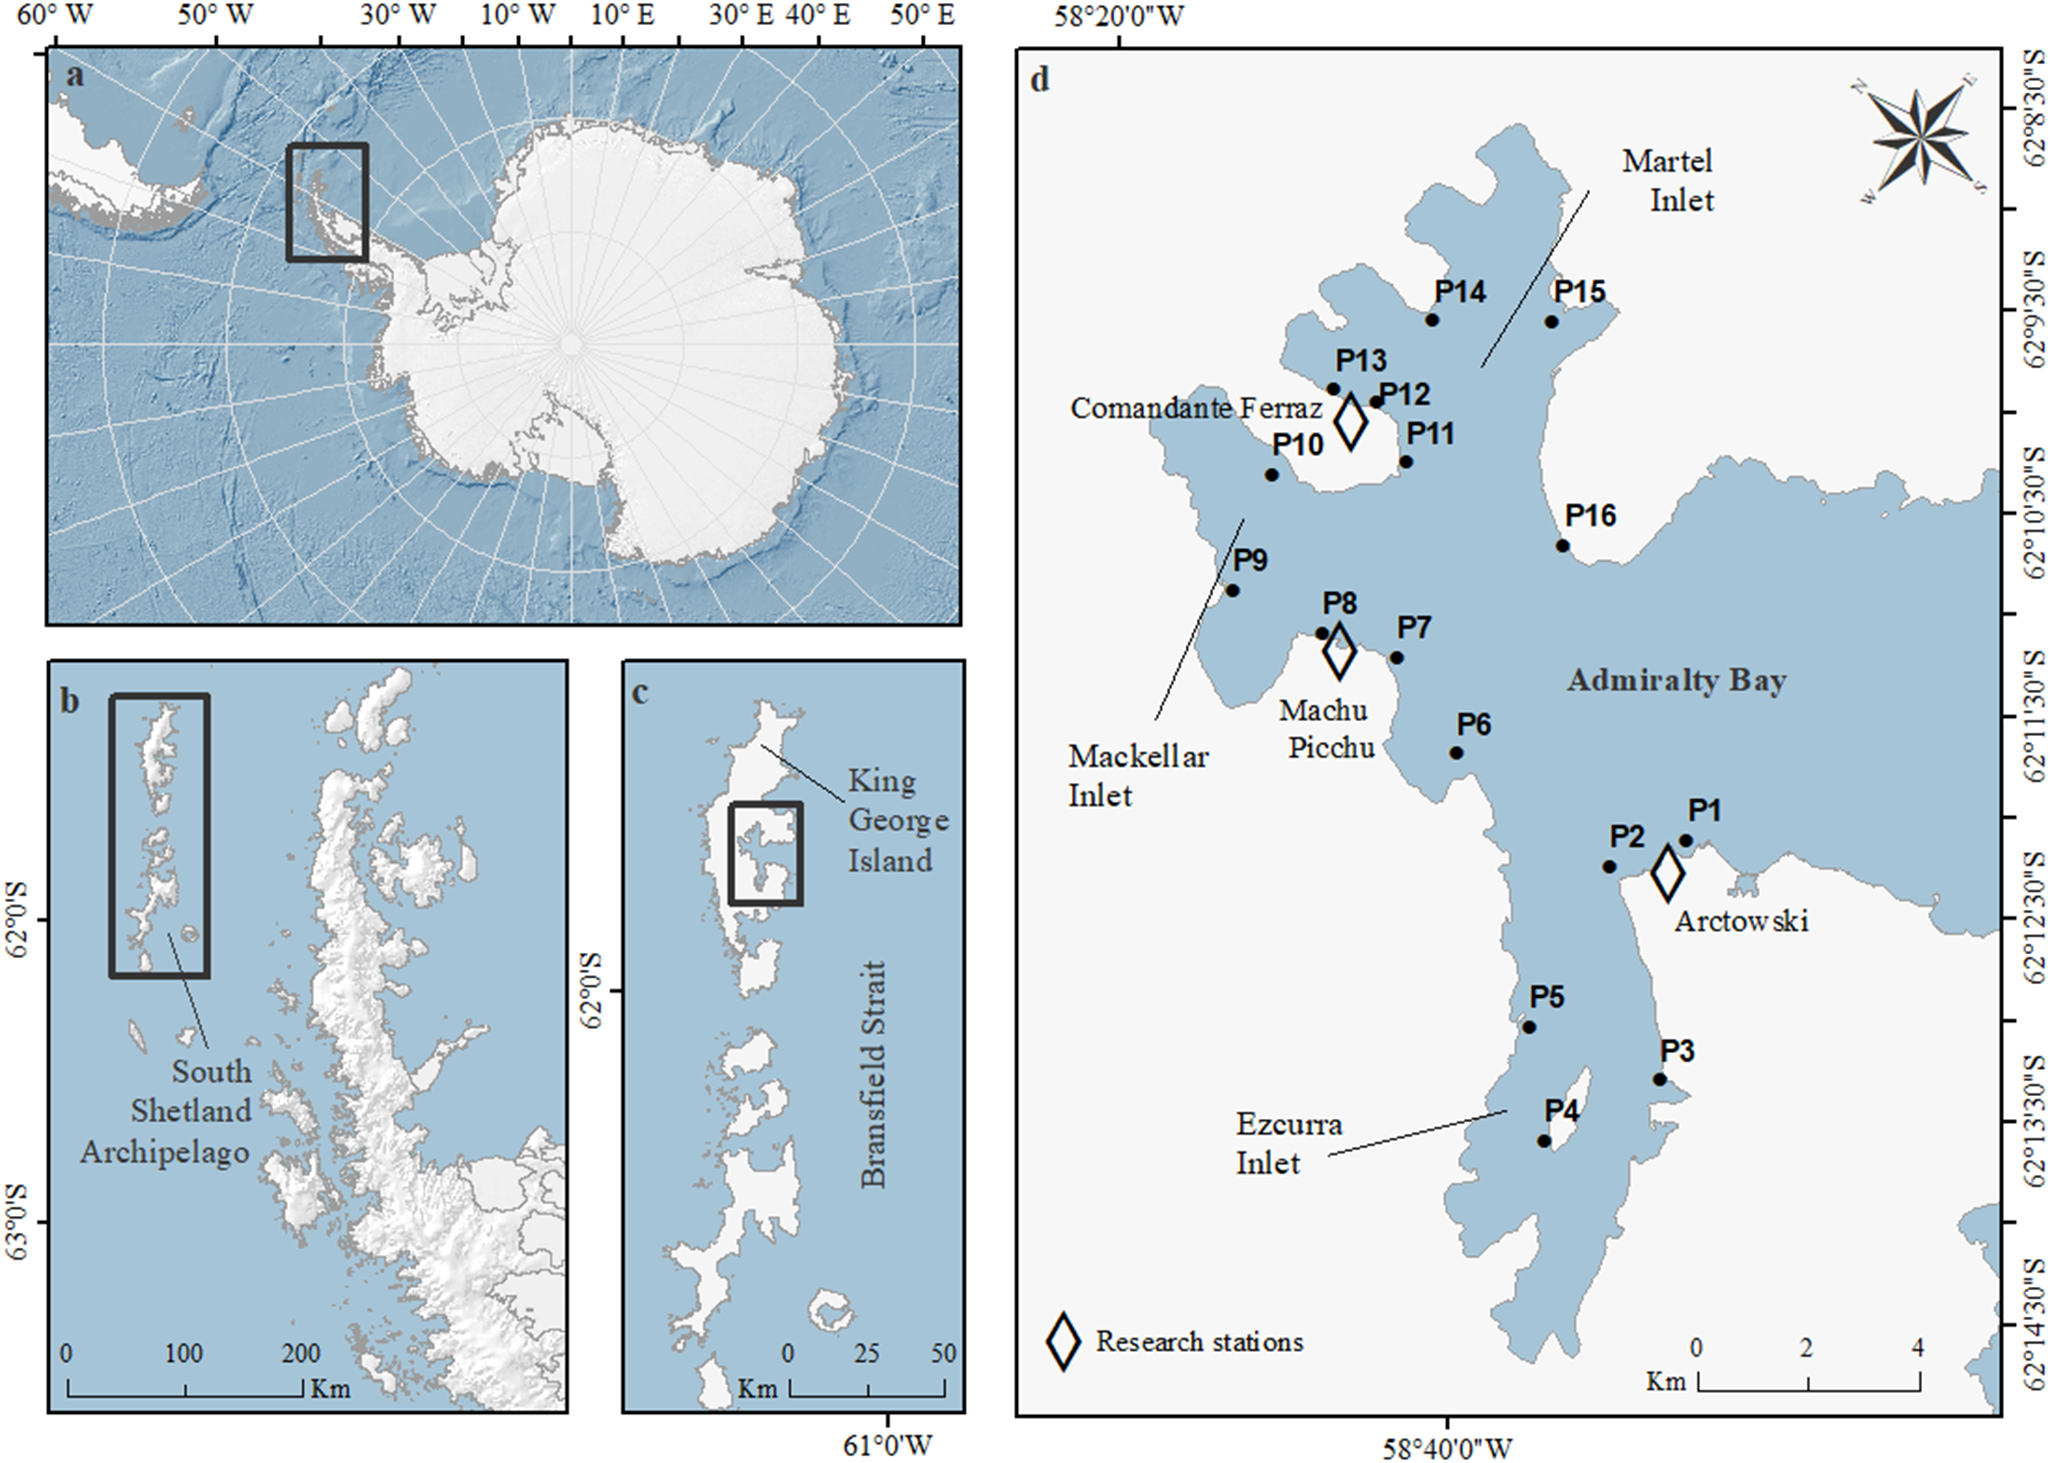
Figure 1. Location of Admiralty Bay, King George Island, Antarctic Peninsula, and the sampling stations of the Antarctic Expeditions XXXVIII and XLI: a. Antarctica, b. Antarctic Peninsula, c. South Shetland archipelago and d. Admiralty Bay. Image created with Quantarctica version 3.2 (Matsuoka et al. Reference Matsuoka, Skoglund, Roth, De Pomereu, Griffiths and Headland2018).
Approximately 20 l of water were sampled at a depth of 1 m using amber glass bottles. Samples were vacuum filtered through pre-weighed GF/F Whatman® (0.7 μm) filters previously calcined at 450°C for 4 h. The filters were then freeze-dried and reweighed to determine the SPM using a gravimetric method. SPM concentrations were reported in mg l-1. Control filters (unused filters) were weighed to account for any impurities.
For complementary analyses, meteorological data from November 2022 to March 2023 were obtained from the National Institute of Meteorology (INMET) portal (https://mapas.inmet.gov.br/#; INMET 2023). These data are from the Comandante Ferraz meteorological station (I891; coordinates: -62.09, -58.39), operated by the National Institute for Space Research (INPE). Daily averages were calculated based on hourly measurements collected by automated sensors. The selected parameters included atmospheric temperature (°C), relative humidity (%), wind speed (m s-1) and direction, solar radiation (kJ m-2) and rainfall (mm).
All maps were generated with the ArcGIS version 10.4.1 program using Quantarctica version 3.2 (Matsuoka et al. Reference Matsuoka, Skoglund, Roth, De Pomereu, Griffiths and Headland2018). Statistical analyses and graphs were made using the R statistical software (R Core Team 2021). Non-parametric unpaired Kruskal-Wallis H-tests were performed to determine significant differences between sampling campaigns (P < 0.05). Dunn’s multiple comparison test was used as a post hoc test, and P-values were adjusted for multiple comparisons using the sequential Bonferroni correction. A cluster analysis was performed using Ward’s method and the Euclidean similarity index of the physicochemical parameters of the seawater (temperature, salinity, pH and SPM) standardized (x - μ/σ) to evaluate differences between the three inlets of Admiralty Bay. The atmospheric data from INMET for the 3 days preceding the sampling were used for Spearman correlation analysis and principal component analysis (PCA). These 3 days were chosen because they represent approximately half of the water residence time in Admiralty Bay (~147 h; Zhou et al. Reference Zhou, Zhu and Hu2020). As atmospheric processes are more dynamic, their responses occur more quickly than in the water column. Spearman correlation analysis was used for non-parametric data to investigate possible relationships between atmospheric conditions and the water column. The PCA was performed on wind speed, salinity, SPM and temperature values during the summer of 2022/2023 to identify the major sources of SPM into the bay.
Results
Values of temperature, salinity, pH and SPM in Admiralty Bay
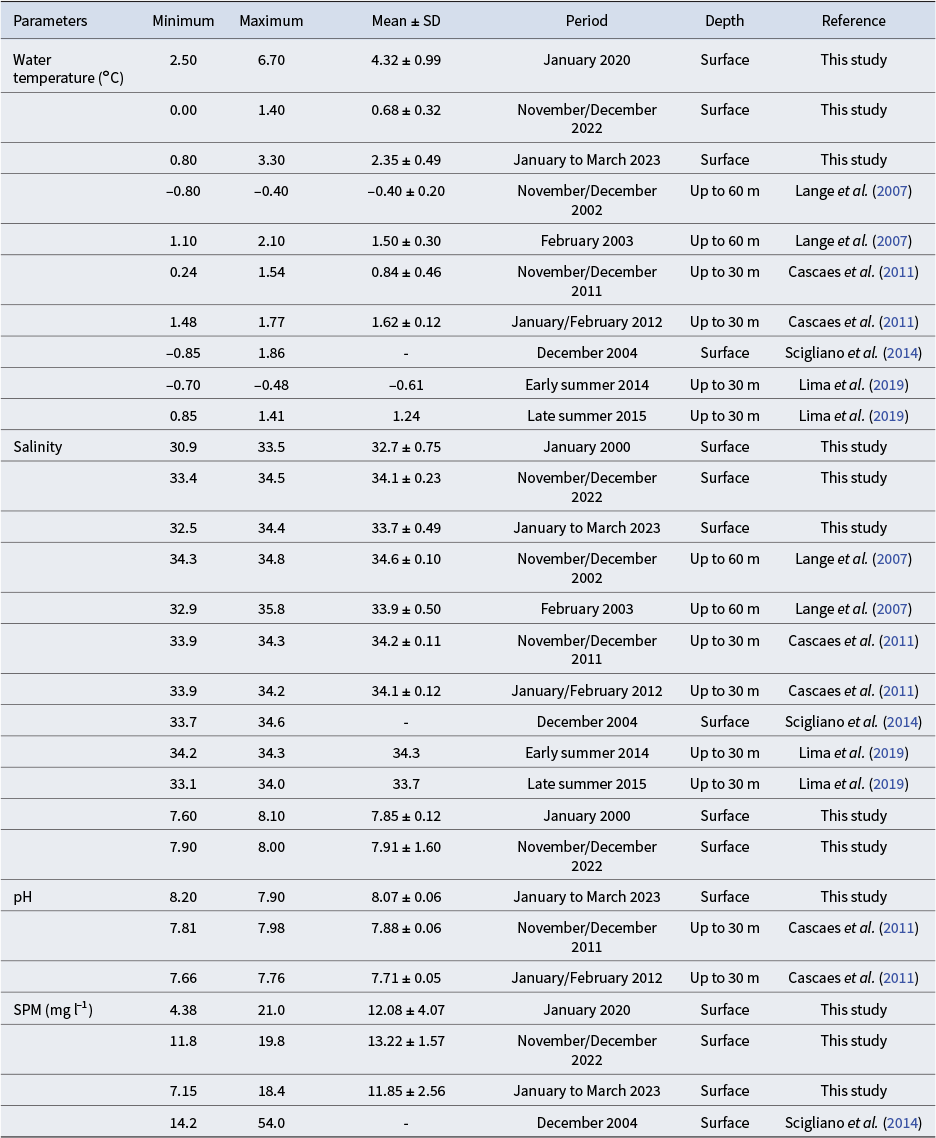
The mean, standard deviation, maximum and minimum temperature, salinity and SPM values obtained in January 2020 and from November 2022 to March 2023, as well as comparisons with values obtained during previous studies in Admiralty Bay, are shown in Table I. The sea-surface temperature, salinity, pH and concentration of SPM ranged from 2.50°C to 6.70°C (mean ± standard deviation = 4.32°C ± 0.99°C), from 30.9 to 34.0 (32.70 ± 0.75), from 7.6 to 8.1 (7.80 ± 0.12) and from 4.28 to 21.05 mg l-1 (12.08 ± 4.07 mg l-1), respectively, in January 2020. The SPM concentrations in November and December 2022 and from January to March 2023 varied between 11.8 to 19.8 mg l-1 (13.22 ± 1.57 mg l-1) and 7.15 to 18.40 mg l-1 (11.85 ± 2.56 mg l-1), respectively.
Table I. Maximum and minimum values, mean and standard deviation (SD) of sea-surface temperature, salinity and suspended particulate matter (SPM) of Admiralty Bay, King George Island, Antarctic Peninsula.
Results from the Kruskal-Wallis non-parametric test, followed by Dunn’s post hoc test, indicated significant statistical differences in temperature and salinity between January 2020 and the months of the summer of 2022/2023, except for February 2023, which showed P-values of 0.078 and 0.057 for temperature and salinity, respectively (Tables S2 & S3). Temperature values in January 2020 were higher than those observed in January 2023 (Fig. 2a & Table S2), whereas salinity values were lower (Fig. 2b & Table S3). During the summer months of 2022/2023, the temperature was significantly higher from January to March 2023 compared to November and December 2022 (Fig. 2a & Table S2). Salinity was significantly lower only in February 2023 (Fig. 2b & Table S3) and showed greater variability towards the end of the summer, from January to March (Fig. 2B). Only the March 2023 campaign showed significant differences in SPM values (Fig. 2c & Table S4). pH values in January 2020 differed significantly from those in January to March 2023 (Fig. 2d & Table S5), with January 2020 presenting the minimum pH value (7.6), whereas pH in the summer of 2022/2023 varied between 7.9 and 8.2 (8.00 ± 0.09; Fig. 2d).
Spatial evaluation of temperature, salinity, pH and SPM
In January 2020, fluctuations among the sampling sites were observed, with there being no general division between the different inlets. However, the highest temperature (Fig. 3a) and highest salinity were recorded in the Ezcurra Inlet and at the central sites of the bay (Fig. 3b), respectively. The highest concentrations of SPM coincided with the lowest salinity values in the Mackellar Inlet (Fig. 3b,c).
In November and December 2022, despite only a ~1°C temperature variation, a clear distinction was observed between the eastern and western portions of the bay, with lower values recorded in Martel Inlet and the innermost sites of Mackellar Inlet (Figs S1A & S2A). The lower salinity values were also associated with lower temperatures (Figs S1B & S2B). SPM’s highest concentrations coincided with the lowest salinity values (Figs S1C & S2C). Site P5 is notable for having high SPM values in both sampling campaigns.
In January 2022, the Mackellar Inlet exhibited the highest SPM concentrations, aligning with the lowest salinity and temperature values (Fig. S3). The temperature in the Martel Inlet, which was lowest in the first few months of the study, showed the highest values across the bay (Fig. S3A). In addition, the Martel and Mackellar inlets were distinguished from the Ezcurra Inlet, primarily based on their salinity and SPM values (Fig. S3B,C).
In February 2023, the lowest temperature and salinity and the highest SPM values were recorded in the Mackellar Inlet (Fig. S4), following the pattern observed in previous periods. In March 2023, this pattern continued at site P10 in the Mackellar Inlet (Fig. S5). This inlet had low salinity and a high concentration of SPM in all of the sampling periods (Fig. 4). However, there was no significant clustering among the three analysed inlets considering the dataset as a whole (Fig. S6) and the data evaluated for each sampling campaign (Figs S7–S12).

Figure 2. Boxplots of a. temperature (°C), b. salinity, c. suspended particulate matter (SPM; mg l-1) and d. pH in the water column of Admiralty Bay, Antarctic Peninsula, during the 2019/2020 and 2022/2023 summer campaigns.
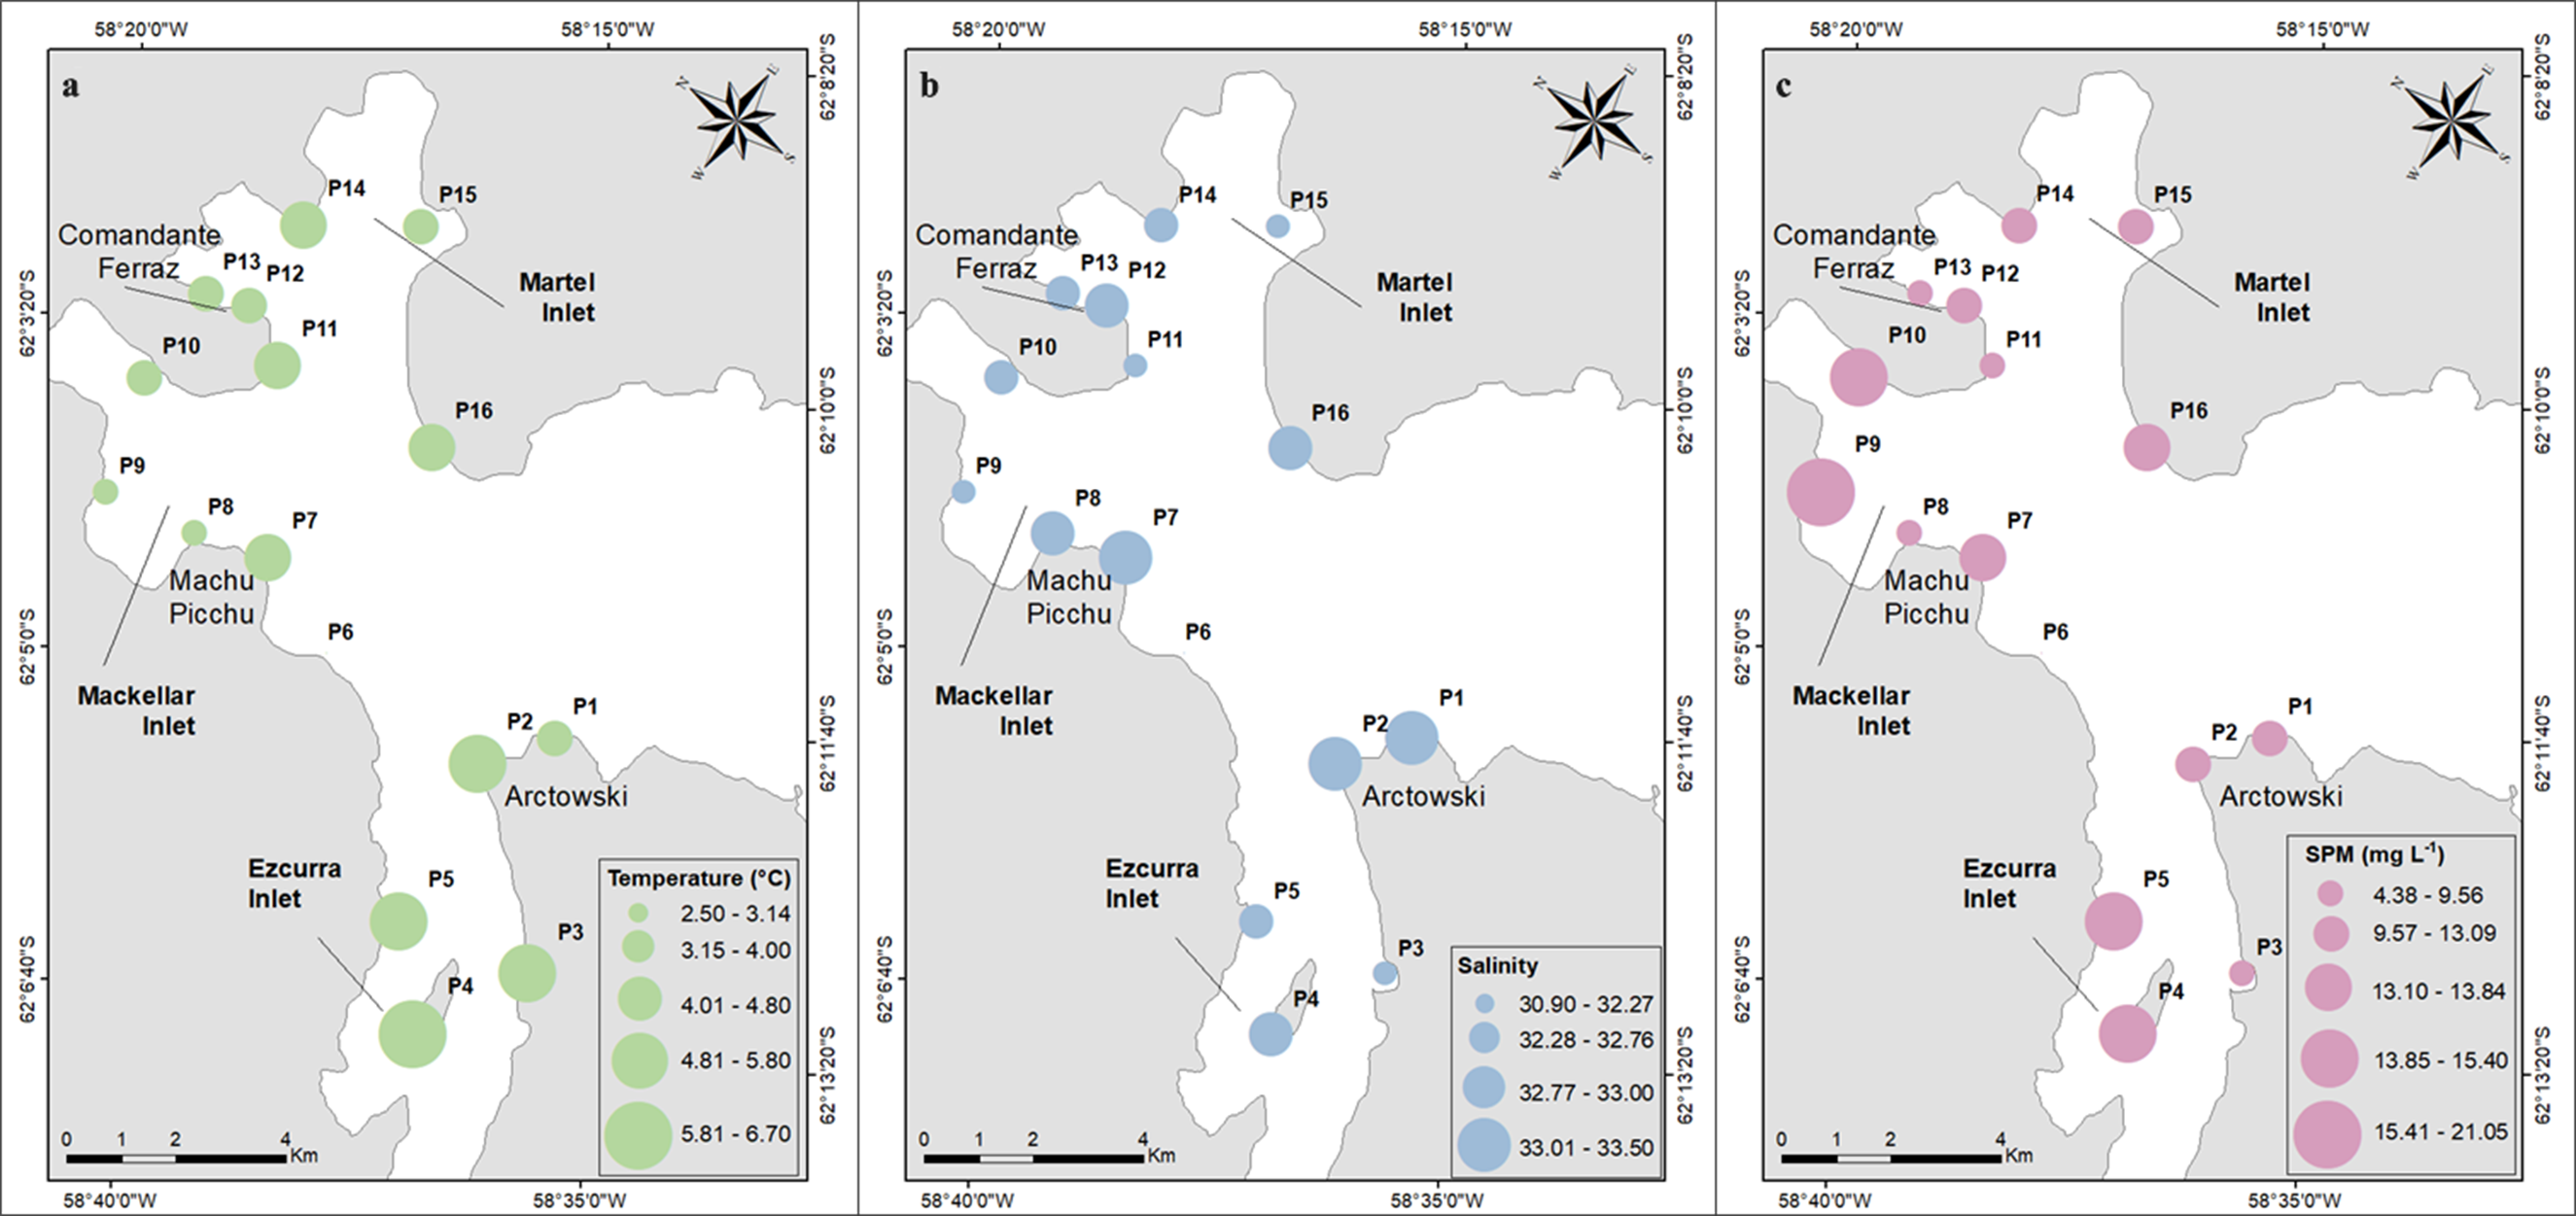
Figure 3. Spatial distribution of a. temperature (°C), b. salinity and c. suspended particulate matter (SPM; mg l-1) in the surface water of Admiralty Bay, King George Island, Antarctic Peninsula, in January 2020.
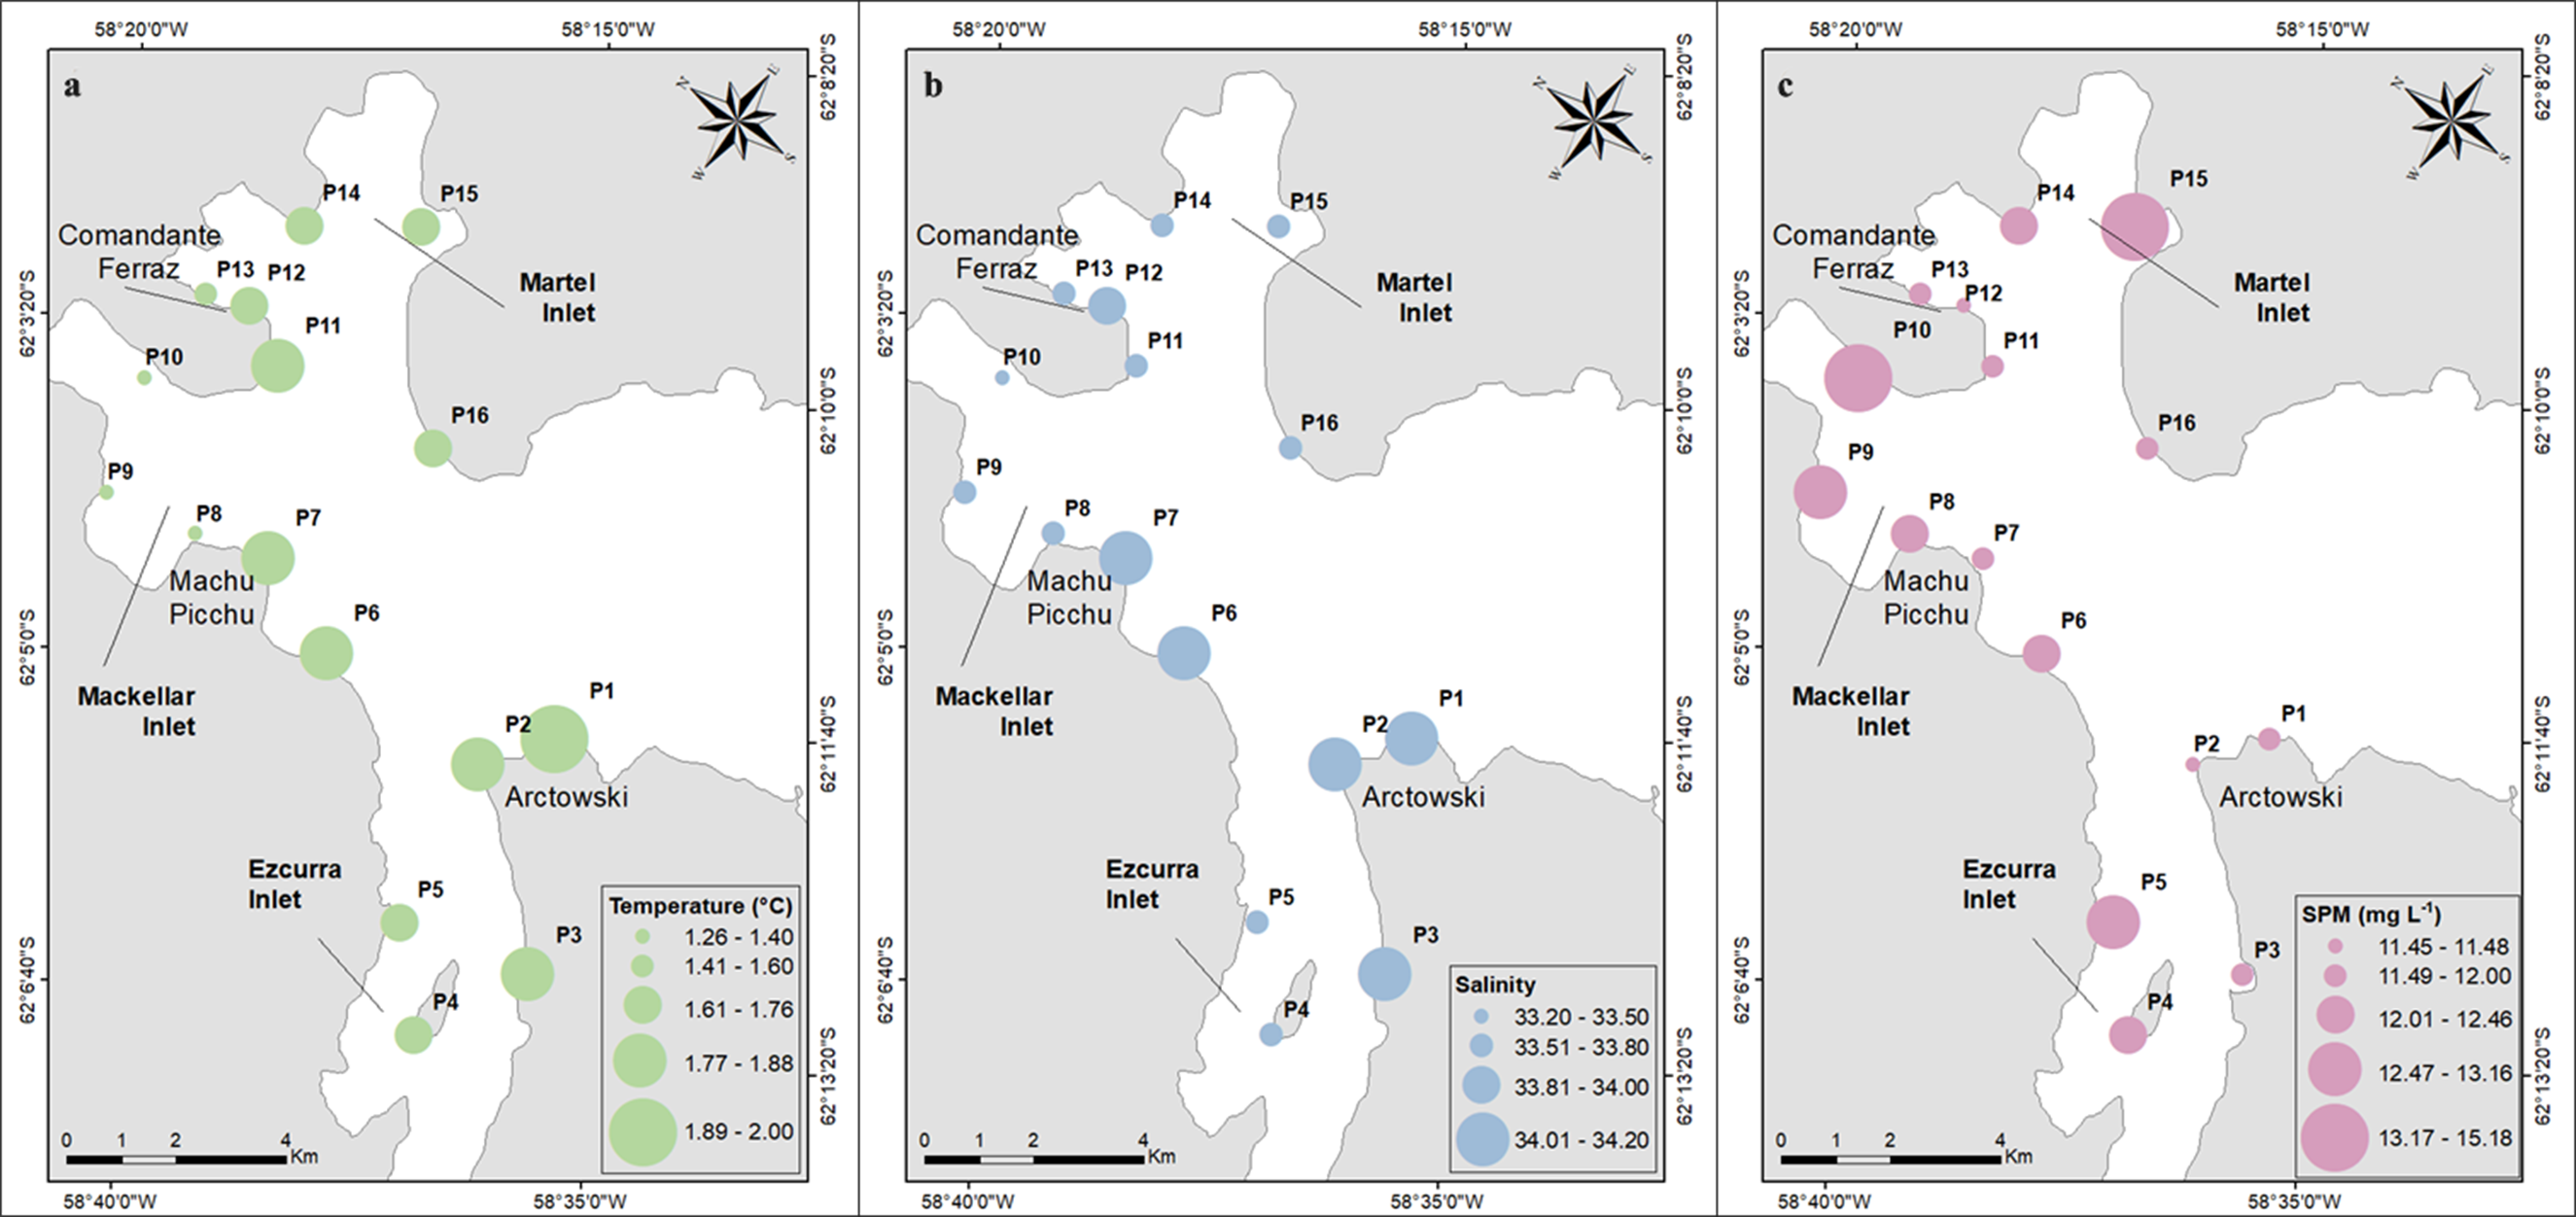
Figure 4. Spatial distribution of a. temperature (°C), b. salinity and c. suspended particulate matter (SPM; mg l-1) in the surface water of Admiralty Bay, King George Island, Antarctic Peninsula; mean of five campaigns in summer 2022/2023.
Integration between water and atmospheric parameters during the summer of 2022/2023
The results of the Spearman correlation analysis are shown in Fig. S13. Among the water column parameters, temperature showed a strong negative correlation with wind direction (P < 0.05 and r s > 0.7) and a moderate negative correlation with wind speed and radiation (P < 0.05 and 0.5 < r s < 0.7). Wind data were also correlated with air temperature. Salinity showed a moderate negative correlation with wind direction. Finally, SPM showed a moderate positive correlation with wind speed and a negative correlation with atmospheric temperature; however, the results did not show an association with a particular wind direction.
The first principal component of the PCA explained 50% of the data and was associated with temperature and wind speed (Fig. 5b). It also showed a positive correlation with SPM. The second principal component, which explained 31% of the variance, showed a relationship between salinity and SPM (Fig. 5c). As for the groups of months, there was a distinct separation between November/December and February/March, with January being the transition month.

Figure 5. Principal component (PC) analysis including water temperature, salinity, suspended particulate matter (SPM) and wind speed values from Admiralty Bay, Antarctic Peninsula, during the 2022/2023 summer campaigns. a. Scatter plot, b. loadings of PC1 and c. loadings of PC2.
Discussion
Temporal evaluation of temperature, salinity, pH and SPM
January 2020 in Admiralty Bay had distinct water temperature and salinity characteristics compared to the other years assessed (Tables I, S2 & S3). Temperature values in January 2020 were higher than the averages obtained in Admiralty Bay in previous years (1.5°C ± 0.3°C in 2003, Lange et al. Reference Lange, Tenenbaum, De Santis Braga and Campos2007; 1.6°C ± 0.1°C in 2012, Cascaes et al. Reference Cascaes, de Albergaria-Barbosa, de Freitas, Colabuono, da Silva and Patire2011; 1.24°C in 2015, Lima et al. 2019) and January 2023. Salinity was lower than the measures taken during the same period in 2006 (33.9 ± 0.5; Lange et al. Reference Lange, Tenenbaum, De Santis Braga and Campos2007), 2011 (34.1 ± 0.12; Cascaes et al. Reference Cascaes, de Albergaria-Barbosa, de Freitas, Colabuono, da Silva and Patire2011) and 2019 (33.7; Lima et al. 2019; Table I), as well as in the summer of 2022/2023. According to Banwell et al. (Reference Banwell, Tri Datta, Dell, Moussavi, Brucker and Picard2021), meltwater volumes on the Antarctic Peninsula began increasing rapidly by late December 2019, earlier than in previous years, corresponding to above-average air temperatures. The extent and duration of melting on the Antarctic Peninsula during this summer were the largest on record, with melting continuing from January to March 2020, driven by anticyclonic activity drawing warm air from the surrounding ice-free oceans and early and intense sudden stratospheric warming in September 2019 (Bevan et al. Reference Bevan, Luckman, Hendon and Wang2020). These anomalously high temperatures throughout the summer contributed to a season characterized by extensive melting across the Antarctic (Robinson et al. Reference Robinson, Klekociuk, King, Pizarro Rojas, Zúñiga and Bergstrom2020, González-Herrero et al. Reference González-Herrero, Barriopedro, Trigo, López-Bustins and Oliva2022). The increased meltwater influx diluted surface salinity, while elevated temperatures accelerated melting, disrupting typical seasonal water and salinity patterns.
Increased melting can also influence pH, with lower pH values usually indicating freshwater input (Park et al. Reference Park, Ahn, Sin, Shim and Kim2020, Qi et al. Reference Qi, Wu, Chen, Cai, Ouyang and Zhang2022). Besides the similar average observed in other years (8.00 ± 0.02 in January 2011 and 7.70 ± 0.05 in January 2012; Cascaes et al. Reference Cascaes, de Albergaria-Barbosa, de Freitas, Colabuono, da Silva and Patire2011), including those in the summer of 2022/2023, the minimum value was reported in 2020. In addition, it was also possible to observe greater variability in pH values in 2020, indicating that the atmospheric anomalies may have influenced this parameter (Fig. 2d).
SPM in the coastal Antarctic is generated by glacial melting and resuspension of sediments by wind-induced turbulence, benthic organisms and iceberg drift (Pichlmaier et al. Reference Pichlmaier, Aquino, Da-Silva and Braun2004, Schloss et al. Reference Schloss, Abele, Moreau, Demers, Bers, González and Ferreyra2012), especially in the inner areas of the bays, such as those analysed in this study. Higher temperatures increase freshwater inputs to the bay, which could have resulted in the higher concentration of SPM in 2020. However, the SPM values were consistent with those analysed in 2022/2023. Therefore, the temperature increase in 2020 did not necessarily lead to an increase in SPM concentration in Admiralty Bay. It is possible that the greater SPM input to the water column occurred post-sampling, when the high atmospheric temperature of 18.3°C was recorded in February 2020 (Francelino et al. Reference Francelino, Schaefer, de Los Milagros Skansi, Colwell, Bromwich and Jones2021).
SPM values in this study were similar to those detected in February 2000, which were ~11.0 mg l-1 (Pichlmaier et al. Reference Pichlmaier, Aquino, Da-Silva and Braun2004), but they were lower than those recorded in December 2004, which were 54.0 mg l-1 (Table I; Scigliano et al. Reference Scigliano, da Rosa, Bastos and Braga2014). In Potter Cove, King George Island, SPM concentrations remained highly variable, and no significant trends were evident in a 19 year analysis (Schloss et al. Reference Schloss, Abele, Moreau, Demers, Bers, González and Ferreyra2012). While the available data show variability in SPM concentrations over time, the impact of differing sampling techniques, timing and site-specific characteristics can limit the direct comparability of the results obtained. This suggests that, although there are general variability trends in SPM concentrations, more studies with standardized methodologies are needed to confirm these patterns with greater certainty. Additionally, it is important to note that studies on SPM in this region are relatively scarce, further highlighting the need for more comprehensive and consistent data collection. Based on this analysis, we can conclude that SPM concentrations may vary significantly over time and between locations. Nevertheless, caution is needed when making direct comparisons without further standardization of data sampling.
In the summer of 2022/2023, the temperature and salinity distribution pattern agreed with other studies (Fig. 2a,b). The coastal Antarctic water temperature varies monthly, with higher values usually reported in late summer due to increased solar radiation and atmospheric temperature (Lange et al. Reference Lange, Tenenbaum, De Santis Braga and Campos2007, Cascaes et al. Reference Cascaes, de Albergaria-Barbosa, de Freitas, Colabuono, da Silva and Patire2011, Wasiłowska et al. Reference Wasiłowska, Kopczyńska and Rzepecki2015, Lima et al. Reference Lima, Moser, Piedras, da Cunha, Tenenbaum and Tenório2019). Although the average salinities for the summer months of 2022/2023 are approximately the same as those reported for surface ocean water at this latitude (Thompson et al. Reference Thompson, Heywood, Thorpe, Renner and Trasviña2009, Zhou et al. Reference Zhou, Hattermann, Nost, Biuw, Kovacs and Lydersen2014), the greater variability and the lower values detected towards the last months of summer (Fig. 2b) may indicate a greater influence of meltwater and continental input. However, unlike the notable variations observed in sea-surface temperature and salinity, the meltwater input does not directly influence SPM values, which remained consistent throughout the summer (Fig. 2c).
Spatial evaluation of temperature, salinity, pH and SPM
In November and December 2022, the colder and less saline waters of these periods can be attributed to the onset of melt influence at the beginning of the Antarctic summer (Scigliano et al. Reference Scigliano, da Rosa, Bastos and Braga2014, Lima et al. Reference Lima, Pezzi, Mata, Santini, Carvalho and Sutil2022), especially in the Martel Inlet and in the innermost sites of the Mackellar Inlet, which also showed a contribution from SPM by meltwater (Figs S1 & S2). The exception is site P5, which presented high values of SPM even though it showed no signs of meltwater. This site is located in the western part of the bay, where the influence of winds and tides is more intense (Robakiewicz & Rakusa-Suszczewski Reference Robakiewicz and Rakusa-Suszczewski1999), which can promote sediment resuspension and contribute to an increase in SPM. January 2023 can be considered a transitional month, characterized by the shift from saltier and colder waters at the beginning of summer to warmer and less salty waters at the end of summer (Figs S3 & S6). During this transition period, when Admiralty Bay is not yet fully influenced by meltwater and considering that the south-western portion - where the Ezcurra Inlet is located - receives the most significant influence from Bransfield Strait waters flowing from west to east, this influence may have contributed to the higher salinity and lower SPM values observed in the Ezcurra Inlet. January 2020 and February and March 2023 showed no clear distinctions between the different inlets. This pattern may be attributed to increased meltwater inputs during these periods, resulting in greater mixing within the bay.
Spatial assessment of the surface water parameters is challenging due to the environment’s dynamism, which is even more pronounced in the Antarctic region. Considering these factors, some points can be highlighted from the analysis of Figs 3 & 4:
-
1) Although there was no clear distinction in the parameters between the bays, the Mackellar Inlet showed higher SPM values across all evaluated periods. Other studies have indicated a greater input from land-based sources in this region (Fávaro et al. Reference Fávaro, Silva, Mazzilli, Cavallaro, Taddei, Berbel and Braga2012, Berbel & Braga Reference Berbel and Braga2014). In contrast, Pichlmaier et al. (Reference Pichlmaier, Aquino, Da-Silva and Braun2004) detected higher SPM concentrations in the Martel Inlet compared to the Mackellar Inlet. However, an important factor influencing sediment concentrations in the Martel Inlet was the location of the sampling sites, which were closer to the shore than the Mackellar Inlet sites. In the present study, the sites with the highest SPM values were those located inside the Mackellar Inlet.
-
2) The outermost sites (P1, P2, P6 and P7), located in the more central regions of the bay, generally presented higher salinities than the innermost sites near major freshwater inputs.
-
3) Site P15 consistently showed high concentrations of SPM in almost all of the sampling periods.
-
4) In general, although there was no direct correlation, sites with higher SPM values tended to have lower temperature values and, in particular, lower salinity values.
The cluster analysis did not reveal a distinct distribution pattern separating the three inlets (Figs S6–S13). Previous research evaluating the surface sediments of the bay identified two different sectors: one in the inner sector and another near the mouth of the bay, under the influence of the Bransfield Strait waters (Fávaro et al. Reference Fávaro, Silva, Mazzilli, Cavallaro, Taddei, Berbel and Braga2012). However, the sites evaluated in the current study were obtained from internal areas of the bay, close to the coast, and at shallower depths, which may have contributed to the absence of clear sectorization.
Integration between water and atmospheric parameters during the summer of 2022/2023 and sources of SPM in Admiralty Bay
Atmospheric climate parameters such as air temperature, radiation and wind patterns influence freshwater and sediment supply and resuspension on the seabed (Pichlmaier et al. Reference Pichlmaier, Aquino, Da-Silva and Braun2004). Thus, the weather conditions before and during the sampling day influence meltwater discharge and dynamics in the bay. To better understand these interactions, we conducted correlation analyses. However, the absence of strong correlations and the weak correlation between water parameters and wind speed and direction suggest that the influence on the water column is highly dynamic, with wind variations playing a particularly significant role.
The PCA results highlighted wind speed and water temperature as the most significant variables influencing the analysed periods. In addition, the increased melting in 2020 did not necessarily result in higher SPM concentrations in Admiralty Bay. This suggests that wind speed plays an important role in influencing surface water parameters and indicates additional sources of SPM beyond melting, such as sediment resuspension or atmospheric deposition. A 19 year analysis also identified wind speed as an important regulator of temperature and SPM in Potter Cove, King George Island (Schloss et al. Reference Schloss, Abele, Moreau, Demers, Bers, González and Ferreyra2012).
Strong winds probably play a primary role in resuspending SPM, especially in the shallow, near-coastal areas analysed. Additionally, atmospheric deposition may contribute to SPM levels in the region. The atmospheric input of particulate matter to the ocean in the Antarctic originates from terrestrial dust sources in Patagonia, Australia and New Zealand, as well as from local marine and sea-ice regions (Neff & Bertler Reference Neff and Bertler2015). Anthropogenic sources also contribute, particularly from South America and Australia (Bazzano et al. Reference Bazzano, Soggia and Grotti2015). The transport of these particulates is driven by atmospheric circulation patterns, including high-latitude winds and katabatic flows (Bazzano et al. Reference Bazzano, Soggia and Grotti2015, Neff & Bertler Reference Neff and Bertler2015) that have high wind speeds.
However, a possible contribution of meltwater to SPM concentrations when evaluating the spatial variability and principal component 2 suggests that the influence on the water column in Admiralty Bay is highly variable and sensitive to dynamic environmental factors. Thus, understanding the behaviour of the water column in this region will require close monitoring of wind patterns and other meteorological conditions, which are key drivers of the observed variability.
Conclusion
This study evaluated surface water temperature, salinity, pH and SPM in Admiralty Bay, Antarctic Peninsula, during different summers. Temperature and salinity were significantly different in January 2020 compared to the summer of 2022/2023 and were influenced by increased meltwater input. However, pH and SPM were not necessarily affected by this increased meltwater. The same pattern was observed in the summer of 2022/2023, with only water temperature and salinity varying towards the end of the summer. Spatially, the different inlets (Martel, Mackellar and Ezcurra) showed variations in temperature, salinity and SPM concentration, with consistently higher levels of SPM recorded in the Mackellar Inlet. This increase is probably due to its proximity to land-based sources, primarily influenced by meltwater. The results suggest that SPM concentrations in Admiralty Bay are influenced by multiple sources and dynamic environmental factors, with wind-driven resuspension playing a key role in the shallow coastal areas analysed. We highlight that the data acquired in this study represent a only snapshot of the exact moment of sampling, emphasizing the need for continuous monitoring of water physicochemical parameters and the influence of atmospheric conditions in order for us to understand the dynamics in Antarctic coastal waters.
Supplementary material
To view supplementary material for this article, please visit http://doi.org/10.1017/S0954102025000148.
Acknowledgements
This work was supported by the Antarctic Brazilian Program (PROANTAR) and the National Council for Research and Development (CNPq; grant no. 442692/2018-8). A.C. Souza thanks the São Paulo Research Foundation (FAPESP; grant no. 2020/15701-8 and 2024/05324-3). T. Combi thanks CNPq for the researcher grant (CNPq 307484/2022-0). R.A. Lourenço thanks CNPq (grant no. 305415/2023-9). The authors thank the Brazilian Antarctic Station staff for their support during the sampling activities. Finally, this work is part of CARBMET project (The multiple faces of organic CARBon and METals in the sub-Antarctic ecosystem) sponsored by CNPq, CAPES and the Brazilian Ministry of Science, Technology, and Innovation.
Competing interests
The authors declare none.
Author contributions
Amanda Câmara Souza: Investigation, Writing - original draft, Writing - review & editing. César de Castro Martins: Administration project, Conceptualization, Resources, Writing - review & editing, Funding acquisition. Tatiane Combi: Conceptualization, Writing - review & editing, Visualization, Supervision. Rafael André Lourenço: Conceptualization, Writing - review & editing, Visualization, Supervision.


 Open access