


Introduction
The quality of elected politicians is important for the functioning of democratic societies (see, for example, Chattopadhyay and Duflo Reference Chattopadhyay and Duflo2004; Carreri Reference Carreri2021; Meriläinen Reference Meriläinen2022; Figueiredo, Hidalgo and Kasahara 2023; Melo and Tigre Reference Melo and Tigre2024), but conceptualizing and measuring quality are challenging tasks. Until recently, empirical research mostly used coarse proxies for quality, such as politicians’ experience, level of education, or income before entering politics (see Weeks and Baldez Reference Weeks and Baldez2015, Table 1). Dal Bó et al. (Reference Dal Bó, Finan, Folke, Persson and Rickne2017) advanced the discussion on politician quality by assembling a rich dataset from Sweden covering ordinary citizens and politicians standing for municipal and parliamentary elections. They found members of parliament (MPs) to have higher cognitive ability and leadership scores than municipal election winners, who, in turn, had more formal education, higher earning potentials, and leadership scores than ordinary citizens. Using Finnish military records, Jokela et al. (Reference Jokela, Meriläinen, Tukiainen and von Schoultz2023) similarly show that politicians are positively selected on visuospatial, verbal, and arithmetic reasoning as well as personality traits such as leadership motivation, achievement striving, and honesty. These traits, they hold, are probably as important as cognitive ability for being an effective elected representative.Footnote 1
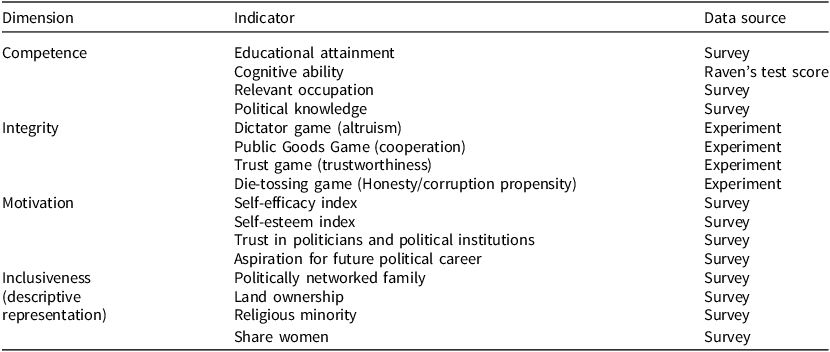
Table 1. Variables used in our analysis and primary data sources
Much less is known about elected politicians in the developing world, mainly because of data limitations (Gulzar Reference Gulzar2021). Studies of politics in India, the country we focus on here, indicate integrity shortfalls and negative selection on key characteristics; a notable percentage of India’s MPs and members of state-level legislative assemblies (MLAs) have pending criminal charges, including for serious crimes, and the average politician amasses considerable wealth while in office (Vaishnav Reference Vaishnav2017; Fisman, Schulz and Vig Reference Fisman, Schulz and Vig2014). Simultaneously, they are positively selected on educational attainment and relevant occupational experience (Verniers and Jaffrelot Reference Verniers and Jaffrelot2020). Besley, Pande and Rao (Reference Besley, Pande and Rao2012), in their study of village-level politics in South India, found that elected politicians are more likely than citizens in their villages to be educated, own land, and have family political connections. Still, they tend to benefit more from public transfer programs than marginalized members of their communities, indicating political opportunism.
These observations raise important questions about politicians in developing-country democracies, including how quality can be credibly measured and whether there are competing dimensions of politician quality. We address these questions using data from an in-depth study of village-level politicians and ordinary citizens in West Bengal, India. India’s stature as the world’s largest democracy provides an ideal backdrop for studying the quality of elected representatives. While an extensive literature has examined the effects of quota-induced representation of women and marginalized groups (Scheduled Castes, Scheduled Tribes, and Other Backward Classes), there is little systematic evidence on the quality of politicians. Recent efforts using large data-sets are weakened by the need to rely on educational attainment as the only indicator of politician quality (Bamezai et al. Reference Bamezai, George, Sharan and Sun2023).
Following Stone, Maisel and Maestas (Reference Stone, Maisel and Maestas2004, 480), we understand quality as ‘inherent in the individual candidate, prior to and distinct from the candidate’s performance’. To measure politician quality, we introduce a broad set of indicators combining data from lab-in-the-field experiments and a rich post-experiment survey of elected village-level politicians and ordinary citizens. Our sampling strategy aligns with the recommendation by Gulzar (Reference Gulzar2021, 262) to compare politicians to the entire pool of office-eligible citizens rather than focusing on a narrow subset of the population more likely to run for office.Footnote 2
Building on previous work on politician quality, we focus on competence and integrity (see, for example, Mondak Reference Mondak1995). We also examine motivation, which has been found to be a key driver of both civil servant and politician performance (Kim Reference Kim2009; Carreri and Payson Reference Carreri and Payson2021). Also, women and minorities, who account for a significant share of Indian politicians because of seat reservations, are prone to lower self-esteem and to being less optimistic about the prospects for making a difference (self-efficacy) (Fox and Lawless Reference Fox and Lawless2004; Jensenius Reference Jensenius2017). Finally, given the increasing global attention to descriptive (inclusive) representation as a desirable feature of representative democracy (see, for example, Franceschet, Krook, and Piscopo Reference Franceschet, Krook and Piscopo2012), we consider additional indicators to capture inclusiveness.
For competence, we use two traditional indicators (educational attainment and relevant occupational experience) and two alternative indicators (cognitive ability measured using a Raven’s test and political knowledge). The latter two capture harder-to-observe but highly relevant attributes, as it is challenging for elected representatives to fulfill their duties without basic knowledge about the political system (see Auerbach, Singh and Thachil Reference Auerbach, Singh and Thachil2024).
To measure integrity, we use data from incentivized and validated experimental tasks designed to capture altruism, cooperative inclination, trustworthiness, and dishonesty. This approach allows us to overcome the limitations of survey-based integrity measurement (see, for example, Habyarimana, Khemani and Scot Reference Habyarimana, Khemani and Scot2023). To capture motivation, we combine established and contextually adapted survey measures of self-esteem, self-efficacy, and trust in politicians and political institutions, along with aspirations for future political office.
Finally, we consider four indicators of inclusiveness. First, given the dynastic nature of Indian politics (Chandra Reference Chandra2016), we examine whether politicians belong to politically networked families. Second, we consider the share of religious minorities (groups not covered by reservations). Third, we use land ownership as an indicator of wealth. Fourth, we consider the share of women as elected representatives. Whereas women have reserved seats, they are less likely to run for re-election and get re-elected than men. Accordingly, the share of women is particularly relevant when comparing inexperienced and re-elected politicians.
Our estimation sample consists of 239 recently elected village-level politicians (191 inexperienced and 48 re-elected) and 100 ordinary citizens in West Bengal, India. Given the non-trivial challenges of recruiting and implementing behavioral experiments with real-world politicians, this represents a substantive sample and effort.Footnote 3
We find evidence of positive selection with some important exceptions: politicians are more educated, more motivated, and seem to have greater integrity than ordinary citizens, but they also have lower cognitive ability and are more likely to come from politically networked families. Additionally, re-elected politicians have greater political knowledge and are more motivated than their inexperienced peers but are also more likely to be wealthy and male. These findings demonstrate the importance of measurement choices for the conclusions that are drawn – both in terms of the dimensions of quality one attempts to capture and how exactly each dimension is measured.
Our findings indicate that there may be competing dimensions of politician quality both in our sample and, plausibly, more generally – in India and other developing countries. Politicians display more integrity than their constituents: they are more honest. However, our results also indicate a trade-off between the political knowledge component of competence and integrity, as those with more political knowledge tend to score higher on our dishonesty measure. In our citizen sample, we also find a strong correlation between cheating in the dishonesty game and aspirations for political office. The strength of any such correlation is likely to vary with context and rent-seeking opportunities. In the context of local-level politicians in West Bengal, we find that politicians with more integrity and lower cognitive ability get elected. In higher tiers – where rent-seeking opportunities are abundant – the literature suggests that the politicians winning elections may be highly competent but also have lower integrity (Vaishnav Reference Vaishnav2017; Fisman, Schulz and Vig Reference Fisman, Schulz and Vig2014). A failure to pay attention to such possible trade-offs between different dimensions of quality, risks missing key insights about the quality of elected representatives.
Study Design
Our study was conducted in the North 24 Parganas district in the state of West Bengal immediately after the local elections in 2018. West Bengal has 23 districts with a total population of about 90 million, of whom 10 million live in North 24 Parganas. The district has 22 sub-districts (blocks/tehsils) and 200 village councils (Gram Panchayats or GPs for short). GPs represent the lowest tier of India’s electoral system and are responsible for implementing anti-poverty and other government programs and for the maintenance of local public goods in rural India.Footnote 4
GP elections were conducted in West Bengal for the first time in 1978 and have been held every five years since then. A candidate for a GP seat in West Bengal may be nominated by a political party or stand as an independent but must be a resident of the GP he or she represents. In the 2018 elections, most politicians represented the All-India Trinamool Congress (TMC), followed by the Left Front led by the Communist Party of India (Marxist).Footnote 5 Those elected receive a monthly remuneration (Rs. 1,500 in 2018); since the position is part-time, most elected politicians also have a regular job.
Our study sample includes 239 recently elected GP members (191 with no prior political experience and 48 re-elected), as well as 100 eligible voters from 31 GPs across 11 sub-districts in North 24 Parganas. Politicians were randomly sampled from lists obtained from selected GPs, and ordinary citizens were sampled from the electoral rolls in the same GPs. Our samples can be considered representative of eligible voters and elected politicians in rural North 24 Parganas.Footnote 6
Individual meetings were arranged with each study participant at a time and place of their choice. Participants first completed a set of incentivized experimental tasks: (1) a Dictator game, capturing generosity/altruism (Forsythe et al. Reference Forsythe, Horowitz, Savin and Sefton1994); (2) a Trust game to measure trustworthiness (Berg, Dickhaut and McCabe Reference Berg, Dickhaut and McCabe1995); (3) a Public Goods Game, studying cooperation (Ledyard Reference Ledyard, Kagel and Roth1995); and (4) a Die-tossing game designed to test honesty (Fischbacher and Föllmi-Heusi Reference Fischbacher and Föllmi-Heusi2013). Participants were informed that they would earn money from these tasks.Footnote 7 On average, each participant earned Rs. 800.Footnote 8
Following these tasks, participants responded to an extensive survey covering household demography, education, occupation, experience, self-efficacy, self-esteem, trust in political institutions, and other relevant characteristics. To measure cognitive ability, we administered a Raven’s Progressive Matrices test, which captures ‘the capacity to think logically and solve problems in novel situations, independent of acquired knowledge’ and is considered well-suited for low-income settings (Mani et al. Reference Mani, Mullainathan, Shafir and Zhao2013, 977).Footnote 9
Table 1 presents the politician attributes we focus on: competence, integrity and motivation, along with inclusiveness, and how the data were collected for each included variable.
Results
Our results are presented in Figures 1–4, following the structure of Table 1, comparing citizens ( $N\,=\,100$
) to elected politicians (
$N\,=\,100$
) to elected politicians ( $N\,=\,239$
). The reported p-values are from bivariate linear regression models with standard errors clustered at the GP level.
$N\,=\,239$
). The reported p-values are from bivariate linear regression models with standard errors clustered at the GP level.
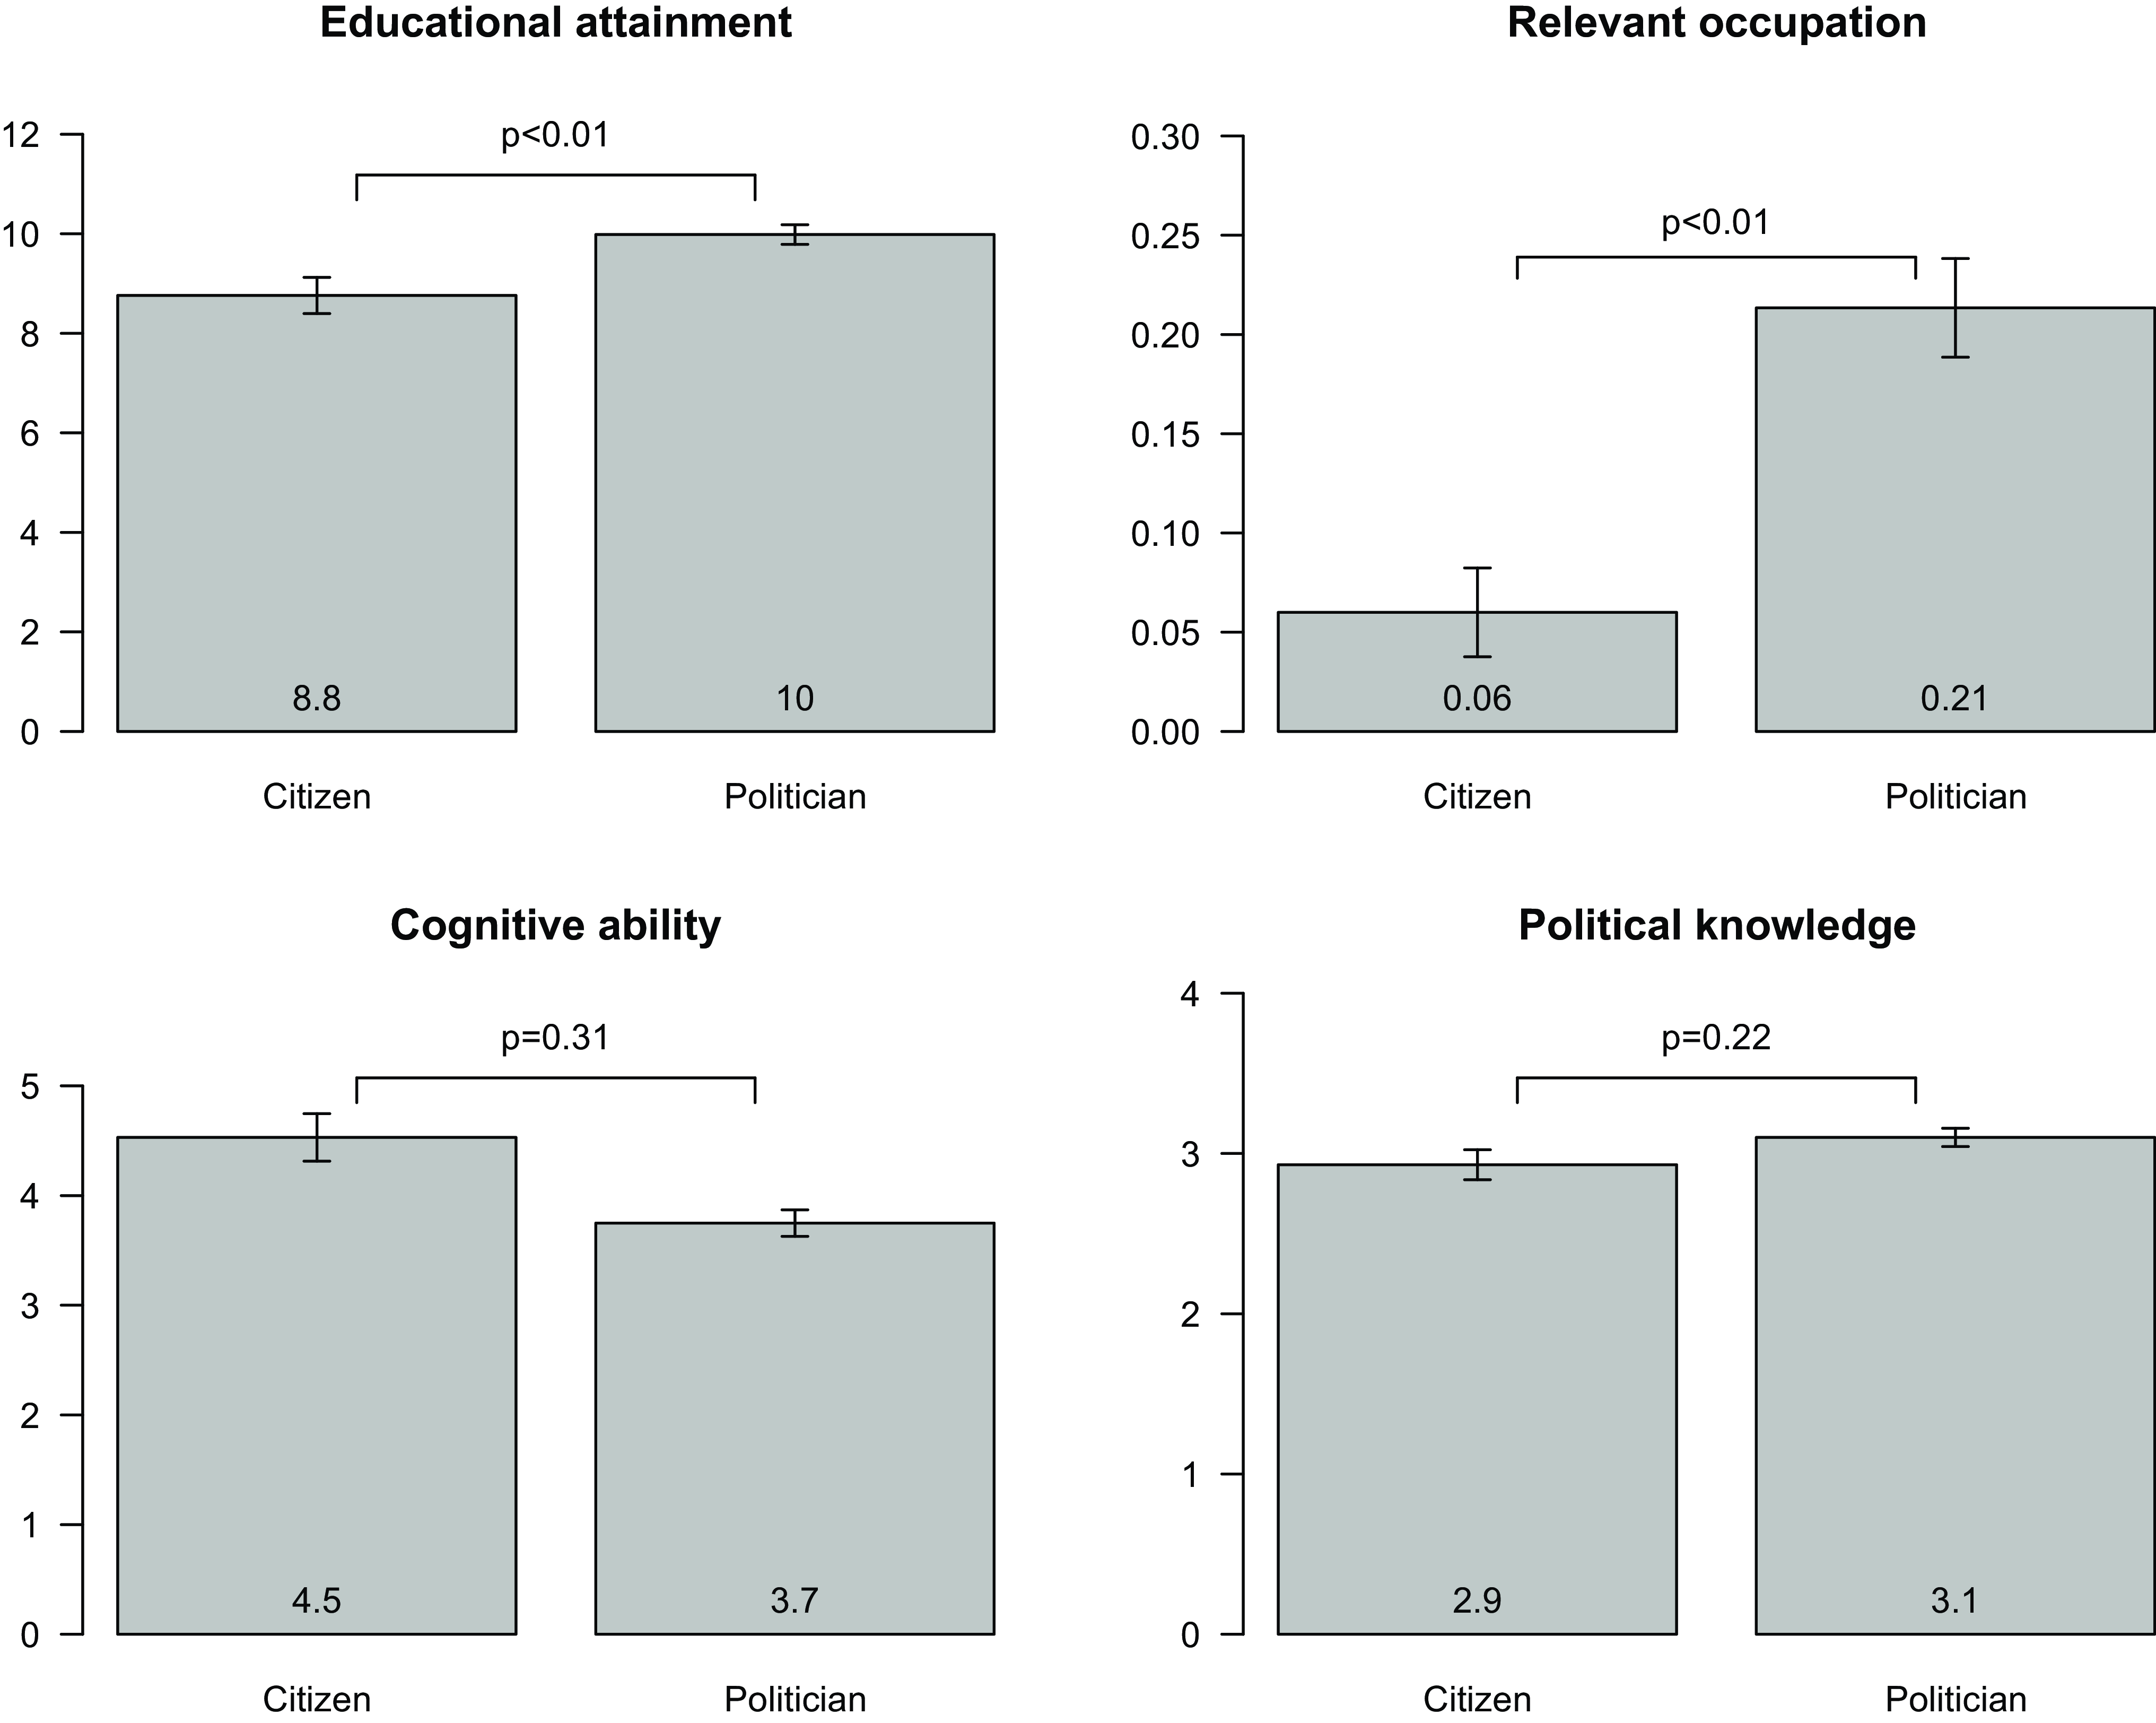
Figure 1. Indicators of competence.
Notes: Educational attainment is measured as self-reported years of schooling. Relevant occupation is 1 if the primary occupation is government employment, private employment, GP employment, or contractor, and 0 otherwise. Cognitive ability is the number of correct responses in 10 Raven’s Progressive Matrices tasks. Political knowledge is the sum of correct responses (0–4) when asked about the names of the local MLA, MP, the Chief Minister of the state, and India’s President. Error bars denote ±1 standard error.
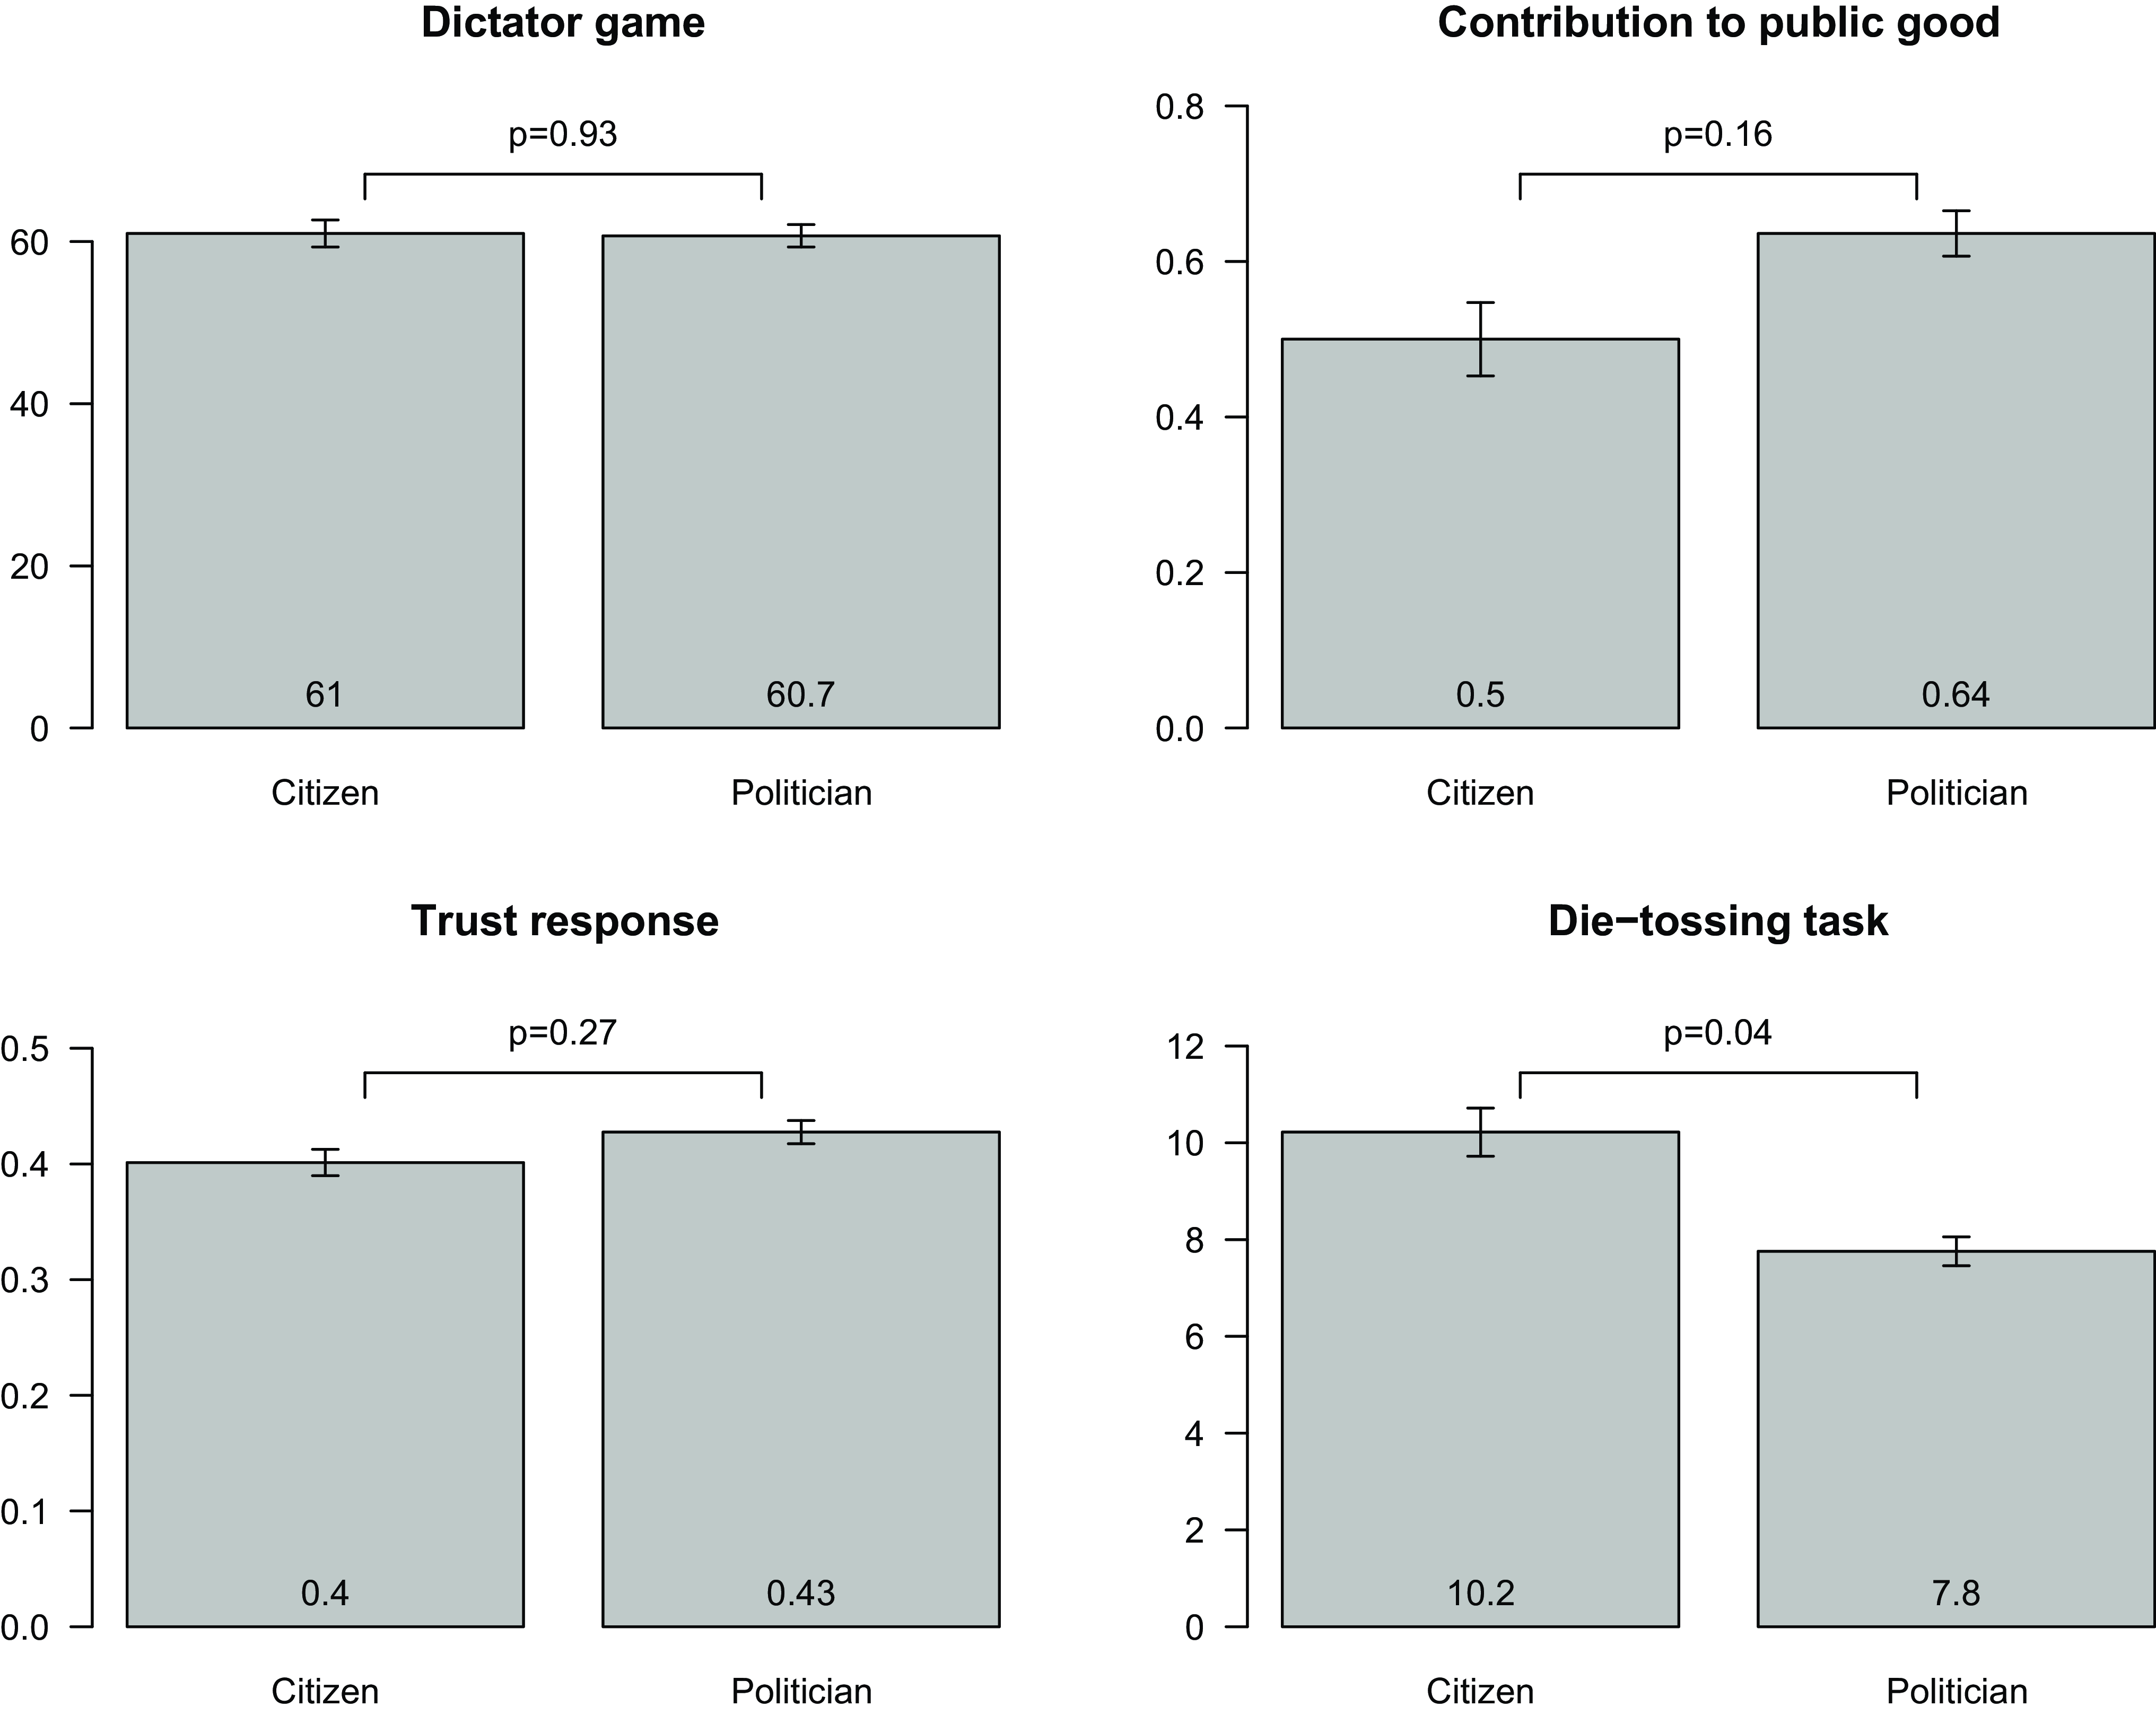
Figure 2. Indicators of integrity.
Notes: Error bars denote ±1 standard error. See Appendix B for a description of the games.
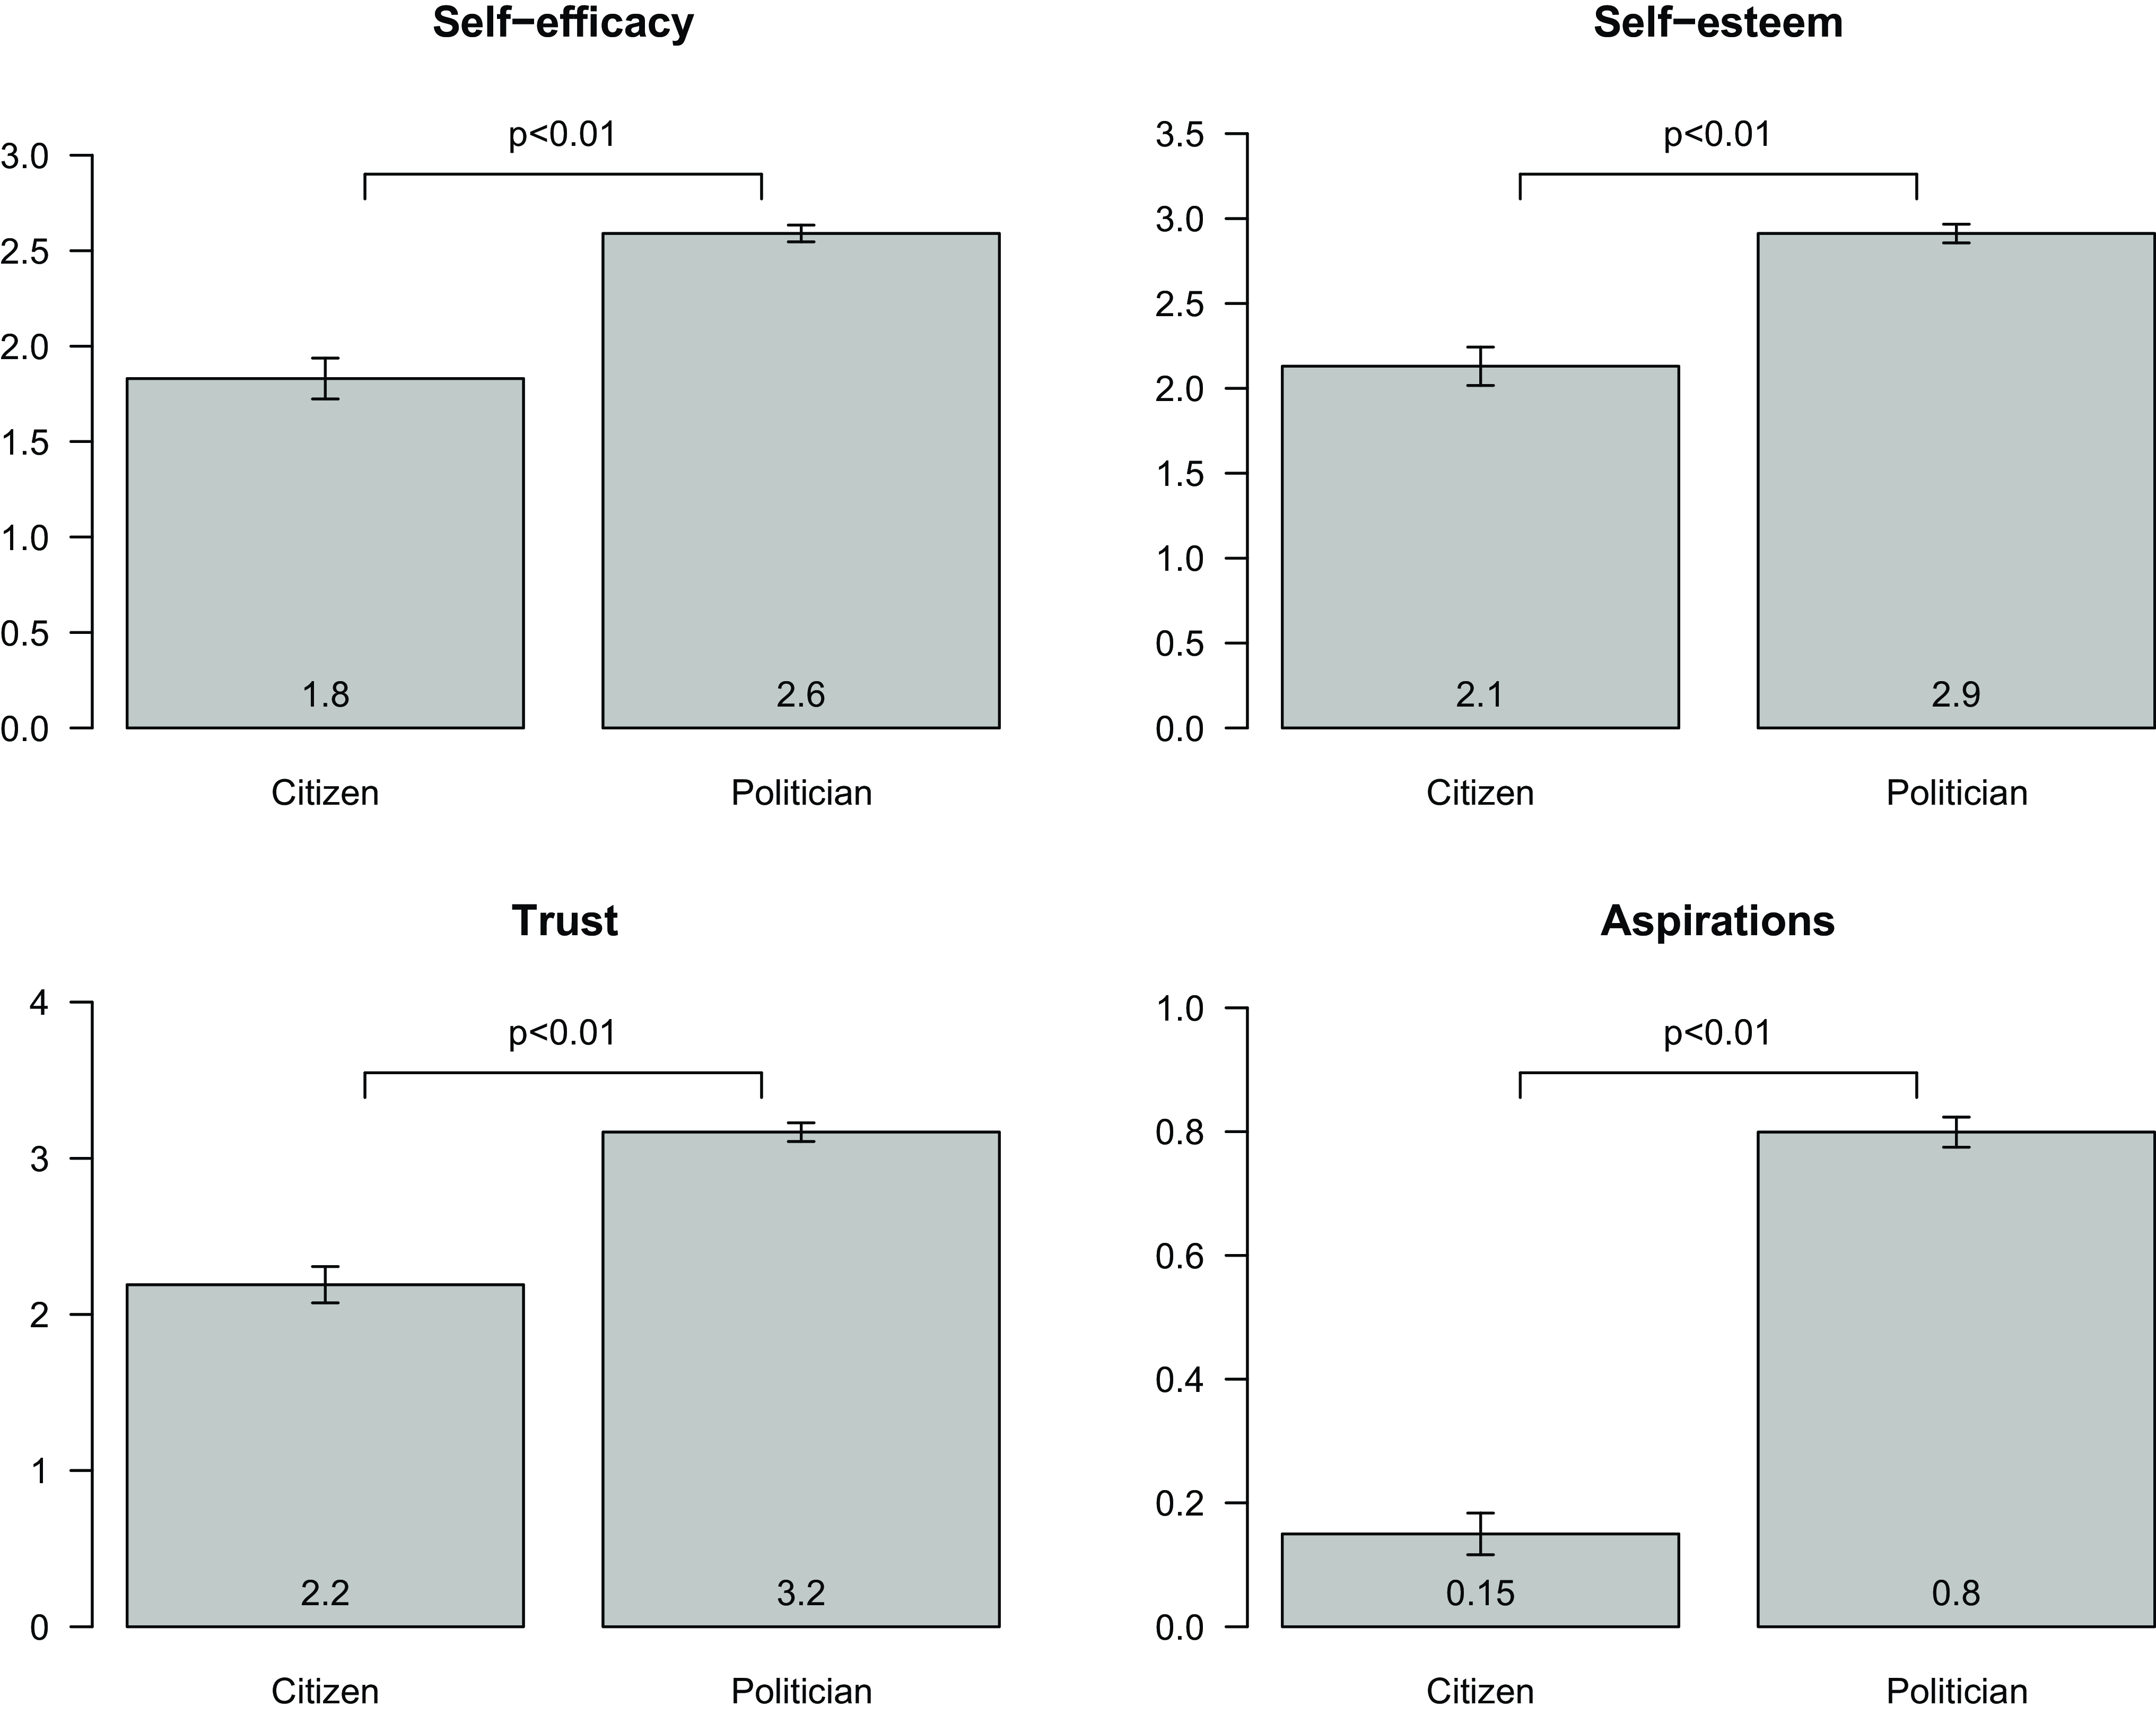
Figure 3. Indicators of motivation.
Notes: Self-efficacy runs 0–3, where 3 indicates a high level of self-efficacy. Self-esteem and trust run 0–4. Aspiration is 1 if respondents intend to run for office in the future and 0 otherwise. Table C1 in Appendix C presents item-wise output for the indices. Error bars denote ±1 standard error.
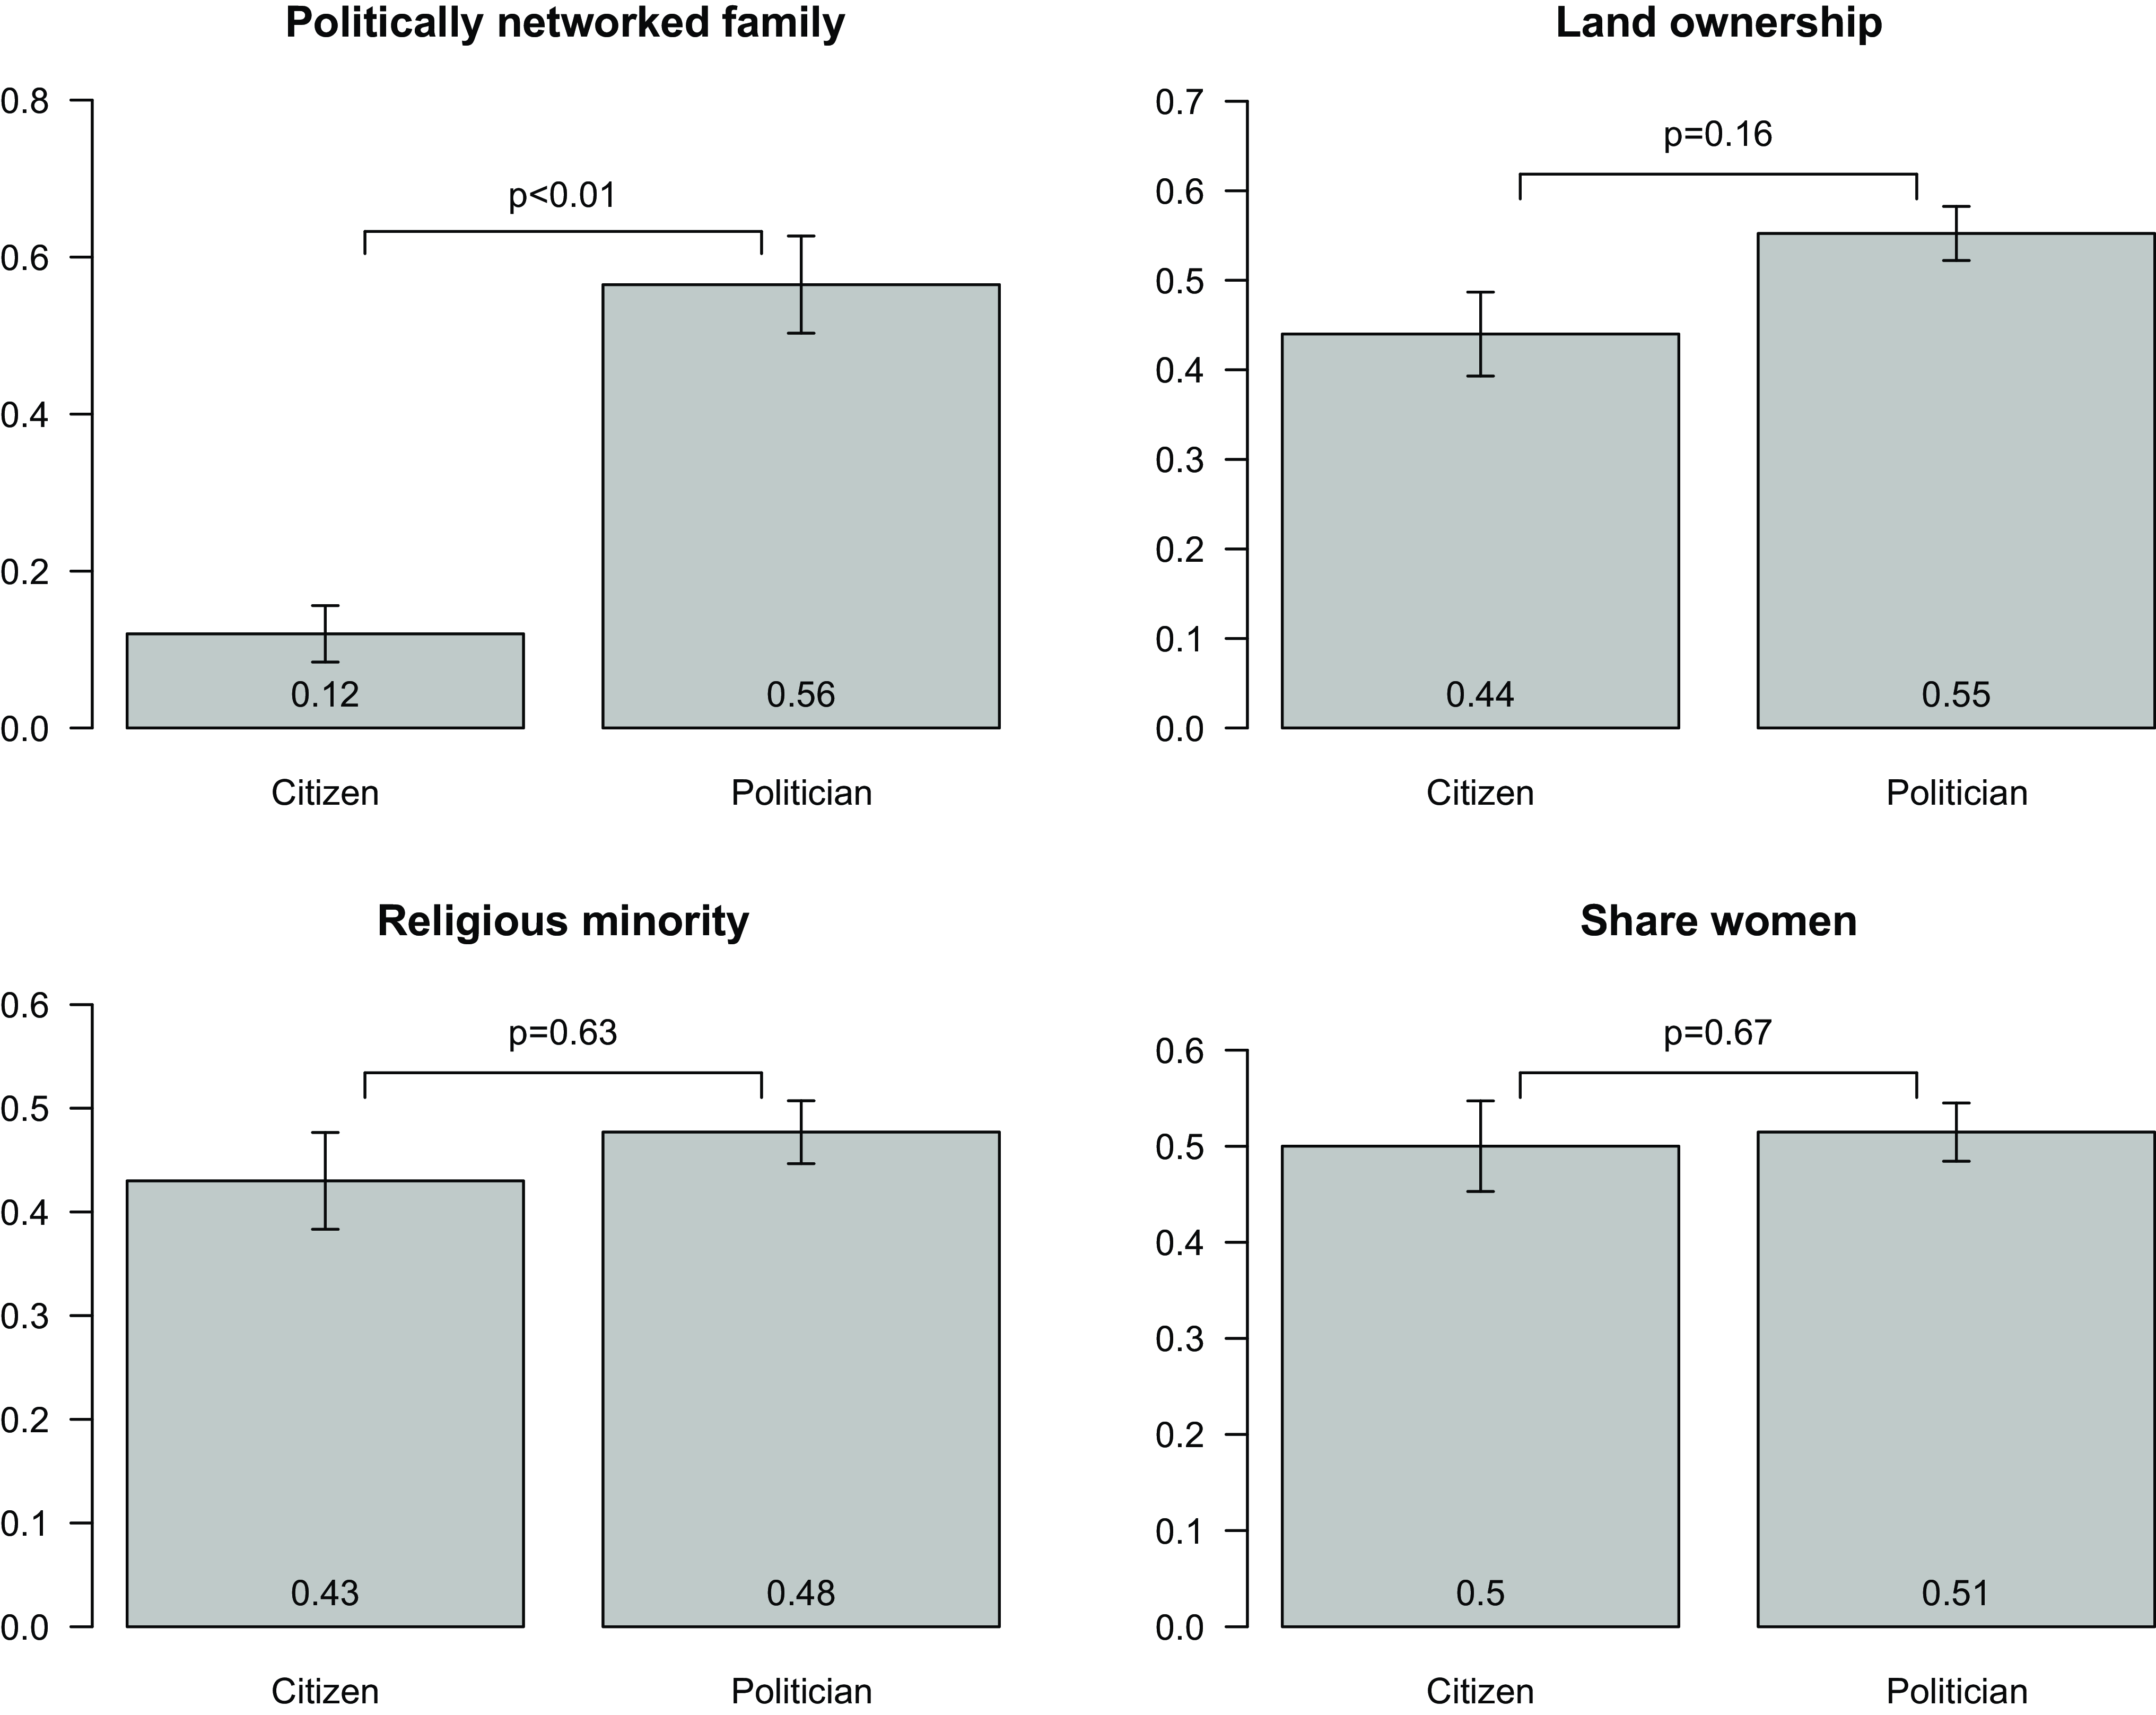
Figure 4. Indicators of inclusiveness.
Notes: Land ownership is 1 if the respondent is from a landowning household and 0 otherwise. Religious minority is 1 if the respondent is Muslim and 0 otherwise. A politically networked family is the number of individuals in the respondent’s closest or extended family who currently hold (or have previously held) a political position or another leadership position. Error bars denote ±1 standard error.
Competence
Figure 1 shows the results for our four indicators of competence. For traditional measures of competence – educational attainment and having a relevant occupation – politicians score significantly higher than ordinary citizens. Politicians, on average, have more than one additional year of formal education than ordinary citizens ( $p\,=\,0.01$
) and are about 15 percentage points more likely to have a relevant occupation (
$p\,=\,0.01$
) and are about 15 percentage points more likely to have a relevant occupation ( $p \lt 0.01$
), jobs that conceivably prepare individuals for a career as an elected politician.
$p \lt 0.01$
), jobs that conceivably prepare individuals for a career as an elected politician.
If restricted to the traditional indicators of competence, our analysis would miss the insights that our alternative measures add. The results of the Raven’s test are particularly striking. Here, politicians have significantly lower test scores than ordinary citizens, a difference of almost one additional wrong answer for the ten tasks given ( $p\,=\,0.05$
). This indicates that politicians have lower cognitive ability than their constituents. The gap is even larger between citizens and politicians entering office for the first time (see Figure C1 in the Online Appendix).
$p\,=\,0.05$
). This indicates that politicians have lower cognitive ability than their constituents. The gap is even larger between citizens and politicians entering office for the first time (see Figure C1 in the Online Appendix).
There is not much of a difference between citizens and politicians overall for our measure of political knowledge, but this also masks an experience gap: inexperienced politicians score about the same as ordinary citizens, while re-elected politicians score higher than both citizens and inexperienced politicians ( $p \lt 0.01$
, see Figure C1).
$p \lt 0.01$
, see Figure C1).
Whereas these findings indicate positive selection into office on traditional indicators of competence, they indicate negative selection on a direct measure of cognitive ability. Our political knowledge measure, however, indicates that experience in office is associated with acquiring more political knowledge.
Integrity
Figure 2 shows the results for our integrity indicators. We find no significant differences between politicians and ordinary citizens for the amount offered in the Dictator game (altruism), the amount returned by the receiver in the Trust game (trustworthiness), or contribution in the Public Goods Game (cooperation). However, citizens are significantly more dishonest than politicians. In the die-tossing task, participants were asked to throw an unbiased die thirty times in private and report the number of sixes obtained.Footnote 10 Given that both citizens and politicians use an unbiased die, we should expect the distribution of reported sixes to be similar across the two groups, with an average of five reported sixes. In our sample, politicians reported 7.8 sixes on average, while citizens reported 10.2 sixes on average. This difference of 2.4 sixes is statistically significant ( $p\,=\,0.04$
) and implies a greater willingness among the citizens than among the politicians in our sample to engage in dishonest behaviour for personal gain.Footnote 11
$p\,=\,0.04$
) and implies a greater willingness among the citizens than among the politicians in our sample to engage in dishonest behaviour for personal gain.Footnote 11
Overall, these indicators provide evidence of politicians being positively selected on integrity, thus contradicting impressions (and findings on politicians in higher-tier positions) that politicians are more dishonest than the general population.
This difference in dishonesty is clearly important in India and other developing countries where rent-seeking is considered a key motivation for entering politics. Further, we find a positive correlation between politicians’ political knowledge and the number of sixes they report in the die-tossing game. This suggests a trade-off between the political knowledge component of competence and the honesty component of integrity. In our citizen sample, we also find a strong correlation between cheating in this game and aspirations for future political office.Footnote 12
Motivation
Our self-efficacy and self-esteem measures are modified variants of Rotter’s (Reference Rotter1966) Locus of Control Questionnaire and Rosenberg’s Self-Esteem Scale (Rosenberg Reference Rosenberg1965), adapted to the Indian context as discussed in Krishnan and Krutikova (Reference Krishnan and Krutikova2013). Our self-efficacy index includes respondents’ perceived influence on local government decisions, ability to improve living conditions in the village, and ability to improve the quality of public programs.
Our self-esteem index includes questions intended to capture skills and qualities expected to be relevant for effective political work – such as confidence about getting things done, defending an opinion, winning an argument, or feeling respected. Our trust index combines responses to questions about the GP doing the right thing and trust in political representatives at various levels. Finally, we include an indicator for respondents’ aspirations for future office (political aspirations).
Figure 3 shows that, across the board, politicians have a notable motivational edge over citizens, with positive and strongly significant differences. On self-efficacy, politicians are significantly more optimistic about the prospects for making a difference ( $p \lt 0.01$
) – perhaps not so surprising when they have just been granted a mandate to do so. However, politicians also express higher levels of self-esteem (
$p \lt 0.01$
) – perhaps not so surprising when they have just been granted a mandate to do so. However, politicians also express higher levels of self-esteem ( $p \lt 0.01$
) and trust in the political system (
$p \lt 0.01$
) and trust in the political system ( $p \lt 0.01$
).Footnote 13 Additionally, politicians express much higher aspirations for political office (
$p \lt 0.01$
).Footnote 13 Additionally, politicians express much higher aspirations for political office ( $p \lt 0.01$
).
$p \lt 0.01$
).
Inclusiveness
Next, we consider our indicators of descriptive representation. Not surprisingly, given the prevalence of ‘democratic dynasties’ in India (Chandra Reference Chandra2016), politicians are significantly more likely than citizens to come from politically networked families. Politicians, on average, have 0.44 more family members who currently hold (or previously held) a political position or another leadership position ( $p \lt 0.01$
). Politicians are also somewhat more likely to come from landowning families. In the overall sample, the difference between citizens and politicians is not significant, but that is because the difference between citizens and inexperienced politicians is not large. Re-elected politicians, however, are significantly more likely than both citizens and inexperienced politicians to come from a landowning family (
$p \lt 0.01$
). Politicians are also somewhat more likely to come from landowning families. In the overall sample, the difference between citizens and politicians is not significant, but that is because the difference between citizens and inexperienced politicians is not large. Re-elected politicians, however, are significantly more likely than both citizens and inexperienced politicians to come from a landowning family ( $p \lt 0.01$
, see Appendix Figure C4).
$p \lt 0.01$
, see Appendix Figure C4).
We do not see significant differences between the citizen and politician samples in the share of individuals from religious minorities (Muslims).
Half of the village council seats in West Bengal are reserved for women, though women can also run for non-reserved seats. It is thus not surprising to see a higher share of women among politicians than in the overall population. However, given the hostile climate facing women in Indian politics, we expect a lower share of women among re-elected politicians: while 58 per cent of the inexperienced sample are women, this drops to about 27 per cent among re-elected politicians ( $p \lt 0.01$
, see Figure C4).
$p \lt 0.01$
, see Figure C4).
Political experience is often considered a positive politician trait because it is associated with more political knowledge and greater self-esteem. Our findings, however, point to a possible trade-off between experience and descriptive characteristics that matter for inclusiveness. Despite an extensive quota system, whether due to self-selection into rerunning or voter preferences, the re-elected politicians in our sample are more likely to belong to a stereotypical political elite of wealthy and well-connected men.
Conclusions
Our results indicate that local-level politicians in India are positively selected on several, but not all, important characteristics. Those entering political office are more honest and more confident in their ability to make a difference. They also have greater trust in political institutions and leaders. If we used educational attainment as the main indicator of competence – a common approach in the literature – we would also conclude that politicians are more competent than their constituents. However, our alternative measures of competence (a contextually suitable cognitive ability test and questions about political knowledge) indicate that the politicians in our sample are less competent than the citizens they are elected to represent. In our sample, there also seems to be a trade-off between integrity and the political knowledge component of competence. A comparison of the inexperienced and re-elected politicians further reveals a reversal from more inclusive towards more traditional elite politics, indicating another possible trade-off, now between greater experience and political knowledge and descriptive representation.
Our findings indicate a partly negative selection on competence and positive selection on integrity at the lowest tier in India: this may be reversed as one moves up the political status ladder and rent-seeking prospects proliferate. Still, given the negative stereotypes about politicians in India and other developing countries, our findings provide a more optimistic account of the intentions and integrity of politicians, at least at the local level. While these findings need further testing using large, representative samples, our in-depth analysis demonstrates the relevance of nuanced conceptualization and measurement of politician quality.
Supplementary material
The supplementary material for this article, which comprises Online Appendix A, B and C, can be found at https://doi.org/10.1017/S0007123425000225.
Data Availability Statement
Replication data for this article can be found in Harvard Dataverse: https://doi.org/10.7910/DVN/MARUOB
Acknowledgements
We thank the field staff at Outline India for all their help with implementing the study. We also gratefully acknowledge valuable feedback on earlier drafts of this paper from Benny Geys, Saad Gulzar, Alison Post, Janne Tukiainen, and audiences at conferences and seminars. IRB clearance was obtained from the University of Auckland (Approval number 019938).
Financial support
We gratefully acknowledge funding from the University of Auckland (Project No. 3714801), the Department Research Scheme, Monash University, and the Research Council of Norway (Project No. 250753).
Competing Interests
The authors declare none.


 Open access