


Introduction
Insect pollinators are crucial for the successful sexual reproduction of more than 80% of the world’s flowering plants (Ollerton et al. Reference Ollerton, Winfree and Tarrant2011; Kremen Reference Kremen2018). The pollination services provided are vital to maintaining biodiversity in natural ecosystems and also for human food security (Ollerton Reference Ollerton2017). Insect pollinators are known to increase the production of a considerable number of crop species (Klein et al. Reference Klein, Vaissière, Cane, Steffan-Dewenter, Cunningham, Kremen and Tscharntke2006; Vanbergen and the Insect Pollinators Initiative Reference Vanbergen2013; Kremen Reference Kremen2018). Bees (Apoidea: Anthophila) are considered the most important pollinators, with 20 000 species (Michener Reference Michener2007) that vary in their use of floral resources and are distributed across many ecosystems worldwide.
Bees are facing major threats, such as climate change and habitat loss caused by disturbances (Sánchez-Bayo and Wyckhuys Reference Sánchez-Bayo and Wyckhuys2019; Wagner Reference Wagner2020). Evidence of bee decline has been recorded in recent decades across Europe and North America (Williams and Osborne Reference Williams and Osborne2009; Cameron et al. Reference Cameron, Lozier, Strange, Koch, Cordes, Solter and Griswold2011, Reference Cameron, Lim, Lozier, Duennes and Thorp2016; Bartomeus et al. Reference Bartomeus, Ascher, Gibbs, Danforth, Wagner, Hedtke and Winfree2013; Mathiasson and Rehan Reference Mathiasson and Rehan2019; Soroye et al. Reference Soroye, Newbold and Kerr2020). Multiple climatic variables impact bee physiology (Wagner Reference Wagner2020) and could be responsible in part for these declines. Temperature is one determining factor in bees’ development rate, survival, reproductive success, flight activity, and foraging patterns (Rader et al. Reference Rader, Reilly, Bartomeus and Winfree2013; Whitfield et al. Reference Whitfield, Purcell and Daly2013). Climatic variables also influence the productivity and dispersion of flowering plants (Pyke et al. Reference Pyke, Thomson, Inouye and Miller2016). Variations in temperature and precipitation can reduce phenological synchrony between bees and plants, resulting in declines in the abundance of some species and in shifts in species’ ranges (Williams et al. Reference Williams, Thorp, Richardson and Colla2014; Pyke et al. Reference Pyke, Thomson, Inouye and Miller2016).
Human activities such as the exploitation of natural resources can drastically reshape natural environments in ways that affect bees (Memmott et al. Reference Memmott, Waser and Price2004). Landscape disturbances leading to changes in the availability of flower resources, nesting sites, and overwintering habitats particularly can impact bees, eventually resulting in species loss (Zurbuchen et al. Reference Zurbuchen, Cheesman, Klaiber, Müller, Hein and Dorn2010a; Williams et al. Reference Williams, Thorp, Richardson and Colla2014). Because bee species vary in their nesting requirements, these impacts are expected to be species specific.
The boreal forest is the northernmost forested ecosystem on the planet. It is one of the widest spanning biomes on earth, forming a mostly uninterrupted belt across Canada, Alaska, Russia, Finland, and Scandinavia (Henry Reference Henry2002). It is characterised by a cold climate that allows the growth of mostly coniferous trees. Disturbances such as fires and defoliating insect outbreaks are common in the boreal forests and contribute to their natural cycle (Shugart et al. Reference Shugart, Leemans, Bonan and Payette2005). Logging is also a major anthropogenic disturbance type affecting boreal ecosystems. Even though bees are often studied in agricultural or urban environments, open or recently disturbed forests that are rich in understorey flowering plants constitute an important habitat for many bee species. Anthropogenic disturbances such as logging create early succession habitats that are potentially suitable for many species (Romey et al. Reference Romey, Ascher, Powell and Yanek2007; Pengelly and Cartar Reference Pengelly and Cartar2010; Taki et al. Reference Taki, Okochi, Okabe, Inoue, Goto, Matsumura and Makino2013; Zitomer et al. Reference Zitomer, Galbraith, Betts, Moldenke, Progar and Rivers2023). Several studies have shown that vegetation development following logging activities can positively impact wild bee communities in temperate forests (Romey et al. Reference Romey, Ascher, Powell and Yanek2007; Taki et al. Reference Taki, Okochi, Okabe, Inoue, Goto, Matsumura and Makino2013; Rubene et al. Reference Rubene, Schroeder and Ranius2015; Rodríguez and Kouki Reference Rodríguez and Kouki2017; Chase et al. Reference Chase, Charles, Harmon-Threatt and Fraterrigo2023a, Reference Chase, Charles, Harmon-Threatt and Fraterrigo2023b; Davies et al. Reference Davies, Davis and Griswold2023). Specifically, the creation of canopy openings increases light penetration, which stimulates understorey herbaceous flowering plants (Hanula et al. Reference Hanula, Horn and O’Brien2015). Because they feed exclusively on pollen and nectar at every developmental stage (Whitfield et al. Reference Whitfield, Purcell and Daly2013), bees are highly dependent on the availability of floral resources. The increased amounts of woody debris, dead plant materials, and exposed soil after forest harvesting also create specific nesting habitats that can be used by ground-, cavity-, and wood-nesting bees (Hanula et al. Reference Hanula, Ulyshen and Horn2016; Chase et al. Reference Chase, Charles, Harmon-Threatt and Fraterrigo2023a). The presence in clearcuts of a wide variety of nesting habitats and floral resources benefits bees because they must return to their nest several times a day while foraging (Zurbuchen et al. Reference Zurbuchen, Cheesman, Klaiber, Müller, Hein and Dorn2010a).
Studies conducted on wild bees in managed boreal forests have mainly focused on the effect of elevation, floral and nesting resources, or management practices (Rubene et al. Reference Rubene, Schroeder and Ranius2015; Rodríguez and Kouki Reference Rodríguez and Kouki2017; Westerfelt et al. Reference Westerfelt, Weslien and Widenfalk2018; Luna Santa-María Reference Luna Santa-María2021). How climate drives the assemblage of bee communities along latitudinal gradients in forest environments remains unknown, particularly at the regional scale. Specifically, bee communities present in recent clearcuts may vary depending on climatic and environmental conditions present in different regions. A better understanding of how bee communities vary along spatial bioclimatic gradients could help forecast potential impacts of climate change. Indeed, current climate change models predict that an increase in both average temperatures and their variability, as well as decreased seasonality, will be more pronounced at higher latitudes in the Northern Hemisphere (Intergovernmental Panel on Climate Change 2014). Wild bees, which are nonmigratory organisms, may be strongly affected by these changes (Pyke et al. Reference Pyke, Thomson, Inouye and Miller2016), especially given their limited heat tolerance (Gonzalez et al. Reference Gonzalez, Herbison, Robles Perez, Panganiban, Haefner and Tscheulin2024). Negative consequences of climate change have been documented at the community and population levels (Rafferty Reference Rafferty2017; Kammerer et al. Reference Kammerer, Goslee, Douglas, Tooker and Grozinger2021), especially for bumble bees (Jackson et al. Reference Jackson, Johnson, Morandin, Richardson, Guzman and M’Gonigle2022; Liczner et al. Reference Liczner, Schuster, Richardson and Colla2023). The consequences include reduction of species-distribution ranges (Sirois-Delisle and Kerr Reference Sirois-Delisle and Kerr2018), reductions in floral-resource availability (Phillips et al. Reference Phillips, Shaw, Holland, Fry, Bardgett, Bullock and Osborne2018), and phenological mismatches between bees and their feeding resources, thereby reducing the breadth of their diet (Memmott et al. Reference Memmott, Craze, Waser and Price2007; Forrest Reference Forrest2015). Assessing wild bee communities’ potential response to spatial climate variation would facilitate evaluation of their potential sensitivity to climate change (Lebuhn et al. Reference Lebuhn, Droege, Connor, Gemmill-Herren, Potts and Minckley2013).
The overall aim of the present study was to, respectively, assess the effects of climate and floristic composition on wild bee diversity in clearcuts in the province of Quebec along a single local latitudinal bioclimatic gradient. We used recent clearcuts as a study ecosystem to uniformise the disturbance history of the different sites along this gradient and to facilitate the analysis of bee community responses to the variables of interest, climate and flowering plants.
We first assessed Anthophila communities at the genus level and then pursued our evaluation to the species level specifically for bumble bee communities (Bombus spp. Latreille) (Hymenoptera: Apidae). We conducted species-level analyses for this genus because it contains species that are potential indicators of climate change (Williams et al. Reference Williams, Thorp, Richardson and Colla2014; Kerr et al. Reference Kerr, Pindar, Galpern, Packer, Potts and Roberts2015). We hypothesised that wild bee diversity would be inversely related to latitude; according to McCabe et al. (Reference McCabe, Cobb and Butterfield2019), cold environments can act as environmental filters on bee communities. Moreover, as the seasonal activity period is variable among Anthophila taxa (Packer et al. Reference Packer, Genaro and Sheffield2007), a higher diversity of genera is expected in regions where the growing season is longer (Ogilvie and Forrest Reference Ogilvie and Forrest2017). To test our hypothesis, we first compared bee abundance, richness, and diversity for three forest areas located in different bioclimatic domains in Quebec, Canada. Second, we highlighted indicator, dominant, and exclusive taxa using bee distribution patterns along the same gradient. Third, we explored the influence of local floristic composition on bee community assemblages. These steps also allowed us to identify which Anthophila genera and which bumble bee species were the most abundant in boreal and mixed forests in the province of Quebec, a region where post-disturbance bee communities have been little studied to date.
Material and methods
Study sites
We conducted our study during the summer of 2020 in three study areas positioned in three adjacent bioclimatic domains located at the interface between the boreal and temperate forest zones in the province of Quebec, Canada (Fig. 1): the balsam fir–yellow birch domain (southern area), the balsam fir–white birch domain (central area), and the black spruce–moss domain (northern area; Berteaux et al. Reference Berteaux, Casajus and de Blois2014). Besides the dominant tree species representative of each bioclimatic domain – Abies balsamea (Pinaceae), Betula alleghaniensis (Betulaceae), B. papyrifera (Betulaceae), Picea mariana (Pinaceae) – boreal species aspen, Populus tremuloides (Salicaceae), and jack pine, Pinus banksiana (Pinaceae), tend to be sparsely present across the three study areas, whereas relatively thermophilic species such as red maple, Acer rubrum (Sapindaceae), yellow birch, B. alleghaniensis, and sugar maple, A. saccharum (Sapindaceae), are found only in the southern area. Forests in these regions are managed, generally using clearcutting, followed by natural regeneration of the harvested stands, with tree planting being used only when natural regeneration is insufficient. Partial cuts are also used, primarily in tolerant hardwood stands of the southern area.
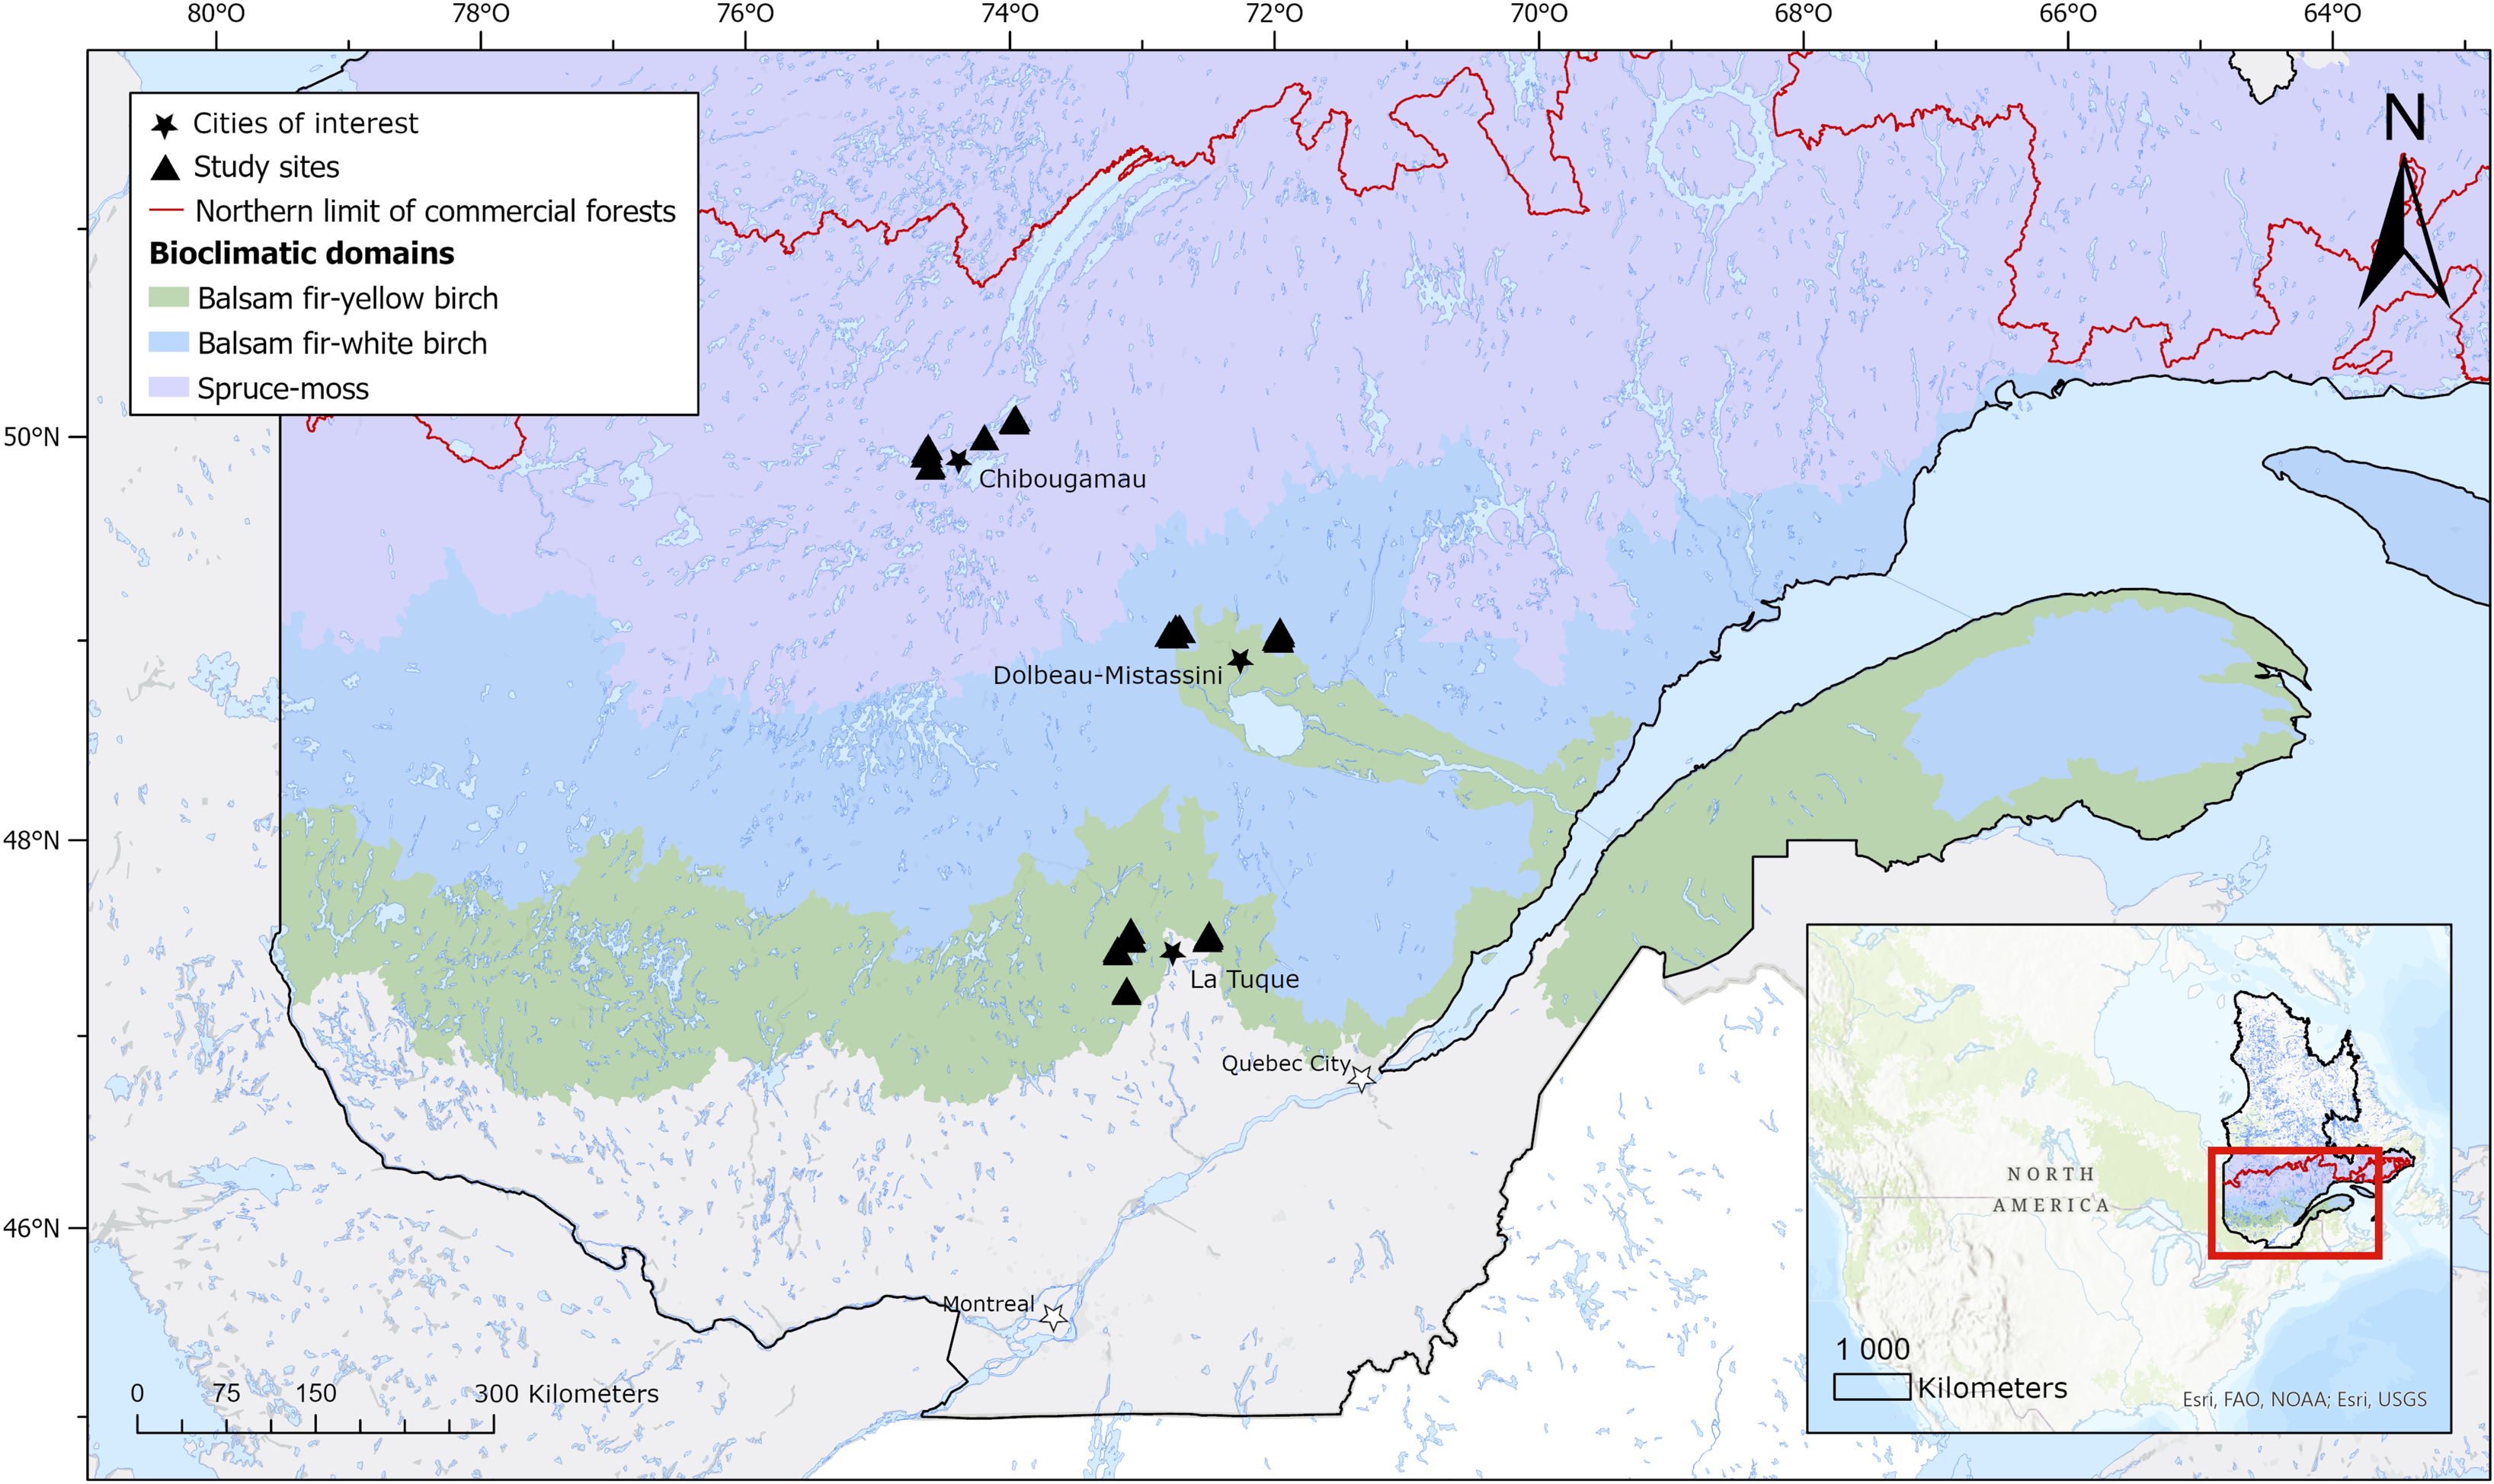
Figure 1. Distribution of study sites (black triangles; n = 33) across three bioclimatic domains in the province of Quebec, Canada.
Thirty-three sampling sites were established within 50 km of three towns, each located in a different bioclimatic domain: 12 sites around La Tuque (47.43° W, 72.78° W), 10 sites around Dolbeau-Mistassini (48.88° N, 72.23° W), and 10 sites around Chibougamau (49.91° N, 74.36° W). These towns, located at least 150 km apart, were chosen because of their proximity to recent logging activities and their geographical location along the gradient. Each sampling site was positioned inside a forest stand that had been clearcut 3–10 years before. The sites were positioned at least 5 km from power lines and agricultural lands to avoid any bias related to their floral resources or pesticides. The sites were also positioned at least 0.5 km apart (generally more than 1 km) to ensure a relative spatial independence in wild bee communities (Zurbuchen et al. Reference Zurbuchen, Landert, Klaiber, Müller, Hein and Dorn2010b). In general, all sites were located on glacial tills with loamy textures and that were more than 50 cm thick over bedrock. On average, for the three areas, from south to north, mean growing season lengths were 215.86 days, 203.43 days, and 179.67 days; mean annual temperatures were 2.93 °C, 1.78 °C, and –4.2 °C; and mean annual precipitations were 958.9 mm, 925.79, and 921 mm, respectively, for the 2014–2020 period (Environment and Climate Change Canada; https://climat.meteo.gc.ca). Mean elevation for the sites of the southern, central, and northern areas was 354 m, 257 m, and 403 m, respectively. Further details on site characteristics, including clearcut year, clearcut size, and ecological type, are provided in Supplementary material, Table S1.
On each site, we established a 2000-m2 plot in which two parallel 40-m-long transects were positioned 20 m apart. To minimise a potential edge effect, a buffer of approximately 50 m was kept around plots from the nearest active secondary road and from the forest margin. Following plot installation, areas were surveyed every two weeks from mid-June to the end of August. During each survey, all the sites of an area were visited within 2–3 consecutive days. At each visit to a plot, two sampling protocols were performed, starting with the gathering of captured insects and followed by a survey of floral resources. In the southern and central study areas, five sampling surveys were performed over the course of the whole summer. In the northern area, only four surveys were carried out because of the shorter growing season.
Wild bee sampling
Bees were collected using coloured pan traps (Fig. 2). We used blue, white, and yellow 12-oz plastic PartyCity party bowls (7.5 inches diameter × 1.5 inches deep; ∼19 cm × ∼4 cm). These colours are known to attract bees and are the most used in North American pan trap sampling (Droege et al. Reference Droege, Tepedino, Lebuhn, Link, Minckley, Chen and Conrad2010; Whitfield et al. Reference Whitfield, Purcell and Daly2013). Three pan traps (one of each colour) were set 10 m apart along the two transects, for a total of six coloured pan traps per plot. For each trap, binder clips were used to secure a bowl approximately 20 cm above the ground in a tomato cage. We prevented rain from filling the bowl and spilling its contents by fastening a transparent plastic saucer on top of the cage, about 20 cm above the bowl. Approximately 120 mL of propylene glycol was used to catch and preserve specimens in the bowls because it does not evaporate like soapy water and slows the decomposition of dead insects (Whitfield et al. Reference Whitfield, Purcell and Daly2013). This also allowed us to leave the traps operational in the field between visits, thereby accounting for the fact that active periods are variable between bee species and can be affected by daily weather (Packer et al. Reference Packer, Genaro and Sheffield2007). At each visit, the traps were reinstalled and refilled with propylene glycol after the caught specimens had been collected from the bowls. This way, traps were continually deployed for the entire growing season, from mid-June to the end of August.
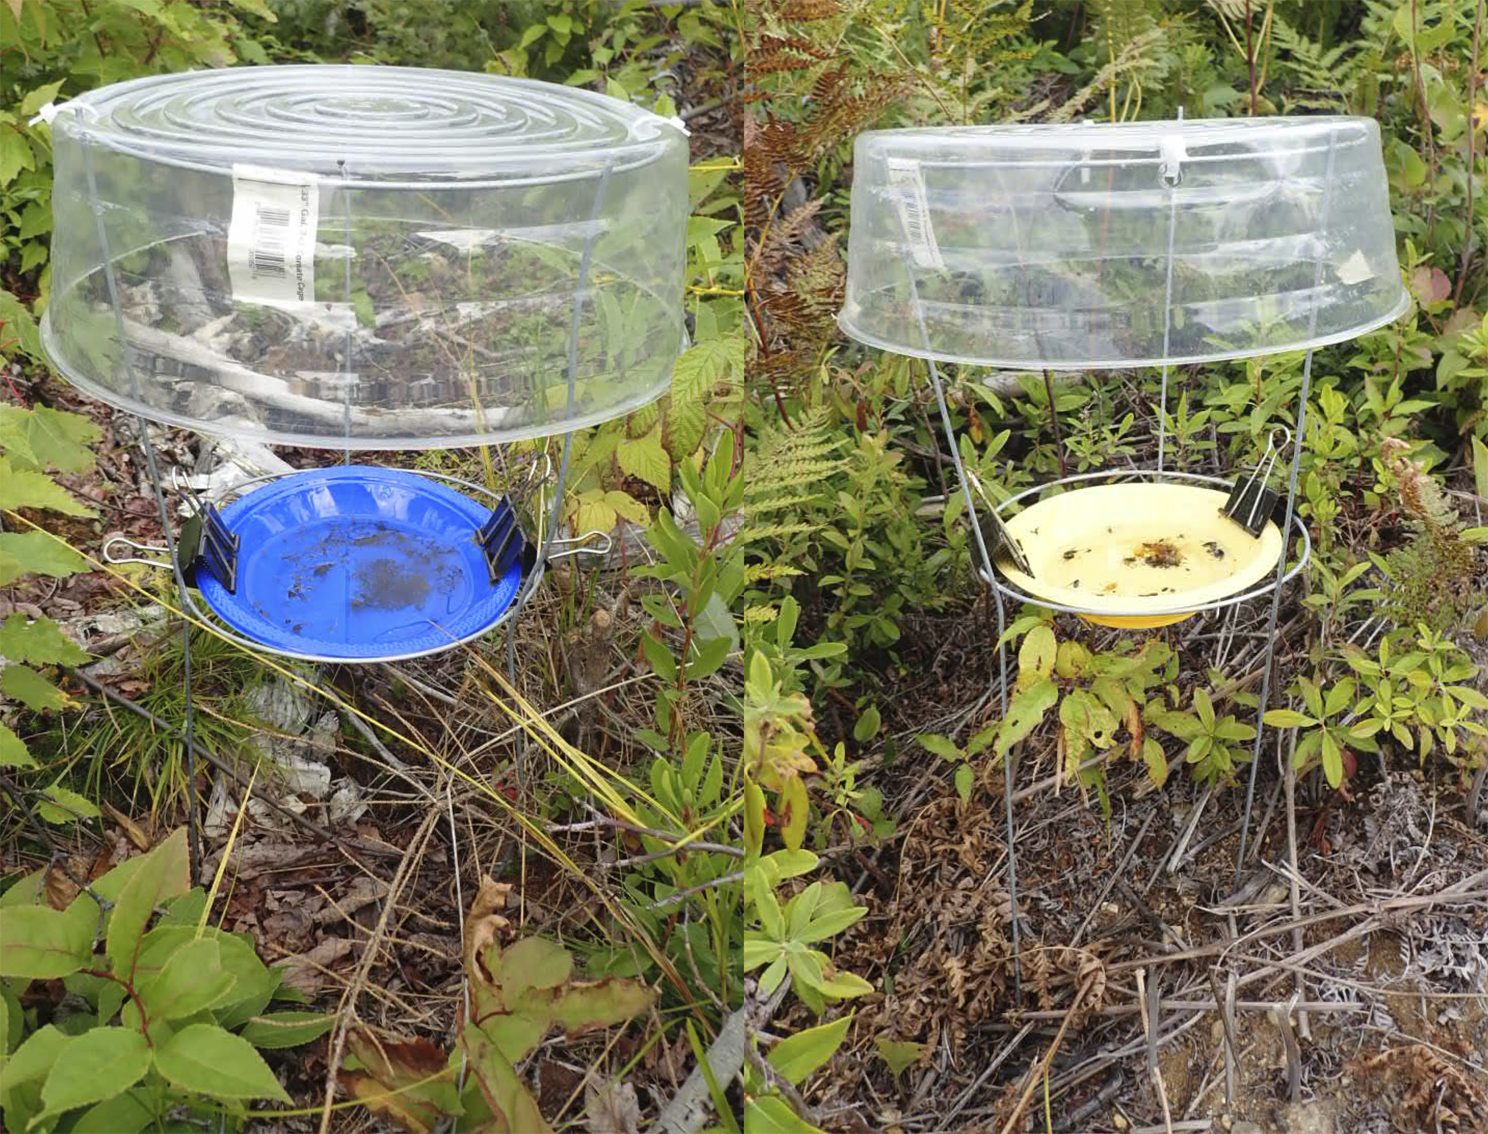
Figure 2. Pictures of the pan-trapping setup shown side-by-side, showing blue and yellow 12-oz plastic bowls secured in a tomato cage with binder clips. Transparent plastic saucers fastened on top of the cages prevented rain from filling the bowls and spilling their contents.
Before identification, captured specimens were stored in 40% ethanol. They were then washed and pinned. All specimens were identified at least to the genus level. Identification was pursued to the species level for the Bombus spp. specimens. Packer et al. (Reference Packer, Genaro and Sheffield2007), Williams et al. (Reference Williams, Thorp, Richardson and Colla2014), Wilson and Carril (Reference Wilson and Carril2015), Ascher and Pickering (Reference Ascher and Pickering2020), and Milam et al. (Reference Milam, Johnson, Andersen, Fassler, Narango and Elkinton2020) were used as keys. Difficult bee genera and Bombus species were confirmed with the assistance of expert taxonomists (see Acknowledgements). Voucher specimens were deposited at Université Laval (laboratory of Valérie Fournier, Québec, Quebec, Canada) and at the Collection d’insectes du Québec (Ministère de l’Agriculture, des Pêcheries et de l’Alimentation du Québec, Québec, Quebec, Canada).
Floral-resource sampling
The floral resources were surveyed following the FIREMON point-intercept sampling method (Caratti Reference Caratti2006). Two transects of 18 sampling rods (3 mm diameter) were established along those of the pan traps, with 2 m between each, for a total of 36 rods per site. Along the transects, we considered each flowering plant species touching a pole as a “hit.” The point-intercept method allowed us to statistically consider the seasonal species turnover in floral composition.
Relative species abundance $Re{l_{abond}}$
of floristic species
$Re{l_{abond}}$
of floristic species $i$
at a site
$i$
at a site $j$
was obtained using the rule of proportion:
$j$
was obtained using the rule of proportion:
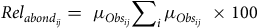 $$Re{l_{abon{d_{ij}}}} = {\mu _{Ob{s_{ij}}}}\sum\nolimits_i {{\mu _{Ob{s_{ij}}}}} \times 100$$
where the mean number of observations ${\mu _{Obs}}$
of each floristic species
${\mu _{Obs}}$
of each floristic species $i$
encountered within the site
$i$
encountered within the site $j$
was calculated as:
$j$
was calculated as:
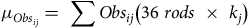 $${\mu _{Ob{s_{ij}}}} = \sum O b{s_{ij}}\left( {36\;rods\; \times \;{k_j}} \right)$$
where $Ob{s_i}$
corresponds to the number of hits for species
$Ob{s_i}$
corresponds to the number of hits for species $i$
within site
$i$
within site $j$
and
$j$
and ${k_j}$
corresponds to the number of surveys that could be done on that same site.
${k_j}$
corresponds to the number of surveys that could be done on that same site.
Flowering plants were identified in the field to the lowest possible taxonomic level using the keys of Frère Marie-Victorin et al. (Reference Frère Marie-Victorin, Brouillet, Rouleau, Goulet, Hay and Brouillet2002), Larivière and Villeneuve (Reference Larivière and Villeneuve2014), Leboeuf (Reference Leboeuf2016), and Brouillet (Reference Brouillet2024). The recurring visits allowed us to confirm the identification of some annual species that were insufficiently developed in early spring.
Data analyses
All analyses were first performed at the genus level for the whole Anthophila group, including bumble bees, and then performed a second time for bumble bees only. Data from the whole sampling season were pooled to best assess the factors influencing spatial variation in wild bee populations. Sites are considered as replicates for the three bioclimatic areas. The effectiveness of the sampling effort was assessed by computing species accumulation curves in the Anthophila data and in the bumble bee data using the function specaccum from the vegan package, version 2.5-7, in R (Oksanen et al. Reference Oksanen, Blanchet, Friendly, Kindt, Legendre and McGlinn2020; R Core Team 2021). Accumulation curves assess the increase in the number of species observed according to the sampling effort. Mean species accumulation curves and their standard deviations were obtained from repeated richness accumulations in random order from 999 permutations or subsampling without replacement (Gotelli and Colwell Reference Gotelli and Colwell2001).
Assessing community diversity
Abundance (number of individuals) and richness (number of genera for Anthophila; number of species for bumble bees) were calculated for each site and were used to compare community diversity between the three areas. Shannon’s H’ diversity index (Hill Reference Hill1973) and Pielou’s J’ evenness index (Pielou Reference Pielou1975) were similarly calculated for each site and were used as diversity indexes to quantify how diversified and equally distributed the communities of wild bees were across sites and along the bioclimatic gradient. The two indexes are complementary, which ensures thorough interpretation of the results. Indexes were computed using the function diversity from the vegan package (Oksanen et al. Reference Oksanen, Blanchet, Friendly, Kindt, Legendre and McGlinn2020). Shannon’s diversity index considers the total number of species (S) and the individual abundance within each species. Compared to a community dominated by a sole species (minimal value of 0), a community with perfectly codominant species will have a maximum index value (lnS, LogS, or Log2S, depending on the choice of the logarithm base) and will be considered the most diversified (Hill Reference Hill1973). Pielou’s evenness index indicates the extent to which species are proportional in numbers on each site along the gradient; a value of 1 indicates a perfectly balanced community (same number of individuals for each species), whereas a value of 0 indicates an unbalanced community where only one species surpasses all the others in numbers (Pielou Reference Pielou1975).
Abundance and richness were compared between areas using generalised linear models with the glm function from the stats package in R (R Core Team 2021), using a log-link function in both models. Overall significance (P < 0.05) of the categorical factor “area” was assessed by performing a likelihood ratio test by comparing the model containing that variable with the null model. For cases where the difference was significant, pairwise comparisons were computed by changing the base level. Shannon’s diversity and Pielou’s evenness indexes were compared between areas using one-way analyses of variance with the lm function from the stats package, version 4.1.1, in R. When results were significant, multiple pairwise comparisons were computed using the joint_tests and emmeans functions from the emmeans package and the cld function from the multcomp package in R (Hothorn et al. Reference Hothorn, Bretz and Westfall2008; Lenth Reference Lenth2021). Shannon’s diversity data were log-transformed to be normally distributed.
Indicator, dominant, or exclusive taxa
The Dufrêne–Legendre indicator species analysis (IndVal index) was used to determine if any and, if so, which Anthophila genera and bumble bee species were significantly associated with any of the studied bioclimatic domains along the latitudinal gradient. The IndVal index calculates the indicator value of species within clusters of sites by combining their specificity (highest mean abundance within a group compared to the other groups) and fidelity (presence in most sites of that group; Dufrêne and Legendre Reference Dufrêne and Legendre1997). The index values were computed using the indval function from the labdsv package, version 2.0-1, in R (Roberts Reference Roberts2019). The IndVal index was also applied to the floristic data to corroborate the observed floristic assemblage within each area with published findings.
To highlight the differences in Anthophila abundance among sites and along the gradient, we also plotted heatmaps with the pheatmap package in R (Kolde Reference Kolde2019). The heatmaps allowed us to visualise the distribution of highly dominant taxa and to identify Anthophila genera and bumble bee species that were exclusively captured in specific parts of the gradient.
Influence of floristic composition
We used a redundancy analysis, a constrained ordination (Legendre et al. Reference Legendre, Legendre and Legendre1998), to determine the effect of floristic composition on Anthophila and bumble bee communities along our gradient. The Hellinger transformation was applied to our bee matrix using the decostand function from the vegan package in R (Oksanen et al. Reference Oksanen, Blanchet, Friendly, Kindt, Legendre and McGlinn2020). The Hellinger transformation is particularly well suited for species abundance data because it gives low weights to variables with low counts and many zeros (Legendre and Gallagher Reference Legendre and Gallagher2001). The tested explanatory variables were floristic species, based on their relative abundance on each site. Colinearity of our redundancy analysis model was assessed using variance inflation factor scores. The step function (from the vegan package) was used with forward selection, based on both the Akaike information criterion and the Bayesian information criterion, to determine which floristic species best explain bee community composition. We performed an analysis of variance–like permutation test on our redundancy analysis to assess the significance of constraints and axis using the anova.cca function from the vegan package. Anthophila genera and bumble bee species with fewer than 10 individuals were not used in the analysis, given their scarcity. Floristic species with a relative abundance less than 1% were also omitted.
Results
General results
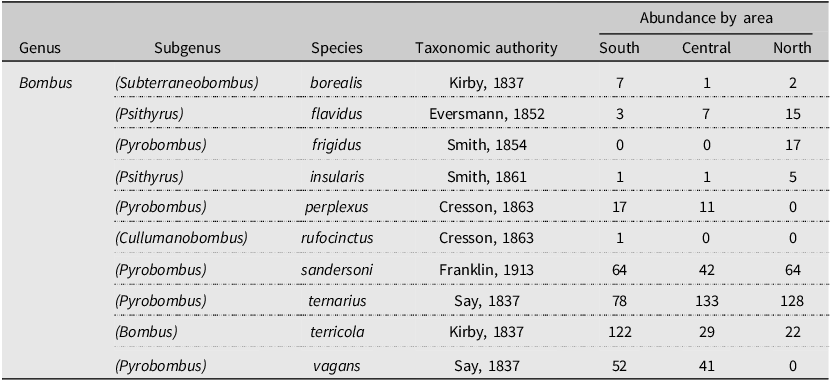
Overall, we retrieved a total of 328 samples from the pan traps in the southern area, 263 from the central area, and 264 from the northern area. The number of consecutive trap days for each area was 76, 71, and 55, respectively. We collected a total of 4255 specimens belonging to the Anthophila group, corresponding to 21 genera in five families (Table 1). The most abundant genus was Lasioglossum spp. Curtis (Hymenoptera: Halictidae), with a total of 2760 individuals, representing 65% of all collected bees. Bumble bees (Bombus spp.) represented the second most abundant genus (20%), with 863 individuals. All other Anthophila genera combined represented only 15% of all collected individuals. Within bumble bees, 10 species were found (Table 2). Bombus ternarius Say was the most abundant, with 339 individuals, representing 39% of all caught bumble bees. Bombus terricola Kirby was the second most abundant, with 173 individuals (20%), followed by B. sandersoni Franklin, with 170 individuals (19.7%), and B. vagans Say, with 93 individuals (10.78%).
Table 1. List of the 21 bee genera collected along a bioclimatic gradient in the province of Quebec, Canada, from early June to late August 2020, with their abundance in each studied area. The genera are sorted according to their corresponding family.
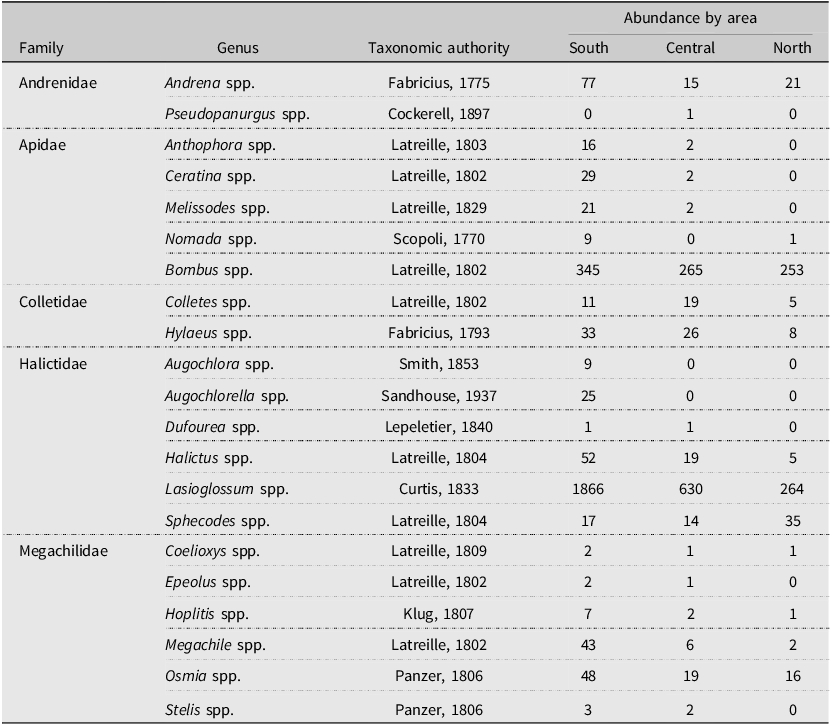
Table 2. List of the 10 bumble bee species collected along a bioclimatic gradient in the province of Quebec, Canada, from early June to late August 2020, with their abundance for each studied area. Species are presented in alphabetical order.
Sampling effort
The accumulation curves for both taxonomic levels, Anthophila genera (Supplementary material, Fig. S1A) and bumble bee species (Supplementary material, Fig. S1C), reached saturation, which indicates a sufficient sampling effort. Accumulation curves by area reached a plateau only in the southern area for Anthophila genera (Supplementary material, Fig. S1B) and in the northern area for the bumble bee species (Supplementary material, Fig. S1D), which suggests that richness in the other areas might have been slightly higher if more sampling sites were established.
Community diversity
Anthophila communities
For the Anthophila communities, diversity measures decreased from the south to the north of the gradient. According to the results of our generalised linear model analyses, the effect of area was significant in both the models for abundance and richness. Abundance (P-value < 0.0001; Fig. 3A) and genera richness (P-value < 0.0001; Fig. 3B) both differed significantly between all three areas. Total abundance was higher in the southern area, with 2616 individuals, followed by the central area, with 1027 individuals, and the northern area, with 612 individuals. A mean abundance of 218 ± 79.09 (standard deviation) was obtained for the southern area, 102.7 ± 44.16 (standard deviation) for the central area, and 55.64 ± 23.59 (standard deviation) for the northern area. Total genera richness was higher in the southern area (20 genera), followed by the central area (18 genera), and the northern area (13 genera). A mean richness of 11.58 ± 2.84 (standard deviation) was obtained for the southern area, 8.2 ± 2.57 (standard deviation) for the central area, and 5.9 ± 1.3 (standard deviation) for the northern area.
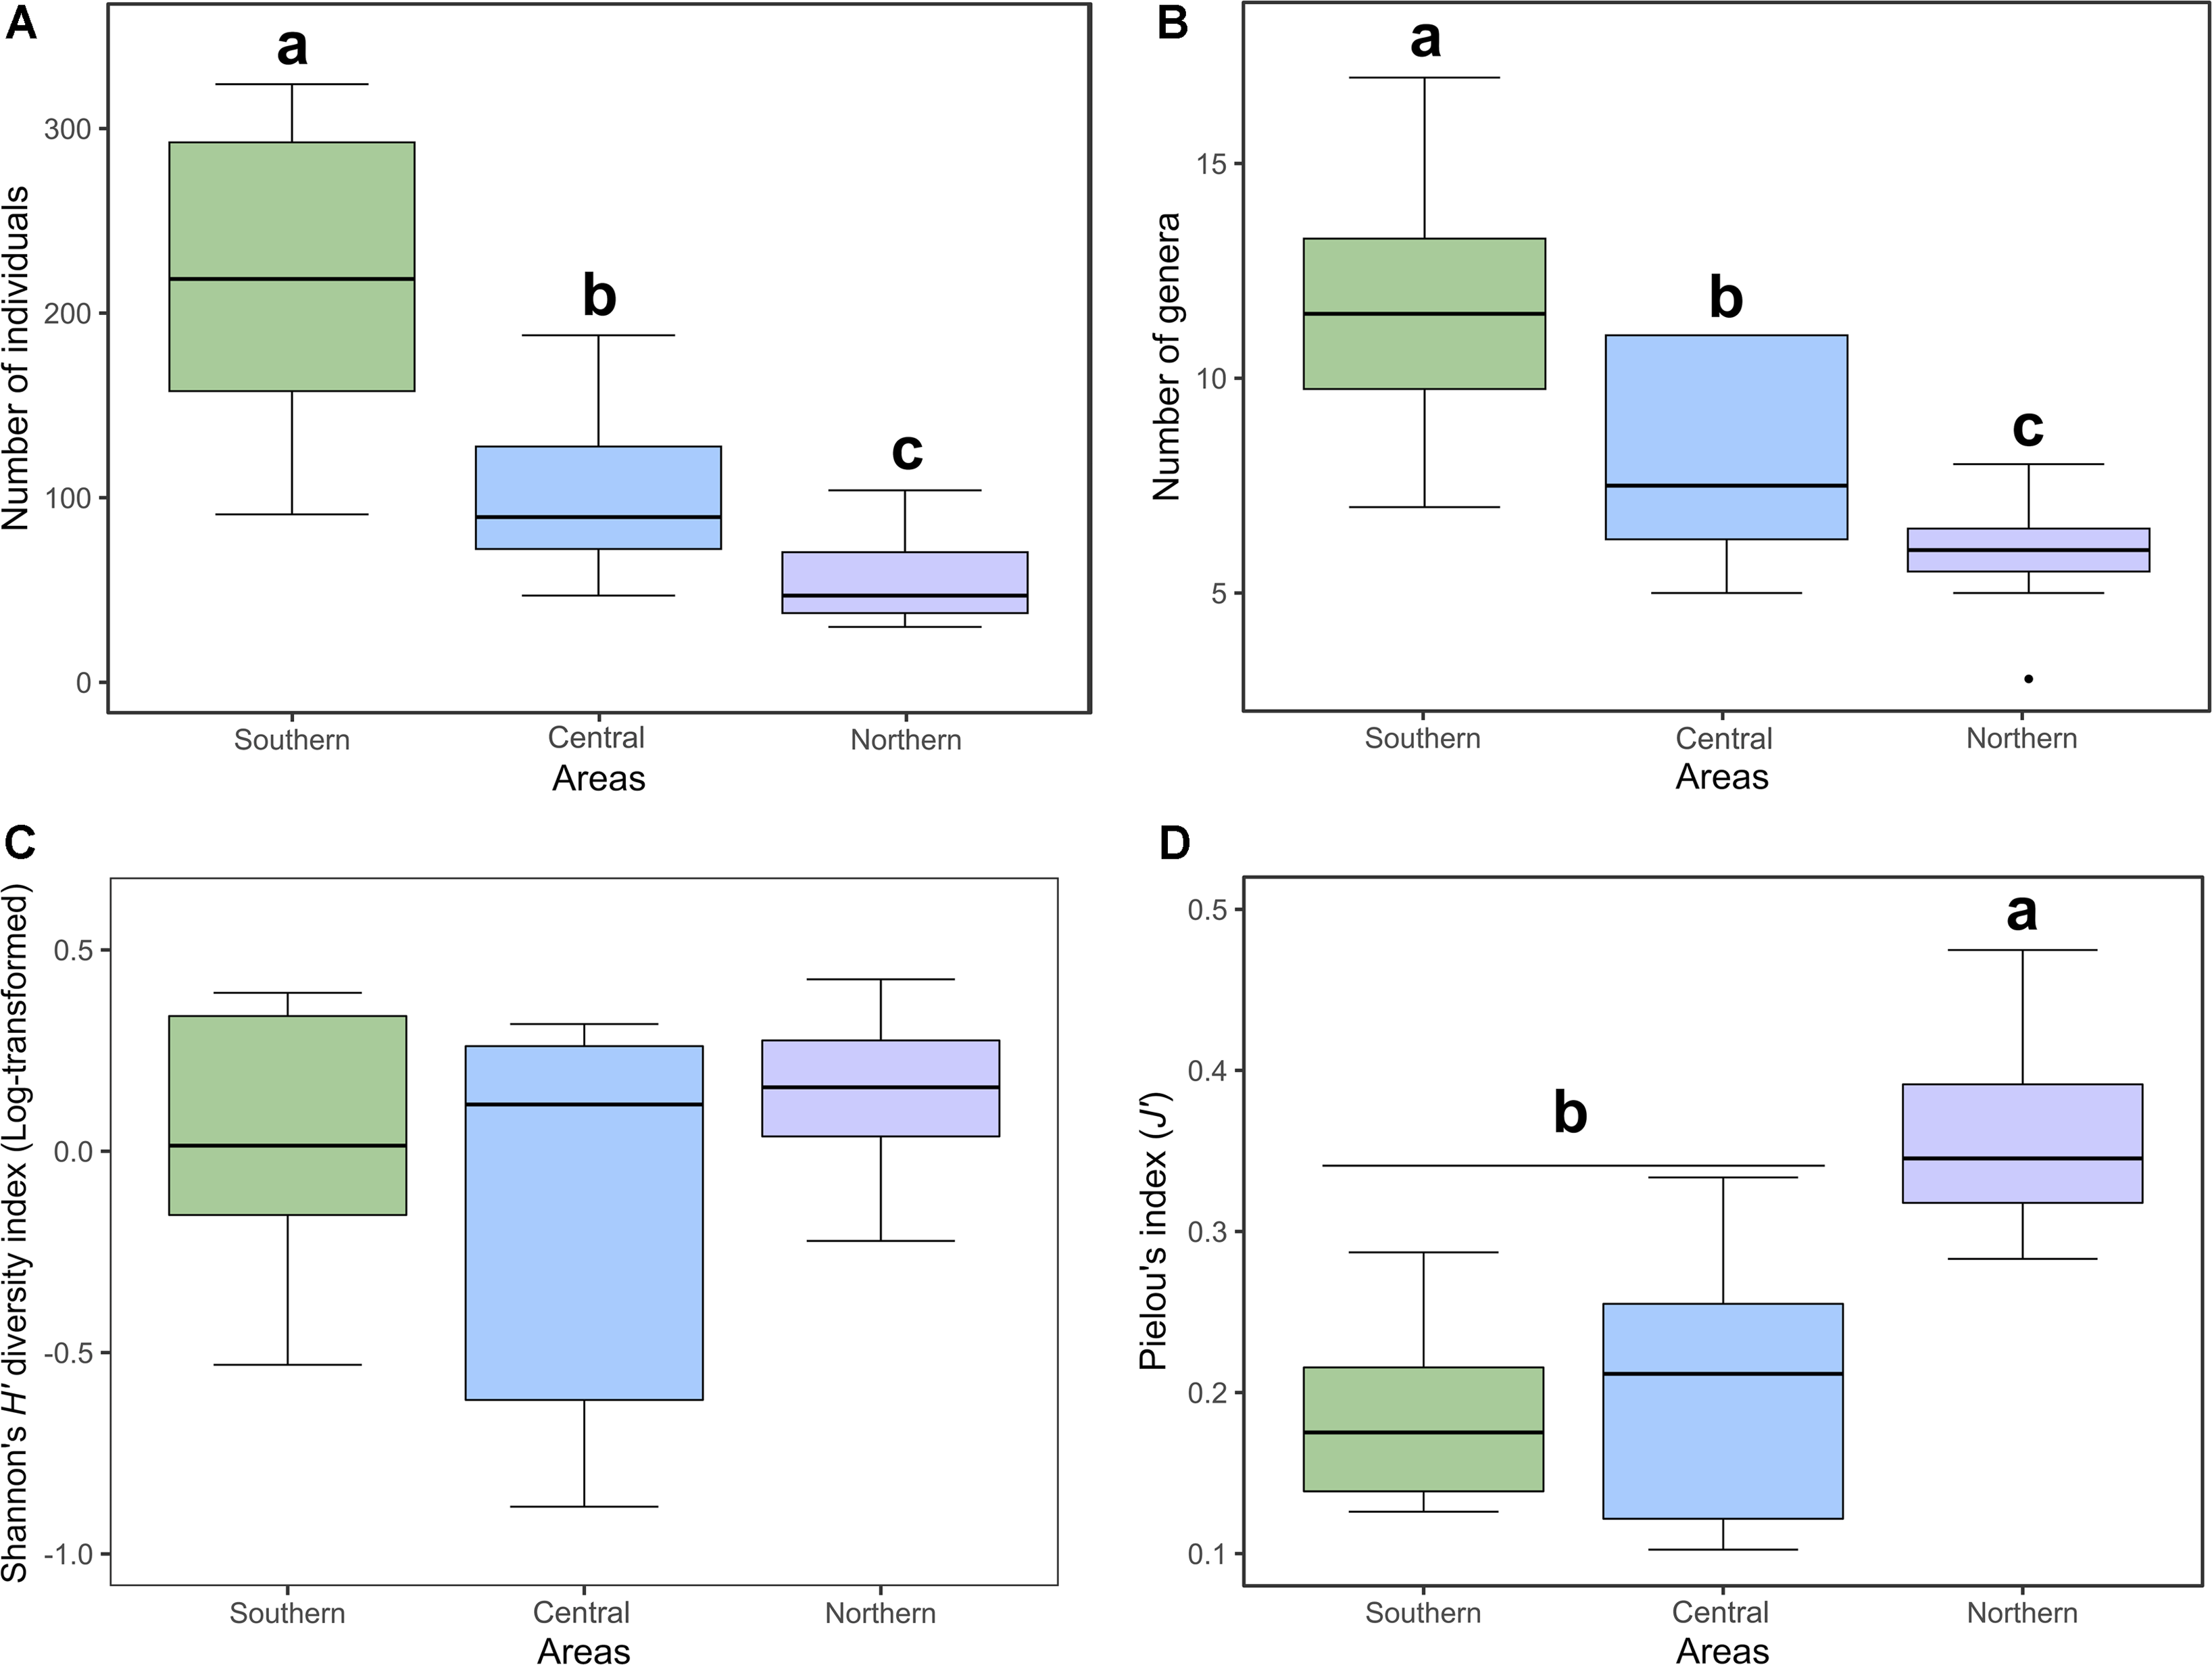
Figure 3. A, Mean abundance; B, mean genera richness; C, mean Shannon’s diversity index; and D, mean Pielou’s evenness index of Anthophila from clearcut sites in three studied areas along a bioclimatic gradient in the province of Quebec, Canada. Letters represent the post hoc result (P-value < 0.0001), showing significant differences between the three areas for diversity measures (abundance and richness) and for Pielou’s evenness index. Shannon’s diversity index data were log-transformed to be normally distributed and to respect homogeneity of variance.
Regarding diversity indexes, Shannon’s diversity for Anthophila communities did not differ significantly between the areas (F 2,30 = 1.354, P-value = 0.2736; Fig. 3C). Mean Shannon’s diversity was 1.07 ± 0.31 (standard deviation) in the southern area, 0.95 ± 0.4 (standard deviation) in the central area, and 1.18 ± 0.22 (standard deviation) in the northern area. However, Pielou’s evenness index differed significantly between the northern area and the two other areas (F 2,30 = 24.029, P-value < 0.0001; Fig. 3D), which were themselves not significantly different from one another. Anthophila community evenness was highly unbalanced along the whole gradient (J’ < 0.5). Mean Pielou’s evenness was 0.19 ± 0.05 (standard deviation) for the southern area, 0.2 ± 0.08 (standard deviation for the central area, and 0.36 ± 0.06 (standard deviation) for the northern area.
Bumble bee communities
For the bumble bee communities, the generalised linear model analyses indicate that the effect of area was significant only for the abundance model (P-value = 0.0247; Fig. 4A). Bumble bee species richness showed no relationship to area (P-value = 0.6756; Fig. 4B). Abundance was higher in the southern area than in the northern area (P-value = 0.0070). A total abundance of 345 individuals was obtained in the southern area, 265 individuals in the central area, and 253 individuals in the northern area. Mean abundance of bumble bees was 28.75 ± 17.14 (standard deviation) for the southern area, 26.5 ± 34.97 (standard deviation) for the central area, and 23 ± 9.24 (standard deviation) for the northern area. Total species richness was similar between areas, with nine species in the southern area, eight species in the central area, and seven species in the northern area. A mean richness of 4.75 ± 1.42 (standard deviation) was obtained for the southern area, 4 ± 1.89 (standard deviation) for the central area, and 4.64 ± 0.81 (standard deviation) for the northern area.
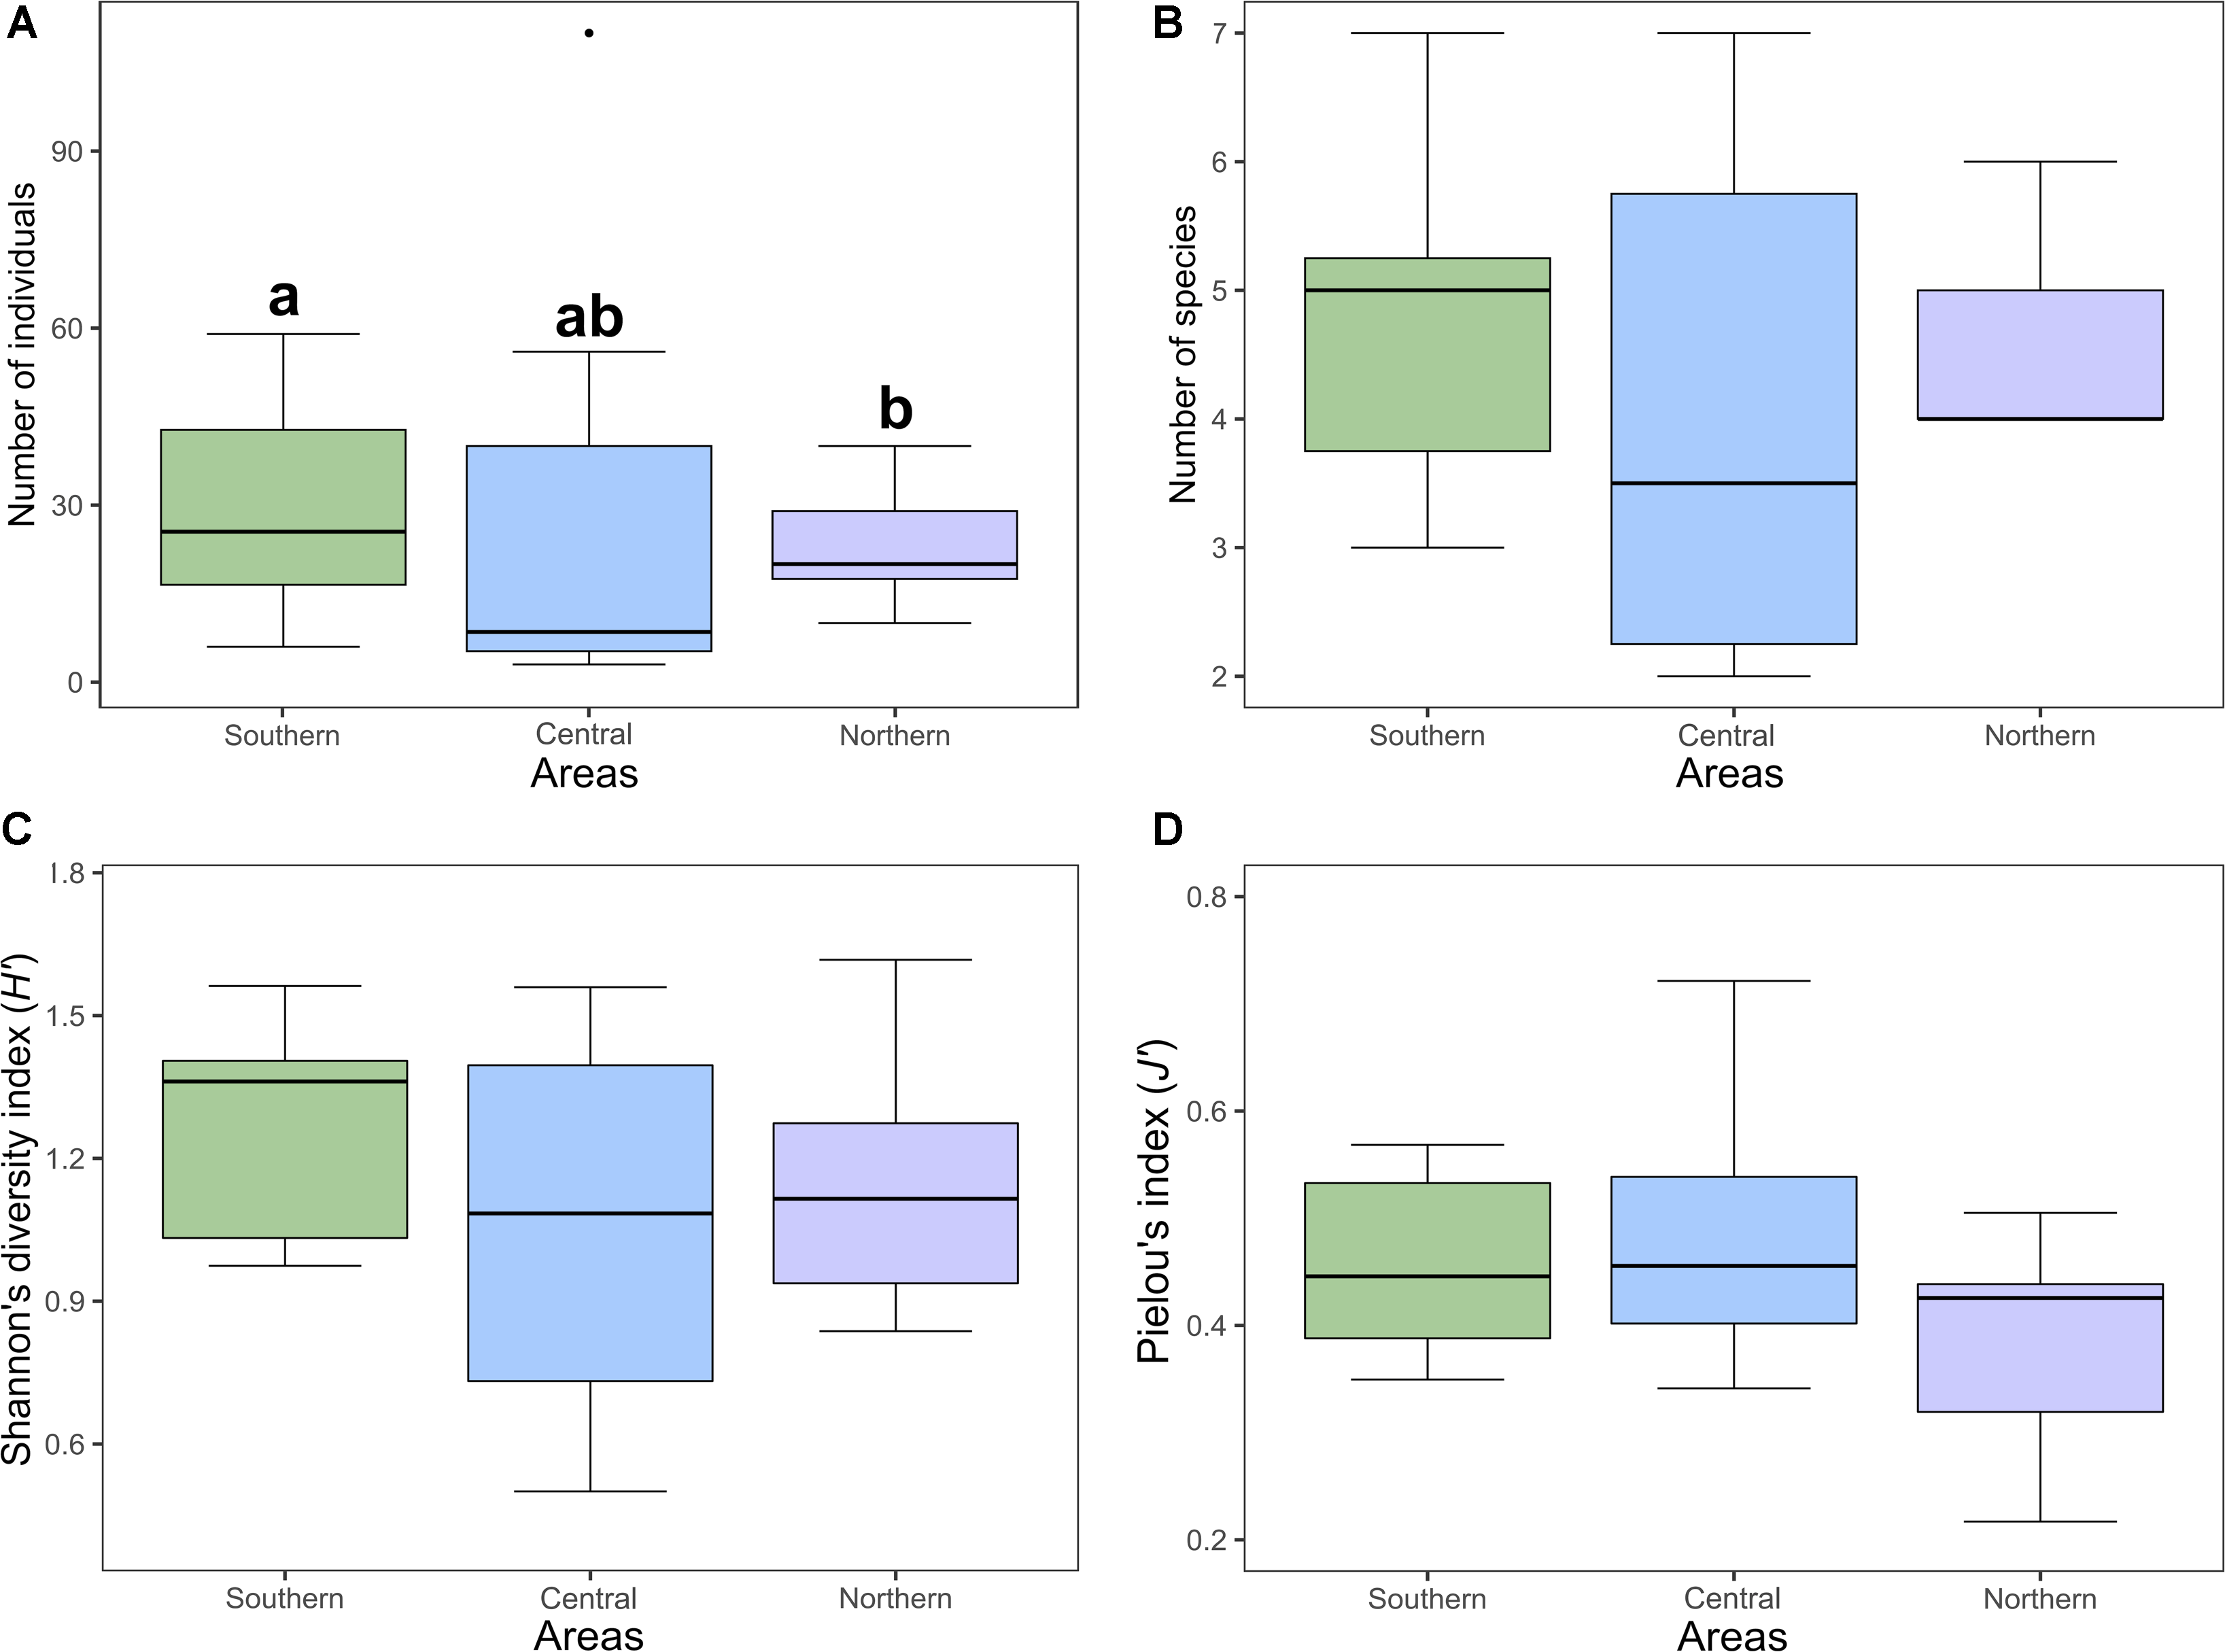
Figure 4. A, Mean abundance; B, mean species richness; C, mean Shannon’s diversity index; and D, mean Pielou’s evenness index of bumble bees (Bombus spp.) from clearcut sites in three studied areas along a bioclimatic gradient in the province of Quebec, Canada. Letters represent the post hoc result (P-value < 0.0001), showing significant differences between the southern and northern areas for abundance.
Diversity indexes showed no relation between bumble bee communities and area. Neither Shannon’s diversity index (F 2,30 = 1.598, P-value = 0.219; Fig. 4C) nor Pielou’s evenness index (F 2,30 = 2.864, P-value = 0.0727; Fig. 4D) differed significantly between areas. Mean Shannon’s diversity was 1.27 ± 0.21 (standard deviation) for the southern area, 1.06 ± 0.38 (standard deviation) for the central area, and 1.13 ± 0.24 (standard deviation) for the northern area. Mean Pielou’s evenness was 0.46 ± 0.77 (standard deviation) for the southern area, 0.49 ± 0.12 (standard deviation) for the central area, and 0.39 ± 0.09 (standard deviation) for the northern area.
Indicator, dominant, and exclusive taxa
Anthophila communities
Results from the IndVal analysis of Anthophila identified 10 genera as indicators in the southern area (Ceratina Latreille, Augochlorella Sandhouse, Andrena Fabricius, Lasioglossum, Megachile Latreille, Halictus Latreille, Melissodes Latreille, Osmia Panzer, Nomada Scopoli, and Augochlora spp. Smith), with Ceratina spp. having the highest value (Table 3). The central and northern areas had a single indicator genus each, Colletes spp. Latreille and Sphecodes spp. Latreille, respectively.
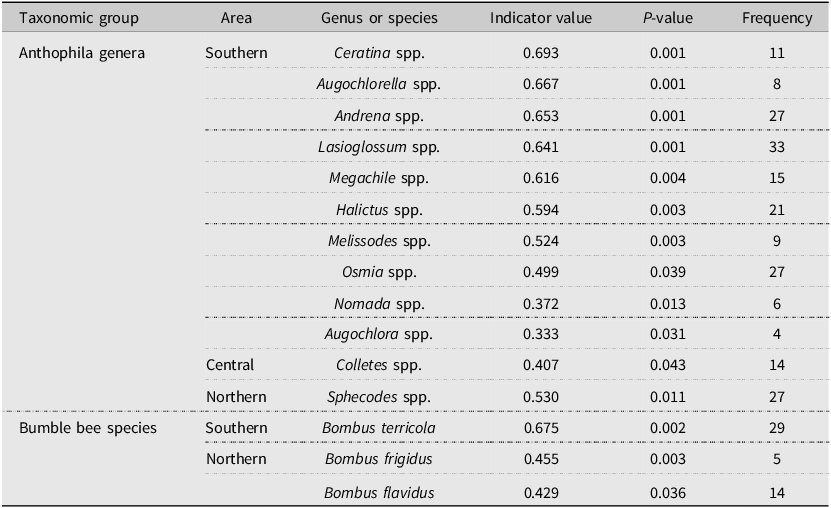
Table 3. List of indicators obtained from the Dufrêne–Legendre indicator species analysis for Anthophila genera and bumble bee species from clearcuts along a bioclimatic gradient in the province of Quebec, Canada. Studied areas were clustered. Taxonomic groups are sorted according to their indicator value and area.
According to the abundance heatmap (Supplementary material, Fig. S2), Lasioglossum and Bombus spp. were predominant genera along the whole gradient. Lasioglossum had the highest abundance at every site except one, where it was surpassed by the genus Bombus. Lasioglossum spp. was particularly abundant in the southern area and the first half of the central area (Supplementary material, Fig. S2A). Distribution patterns of the 19 other genera (Supplementary material, Fig. S2B) showed that, overall, the three study areas shared 11 genera. Six genera were found in the southern and central areas but not in the northern area; these were Anthophora Latreille, Ceratina, Dufourea Lepeletier, Epeolus Latreille, Melissodes, and Stelis spp. Panzer). Two genera – Augochlora and Augochlorella spp. – were collected exclusively in the southern area, and the only specimen of Pseudopanurgus spp. Cockerell was caught in the central area. Nomada spp. was collected in limited numbers in both in the southern and northern areas but was absent from the central area.
Bumble bee communities
For the bumble bee communities, results from the IndVal index analysis identified B. terricola as the only indicator species in the southern area (Table 3). Bombus frigidus Smith and B. flavidus Eversmann were indicator species in the northern area. No indicator species was detected in the central area.
According to the abundance heatmap of bumble bee species (Supplementary material, Fig. S2C), B. ternarius was a dominant species along the latitudinal gradient, as were B. sandersoni and B. terricola, which were also well distributed along the whole gradient. Bombus terricola was generally dominant in the southern area, whereas B. sandersoni tended to dominate in the central and northern areas. Overall, the three areas shared six species. Two species were collected only in a specific area – B. frigidus in the northern area and B. rufocinctus Cresson in the southern area. Bombus perplexus Cresson and B. vagans were found in both the southern and central areas but not in the northern area.
Influence of floristic composition
Floristic composition along the gradient
A total of 51 floristic species were recorded during our sampling season (Supplementary material, Table S2). The most abundant species along the whole gradient were Kalmia angustifolia Linnaeus (Ericaceae) (10.35%), Vaccinium angustifolium Aiton (Ericaceae) (10.12%), Prunus pensylvanica Linnaeus fils (Rosaceae) (9.76%), Diervilla lonicera Miller (Caprifoliaceae) (9.44%), and Rubus idaeus Linnaeus (Rosaceae) (8.61%).
In the southern area, 36 floristic plant species were recorded. Floristic composition of sites within the area was dominated by Prunus pensylvanica (16%), Rubus idaeus (15.56%), and Diervilla lonicera (11.41%). Five floristic species were significant indicators (IndVal index, P-value < 0.05) of the southern area: Prunus pensylvanica, Rubus idaeus, Eurybia macrophylla (Linnaeus) Cassini (Asteraceae), Maianthemum canadense Desfontaines (Asparagaceae), and Fallopia cilinodis (Michaux) Holub (Polygonaceae). See Supplementary material, Table S3 for the complete indicator species list with values.
In the central area, 36 floristic plant species were recorded. Floristic composition of sites within the area was dominated by Kalmia angustifolia (13.55%), Diervilla lonicera (11.39%), Vaccinium angustifolium (11.11%), and Cornus canadensis Linnaeus (Cornaceae) (10.84%). Nine floristic species were significant indicators (IndVal index, P-value < 0.05) of the central area: Viburnum cassinoides Linnaeus (Viburnaceae), Cornus canadensis, Linnaea borealis Linnaeus (Caprifoliaceae), Diervilla lonicera, Clintonia borealis (Aiton) Rafinesque (Liliaceae), Ilex mucronata (Linnaeus) M. Powell, V. Savolainen and S. Andrews (Aquifoliaceae), Aralia hispida Ventenat (Araliaceae), Epigaea repens Linnaeus (Ericaceae), and Viola spp. Linnaeus (Violaceae).
In the northern area, 20 floristic plant species were recorded. Floristic composition of sites within the area was dominated by Rhododendron groenlandicum (Oeder) Kron and Judd (Ericaceae) (23.83%), Kalmia angustifolia (23.74%), and Vaccinium angustifolium (23.74%). Three species were significant indicators (IndVal index, P-value < 0.05) of the northern area: Rhododendron groenlandicum, Gaultheria hispidula (Linnaeus), Muhlenberg ex Bigelow (Ericaceae), and Chamaedaphne calyculata (Linnaeus) Moench (Ericaceae).
Anthophila communities
Using the redundancy analysis, we found that only three of the 51 floristic species sampled along our gradient significantly described the relative abundance of Anthophila genera: Diervilla lonicera (DIE, F 1,29 = 13.649, P-value < 0.001), Rhododendron groenlandicum (LEG, F 1,29 = 5.722, P-value = 0.001), and Vaccinium angustifolium (VAA, F 1,29 = 2.178, P-value = 0.076). Only the first axis of the redundancy analysis was significant (Axis 1: F 1,29 = 19.202, P-value < 0.001). Our model explained 42.6% of Anthophila genera relative abundance, with an adjusted R 2-value of 0.36, leaving approximately 57.4% unexplained. The genera omitted from the analysis due to their scarcity in the dataset (n < 10) were Augochlora, Coelioxys Latreille, Dufourea, Epeolus, Hoplitis (Klug), Nomada, Pseudopanurgus, and Stelis spp.
As presented in Figure 5A, the genera Lasioglossum and Bombus spp. tend to be associated with different floral communities. The relative abundance of Lasioglossum spp. seems related to the presence of Diervilla lonicera. The genera Bombus and Sphecodes spp. are positively correlated with sites from the northern area, and their relative abundance appears, respectively, correlated with Vaccinium angustifolium and Rhododendron groenlandicum.
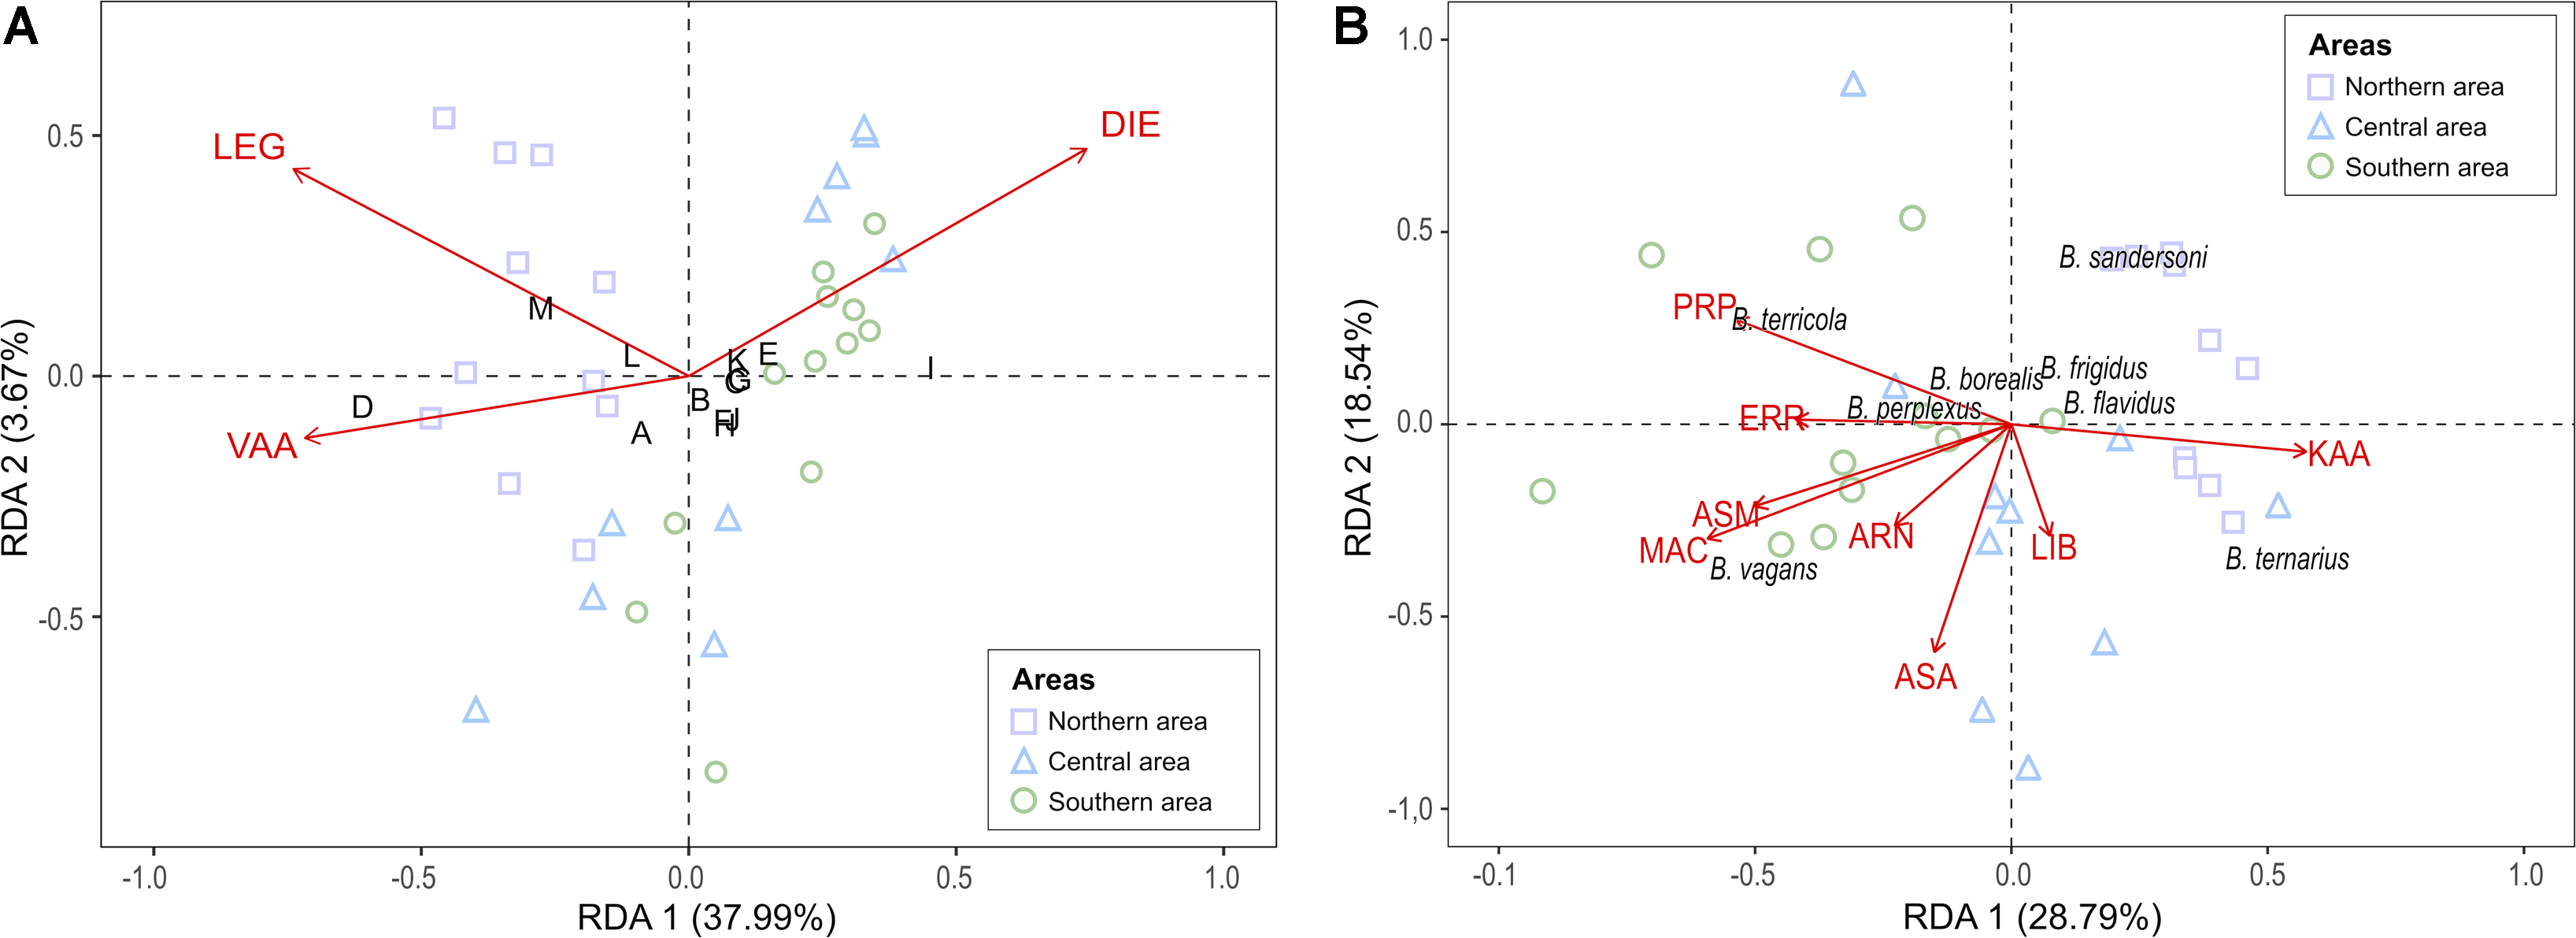
Figure 5. Redundancy analysis (RDA) triplots of Hellinger-transformed bee data explained by A, three significant plant species for Anthophila, and B, eight significant plant species for bumble bees. Anthophila genera code (panel A) appears in black capital letters: A, Andrena spp.; B, Anthophora spp.; C, Augochlorella spp.; D, Bombus spp.; E, Ceratina spp.; F, Colletes spp.; G, Halictus spp.; H, Hylaeus spp.; I, Lasioglossum spp.; J, Megachile spp.; K, Melissodes spp.; L, Osmia spp.; and M, Sphecodes spp. The floristic species code appears in red capital letters: ARN, Aralia nudicaulis; ASA, Oclemena acuminate; ASM, Eurybia macrophylla; ERR, Acer rubrum; DIE, Diervilla lonicera; KAA, Kalmia angustifolia; LEG, Rhododendron groenlandicum; LIB, Linnaea borealis; MAC, Maianthemum canadense; PRP, Prunus pensylvanica; and VAA, Vaccinium angustifolium. Site icon colour and shape reflect the three areas.
Bumble bee communities
Using redundancy analysis, we found that eight of the 51 floristic species sampled along the gradient significantly described the relative abundance of bumble bee species: Maianthemum canadense (F 1,22 = 9.216, P-value < 0.001), Eurybia macrophylla (F 1,22 = 6.450, P-value < 0.001), Prunus pensylvanica (F 1,22 = 5.761, P-value < 0.001), Oclemena acuminata (Michaux) Greene (Asteraceae) (F 1,22 = 4.902, P-value < 0.001), Kalmia angustifolia (F 1,22 = 3.481, P-value = 0.009), Aralia nudicaulis Linnaeus (Araliaceae) (F 1,22 = 3.289, P-value = 0.013), Linnaea borealis (F 1,22 = 2.475, P-value = 0.042), and Acer rubrum Linnaeus (Sapindaceae) (F 1,22 = 2.382, P-value = 0.053). The first three axes of the redundancy analysis were significant (Axis 1: F 1,24 = 17.839, P-value < 0.001; Axis 2: F 1,24 = 11.485, P-value < 0.001; Axis 3: F 1,24 = 6.062, P-value = 0.001). Our model explained 61.2% of bumble bee species relative abundance, with an adjusted R 2-value of 0.48, leaving approximately 38.7% unexplained. The bumble bee species omitted from the analysis due to their scarcity in the dataset (n < 10) were B. rufocinctus and B. insularis Smith.
As presented in Fig. 5B, a strong negative correlation is suggested between B. terricola and B. ternarius. They are, respectively, linked with Prunus pensylvanicus and Kalmia angustifolia. A strong negative correlation is also suggested between B. sandersoni and B. vagans. Bombus sandersoni, B. frigidus, and B. flavidus are positively correlated with sites from the northern area. Also, because it is the bumble bee species correlated with the most floral species, including two significant indicators of the southern area (i.e., M. canadense, E. macrophylla, and A. nudicaulis), B. vagans seems positively correlated with floristic species from temperate forests.
Discussion
To our knowledge, our study is the first to assess the influence of a regional bioclimatic gradient on wild bee communities in managed boreal forests. We found that climate and floristic resources are key factors driving community assemblages for both Anthophila and bumble bees along this spatial gradient. Our hypothesis that wild bee diversity would be inversely related to latitude was partially supported at the genus level for Anthophila communities and at the species level for bumble bee communities. Communities at both taxonomic levels were unbalanced along the gradient, which could be explained by the dominance of a small number of competitive taxa. We were able to identify taxa that were exclusive to, or representative of, specific areas. Finally, several floristic species were found to play a determinant role in the relative abundance of some taxa within wild bee communities.
Anthophila communities
Our hypothesis was partially supported in the assessment of Anthophila genera. Abundance and richness were both inversely related to latitude, but Shannon’s diversity index and Pielou’s evenness index were not. The north–south latitudinal gradient in forest characteristics in the province of Quebec is driven by climatic conditions that become colder towards the north, with a corresponding decrease in forest productivity (Berteaux et al. Reference Berteaux, Casajus and de Blois2014). Indeed, in the study areas, post-clearcut vegetation development tended to be more advanced in the southern part of the gradient (L.C.G., unpublished data). In most study sites oin the southern area, a young tree layer had already established, which often overshadowed the understorey herbaceous and shrub layers. In contrast, in the northern area, the vegetation was low and consisted mainly of shrubs and herbaceous plants. The arborescent layer was not yet well developed because of the slow growth of the coniferous species typical of this climate. These observations in clearcuts indicate that the growth speed of regeneration and time-lapse between ecological successions depend on the latitudinal situation along the spatial gradient (De Frenne et al. Reference De Frenne, Graae, Brunet, Shevtsova, De Schrijver and Chabrerie2012). It is possible that wild bee communities observed in clearcuts in the south of our gradient are typical of more advanced forest succession than those observed in clearcuts to the north.
The floristic composition of the sites of the northern area had up to 1.8 times fewer floristic species than those in the other two, more southerly areas. Moreover, it was largely dominated by three Ericaceous shrubs: Rhododendron groenlandicum, Kalmia angustifolia, and Vaccinium angustifolium. The more diverse floral communities in the southern and central areas of our gradient may have played a determinant role in Anthophila genera richness and abundance. As shown previously, a sufficient variety of floral species must be present to support diverse and abundant wild bee communities (Venjakob et al. Reference Venjakob, Klein, Ebeling, Tscharntke and Scherber2016). Floristic diversity is known to be critical to ensuring overlapping blooms throughout the entire season (Fortuin and Gandhi Reference Fortuin and Gandhi2021). Anthophila taxa have variable seasonal activity periods, from early season to full season, and sometimes emerge and forage within only a short 4- to 6-week window (Packer et al. Reference Packer, Genaro and Sheffield2007). Bloom patterns are therefore one of the environmental factors limiting Anthophila taxa within open forest habitats (Fortuin and Gandhi Reference Fortuin and Gandhi2021).
The Pielou’s evenness index results indicate that, in the southern and central areas, Anthophila communities are composed of a high number of rare genera but are dominated by one genus – Lasioglossum spp. In the northern area, Anthophila communities are also composed of a great number of rare genera, but the genus Lasioglossum spp. is codominant with the genus Bombus. Lasioglossum spp. was by far the most abundant genus captured in clearcuts in our study. This genus is very common throughout temperate and boreal forests (Packer et al. Reference Packer, Genaro and Sheffield2007) and was also the most abundant genus caught in other wild bee studies in clearcuts (Romey et al. Reference Romey, Ascher, Powell and Yanek2007; Gibbs Reference Gibbs2010; Proctor et al. Reference Proctor, Nol, Burke and Crins2012; Fortuin and Gandhi Reference Fortuin and Gandhi2021). The genus Lasioglossum has been described as indicative of recently disturbed landscapes and open forested areas (Proctor et al. Reference Proctor, Nol, Burke and Crins2012), mainly because most Lasioglossum species are ground nesters (Wilson and Carril Reference Wilson and Carril2015). Proctor et al. (Reference Proctor, Nol, Burke and Crins2012), Rubene et al. (Reference Rubene, Schroeder and Ranius2015), and Fortuin and Gandhi (Reference Fortuin and Gandhi2021) observed that regenerating clearcuts tend to favour groundnesting bee groups because the percent cover of warm bare soil is consistently higher there than what is found in undisturbed forests.
It is noteworthy that results of the Anthophila analyses would have been different if performed at the species level. For example, the lower evenness levels observed in the southern and central areas are probably explained in part by the disproportionate abundance of Lasioglossum spp. in those areas. However, because this is known to be a speciose genus (Gibbs Reference Gibbs2010), the evenness index results could have changed dramatically and even flipped (i.e., they could have been higher in the southern area) if the analyses were made at the species level.
Bumble bee communities
Regarding the bumble bee communities, our hypothesis was only partially supported at the species level for the genus Bombus. Neither richness nor Shannon’s diversity index decreased from south to north, revealing no significant relationship with latitude. The results of Pielou’s evenness index, which also did not differ significantly between areas, showed that bumble bee communities along the entire gradient are generally composed of a few competitive species that dominate a greater number of rare species. Only abundance decreased from the southern to the northern area.
Many factors could explain the absence of the expected decreasing relationship of richness to latitude. For example, bumble bees are known to include species that are particularly well adapted to colder climates (Williams et al. Reference Williams, Thorp, Richardson and Colla2014), and some have even been seen foraging at temperatures close to the freezing point (Goulson Reference Goulson2010). Their large bodies are covered by thick and dense coats of hairs. They can shiver their flight muscles, which allows them to produce their own body heat (Heinrich and Esch Reference Heinrich and Esch1994). The flight muscles can disconnect from the wings, thereby saving energy during shivering (Whitfield et al. Reference Whitfield, Purcell and Daly2013; Wilson and Carril Reference Wilson and Carril2015).
Despite these genus-level adaptations, individual bumble bee species tend to be limited to relatively narrow climatic niches (Kerr et al. Reference Kerr, Pindar, Galpern, Packer, Potts and Roberts2015). This may explain how, instead of finding decreasing bumble bee diversity as latitude increased, we observed relatively distinct species assemblages in each bioclimatic domain. Different bumble bee species are known to be differentially distributed in eastern Canada (Laverty and Harder Reference Laverty and Harder1988).
All bumble bee species that we observed were already recognised as part of the boreal fauna, but we lacked a clear understanding of how these boreal species sort themselves within the boreal habitat. Our study reveals specific niche requirements for bumble bees within this important zone, which is one of the most vulnerable to climate change. The distribution of bumble bee abundances in our captures suggests that B. sandersoni, B. terricola, and B. ternarius may possess larger climatic niches than the other bumble bee species within our study areas: those three species were well distributed along the entire gradient. Only a few observations of B. sandersoni have been documented to date in the province of Quebec (Bumble Bee Watch 2022; Global Biodiversity Information Facility 2022); our results provide substantial new information on the distribution of this species and its potential response to climate, B. sandersoni being the third most abundant species among our bumble bee captures.
Bombus terricola was the second most abundant species among our bumble bee specimens. This was unexpected because the species has been reported to be declining in parts of its range in North America (Grixti et al. Reference Grixti, Wong, Cameron and Favret2009; Cameron et al. Reference Cameron, Lozier, Strange, Koch, Cordes, Solter and Griswold2011; Bartomeus et al. Reference Bartomeus, Ascher, Gibbs, Danforth, Wagner, Hedtke and Winfree2013). NatureServe (2022) and the IUCN Red List (Hatfield et al. Reference Hatfield, Jepsen, Thorp, Richardson and Colla2015) register B. terricola as “vulnerable.” The status of B. terricola in the province of Quebec is undetermined because a large part of the species’ distribution range remains sparsely surveyed. Pathogen spillover from domestic bumble bees used in greenhouses and pesticides such as neonicotinoids are correlated with the species’ decline throughout its North American range and appear to be some of the most significant threats to this species (Hopwood et al. Reference Hopwood, Vaughan, Shepherd, Biddinger, Mader, Black and Mazzacano2012; Szabo et al. Reference Szabo, Colla, Wagner, Gall and Kerr2012). However, the remote environment examined in the present study may still be exempt from such influences. The important presence of B. terricola in clearcuts in our study also implies that this kind of altered environment could support the species, at least in the short term, by providing an adequate habitat that is free of those threats. Competition with other bumble bees has also been shown to impact this vulnerable species: Butler et al. (Reference Butler, Lage, Dobrin, Staples, Venturini, Frank and Drummond2021) observed that the array of floral species visited by B. terricola in Michigan, United States of America, consistently narrowed when B. ternarius was also present. As a well-known generalist, B. ternarius has a wide dietary breadth, which includes most of the floral species favoured by B. terricola (Butler et al. Reference Butler, Lage, Dobrin, Staples, Venturini, Frank and Drummond2021). In our study, the abundance of B. terricola was greater than that of B. ternarius on most sites in the southern area, indicating that dense regeneration in clearcuts might attenuate the competitive impact of B. ternarius. Furthermore, B. ternarius is a common bumble bee species in the northeastern boreal forest and is known to inhabit many open woodland and wetland habitats within natural and disturbed landscapes (Williams et al. Reference Williams, Thorp, Richardson and Colla2014). Our results suggest that although B. ternarius has great versatility in terms of choice of habitat and floral resources, B. terricola can outcompete it in clearcuts with a dense arborescent floral composition.
Effect of sampling method
Concerns about potential biases from using only the pan-trapping method for bee collection are raised throughout the literature (e.g., Popic et al. Reference Popic, Davila and Wardle2013; Fortuin and Gandhi Reference Fortuin and Gandhi2021). Captures of bumble bees and other large-bodied bee groups are limited when using pan traps (Romey et al. Reference Romey, Ascher, Powell and Yanek2007), and thus, the dominance of small bees within our samples (∼75% of captures) may be related to this bias. A combination of pan trapping and netting is suggested to obtain samples with the greatest diversity of bees in flower-rich areas (Tucker and Rehan Reference Tucker and Rehan2017). However, hand netting was impractical in most of our settings, considering the density and height of the vegetation on multiple sites. Also, unpredictable weather during our tight-scheduled surveys shortened the time frame during which hand netting was feasible because this method cannot be performed when the vegetation is wet (Popic et al. Reference Popic, Davila and Wardle2013). Another inadvertent sampling bias is mentioned in the literature. Because bees use visual colour cues to navigate to flowers, some studies warn that traps visible from a greater distance are more likely to catch bees than traps that have visual obstructions (Song et al. Reference Song, Niu, Stöcklin, Chen, Peng, Gao and Sun2015). Bees might also be underrepresented in traps that are situated in understorey vegetation when foraging resources are available in the canopy (Urban-Mead et al. Reference Urban-Mead, Muñiz, Gillung, Espinoza, Fordyce and van Dyke2021). Even though visual obstruction and canopy resources did not seem to affect our catch rates, caution suggests accounting for possible bias, and therefore, the wild bee diversity metrics documented here should not be considered absolute.
Conclusion
For the two taxonomic levels investigated, our study demonstrates that latitudinal dissimilarities in climate and floristic composition are determinant factors of wild bee community assemblages within boreal forest clearcuts. In general, wild bee communities were unbalanced in that they tended to be dominated by a few taxa. The results of the present study also show that disturbed forests are a critical habitat for bees and that this information could be used in forest planning, in particular by using interventions that might affect floral diversity.
As revealed by the results, abundance and richness of Anthophila genera and abundance of bumble bee species were inversely related to latitude in clearcuts along a bioclimatic gradient in the province of Quebec. However, this relationship was not observed for the richness of bumble bee communities. Divergent results between the two taxonomic levels suggest an underlying complexity that may be masked by the predominance of a sole taxon. Bees of each genus will need to be analysed at the species level because wild bee taxa are highly diverse in terms of their life histories, social structures, and nesting biology (Michener Reference Michener2007; Wilson and Carril Reference Wilson and Carril2015). Also, to maintain pollination services and advise policymakers regarding the migration capabilities of these taxa in the context of climate change, further research is needed to deepen basic knowledge on wild bee dispersion ranges within the boreal forest. To our knowledge, the present study provides the first assessment of wild bees in clearcuts in the province of Quebec and could be used as a baseline for the study of environmental changes on these organisms.
Supplementary material
To view supplementary material for this article, please visit https://doi.org/10.4039/tce.2025.11.
Acknowledgements
The authors thank the Ministère des Ressources naturelles et des Forêts and Quebec’s Fonds Vert (Plan d’action 2013–2020 sur les changements climatiques) for financial support. They also thank Michel Campagna, Marc-Antoine Lambert, Hugo Tremblay, Samuel Lauzon, Karine Thériault, Patrick Dumontier, Annie Gagnon, Lorraine Parent, Céline Blanchet, and Martin Seto at the Direction de la recherche forestière (MFFP) for providing logistical support in the field; Alexis Quirion, Stéphanie Lefebvre-Ruel, and Ludovic Leclerc for assisting in data collection and sample treatment; Gaétan Daigle and Isabelle Auger for statistical support; Martin Breton, Joseph Moisan-De Serres, and Anne Leboeuf for their help with bee identification and validation; and Guylaine Guillemette and Olivier Slupik for their insights on methodological feasibility.
Authors’ contributions
The study was conceived by L.C.-G. and managed by V.F. and M.B. L.C.-G. conducted fieldwork, compiled data, analysed the study components, and wrote the manuscript’s first draft. All authors contributed to the manuscript.
Funding information
The Ministère des Ressources naturelles et des Forêts and Quebec’s Fonds Vert (Plan d’action 2013–2020 sur les changements climatiques).
Competing interests
The authors declare that they have no competing interests.


 Open access