


Hemlock, Tsuga canadensis (Linnaeus) Carrière (Pinaceae), in eastern Canada is embattled with the nonnative, invasive hemlock woolly adelgid, Adelges tsugae Annand (Hemiptera: Adelgidae), which was introduced from Japan to the eastern United States of America on ornamental plantings likely before 1951 (Stoetzel Reference Stoetzel2002; Havill et al. Reference Havill, Montgomery, Yu, Shiyake and Caccone2006). Since 2012 and 2017, increasing areas of the Canadian provinces of Ontario and Nova Scotia, respectively, have become infested by the adelgid as the pest continues to spread northwards into Canada (North American Plant Protection Organization 2012; Canadian Food Inspection Agency 2017). The province of New Brunswick may well be the next Canadian jurisdiction to be invaded by A. tsugae due to the proximity of the infestation in Nova Scotia and southeastern Hancock County, Maine, United States of America (Cornelson et al. Reference Cornelson, MacQuarrie and Lee2024; Maine Department of Agriculture, Conservation and Forestry 2024). This insect can kill trees within 3–15 years after infestation (McClure Reference McClure1990; Limbu et al. Reference Limbu, Keena and Whitmore2018; Emilson and Stastny Reference Emilson and Stastny2019), and we have noted similar rates of decline and loss in Nova Scotia.
A key feature of adelgid management is early detection of infestations to mitigate impacts to high-value stands (Emilson and Stastny Reference Emilson and Stastny2019; Derry et al. Reference Derry, DiGasparro, MacQuarrie and Sturba2024; Venette et al. Reference Venette, Ambourn, Aukema, Jetton and Petrice2024). However, early detection of A. tsugae is difficult because the pest often establishes in the upper canopy of hemlock (Evans and Gregoire Reference Evans and Gregoire2007). Several methods have been developed to assess the upper canopy (Fidgen et al. Reference Fidgen, Whitmore and Turgeon2015, Reference Fidgen, Whitmore and Turgeon2016; Kirtane et al. Reference Kirtane, Dietschler, Bittner, Lefebvre, Celis and O’Connor2022; Sanders et al. Reference Sanders, Tardani, Locher, Geller and Partridge2023). Of these, ball sampling is the only active method for surveying the upper canopy for A. tsugae (Fidgen et al. Reference Fidgen, Whitmore and Turgeon2016, Reference Fidgen, Fournier, Whitmore, MacQuarrie and Turgeon2019). This technique involves shooting Velcro®-fitted balls at the canopy to trap adelgid wool (Fidgen et al. Reference Fidgen, Whitmore and Turgeon2016, Reference Fidgen, Fournier, Whitmore, MacQuarrie and Turgeon2019; MacQuarrie et al. Reference MacQuarrie, Fidgen and Turgeon2021). Ball sampling is popular with community scientists (e.g., Entomological Society of America 2019; Ford Reference Ford2023; Prince Edward Island Invasive Species Council 2022) and is presently in use in Canada and the United States of America as a complementary approach to other methods of detecting the adelgid (MacQuarrie et al. Reference MacQuarrie, Fidgen and Turgeon2021).
We have noticed that the slingshot used to sample hemlock with Velcro-covered balls is sometimes different than the one used in earlier research on the technique (e.g., HyperDog Ball Launcher®; Hyper Pet, Wichita, Kansas, United States of America), but the ball used to sample the trees is the same. Specifically, some people use more powerful slingshots such as the Notch BigShot® (Greensboro, North Carolina, United States of America) instead of the HyperDog. These powerful slingshots are used to throw heavy beanbags into the tree canopy for the installation of climbing ropes. The slingshot’s greater power provided an opportunity to develop a stronger and larger (i.e., greater Velcro surface area) sampling device for this style of slingshot. Although a doubling of the surface area of Velcro on a 5.6-cm racquetball (25 cm2 versus 48 cm2) did not improve the detection of adelgid wool (Fidgen et al. Reference Fidgen, Fournier, Whitmore, MacQuarrie and Turgeon2019), a much larger ball with increased mass and a much larger surface area of Velcro may improve wool detection. The main objective of this study was to see if a heavier and larger ball would improve the detectability of the hemlock woolly adelgid. We also evaluated the number of sampling attempts needed to detect wool for the first time (“first wool”), the total time needed to detect first wool, and the total time needed to take 10 samples per tree with a 7.5-cm-diameter device. This ball was compared to a 5-cm-diameter wooden ball, which is similar in size to the racquetball used in earlier research.
Work was carried out in May–July 2022, 2023, and 2024 at six sites in southwestern Nova Scotia, Canada, that have A. tsugae infestations (Fig. 1). Trees at these sites were selected based on their having no to moderate infestations of A. tsugae on asymptomatic trees, as determined by visual assessment of the foliage from the ground, pole pruning of five to ten 30-cm-long branch tips from the lower half of the crown, or both methods. We sampled 20, 18, and 10 trees in 2022, 2023, and 2024, respectively, for a total of 48 trees.
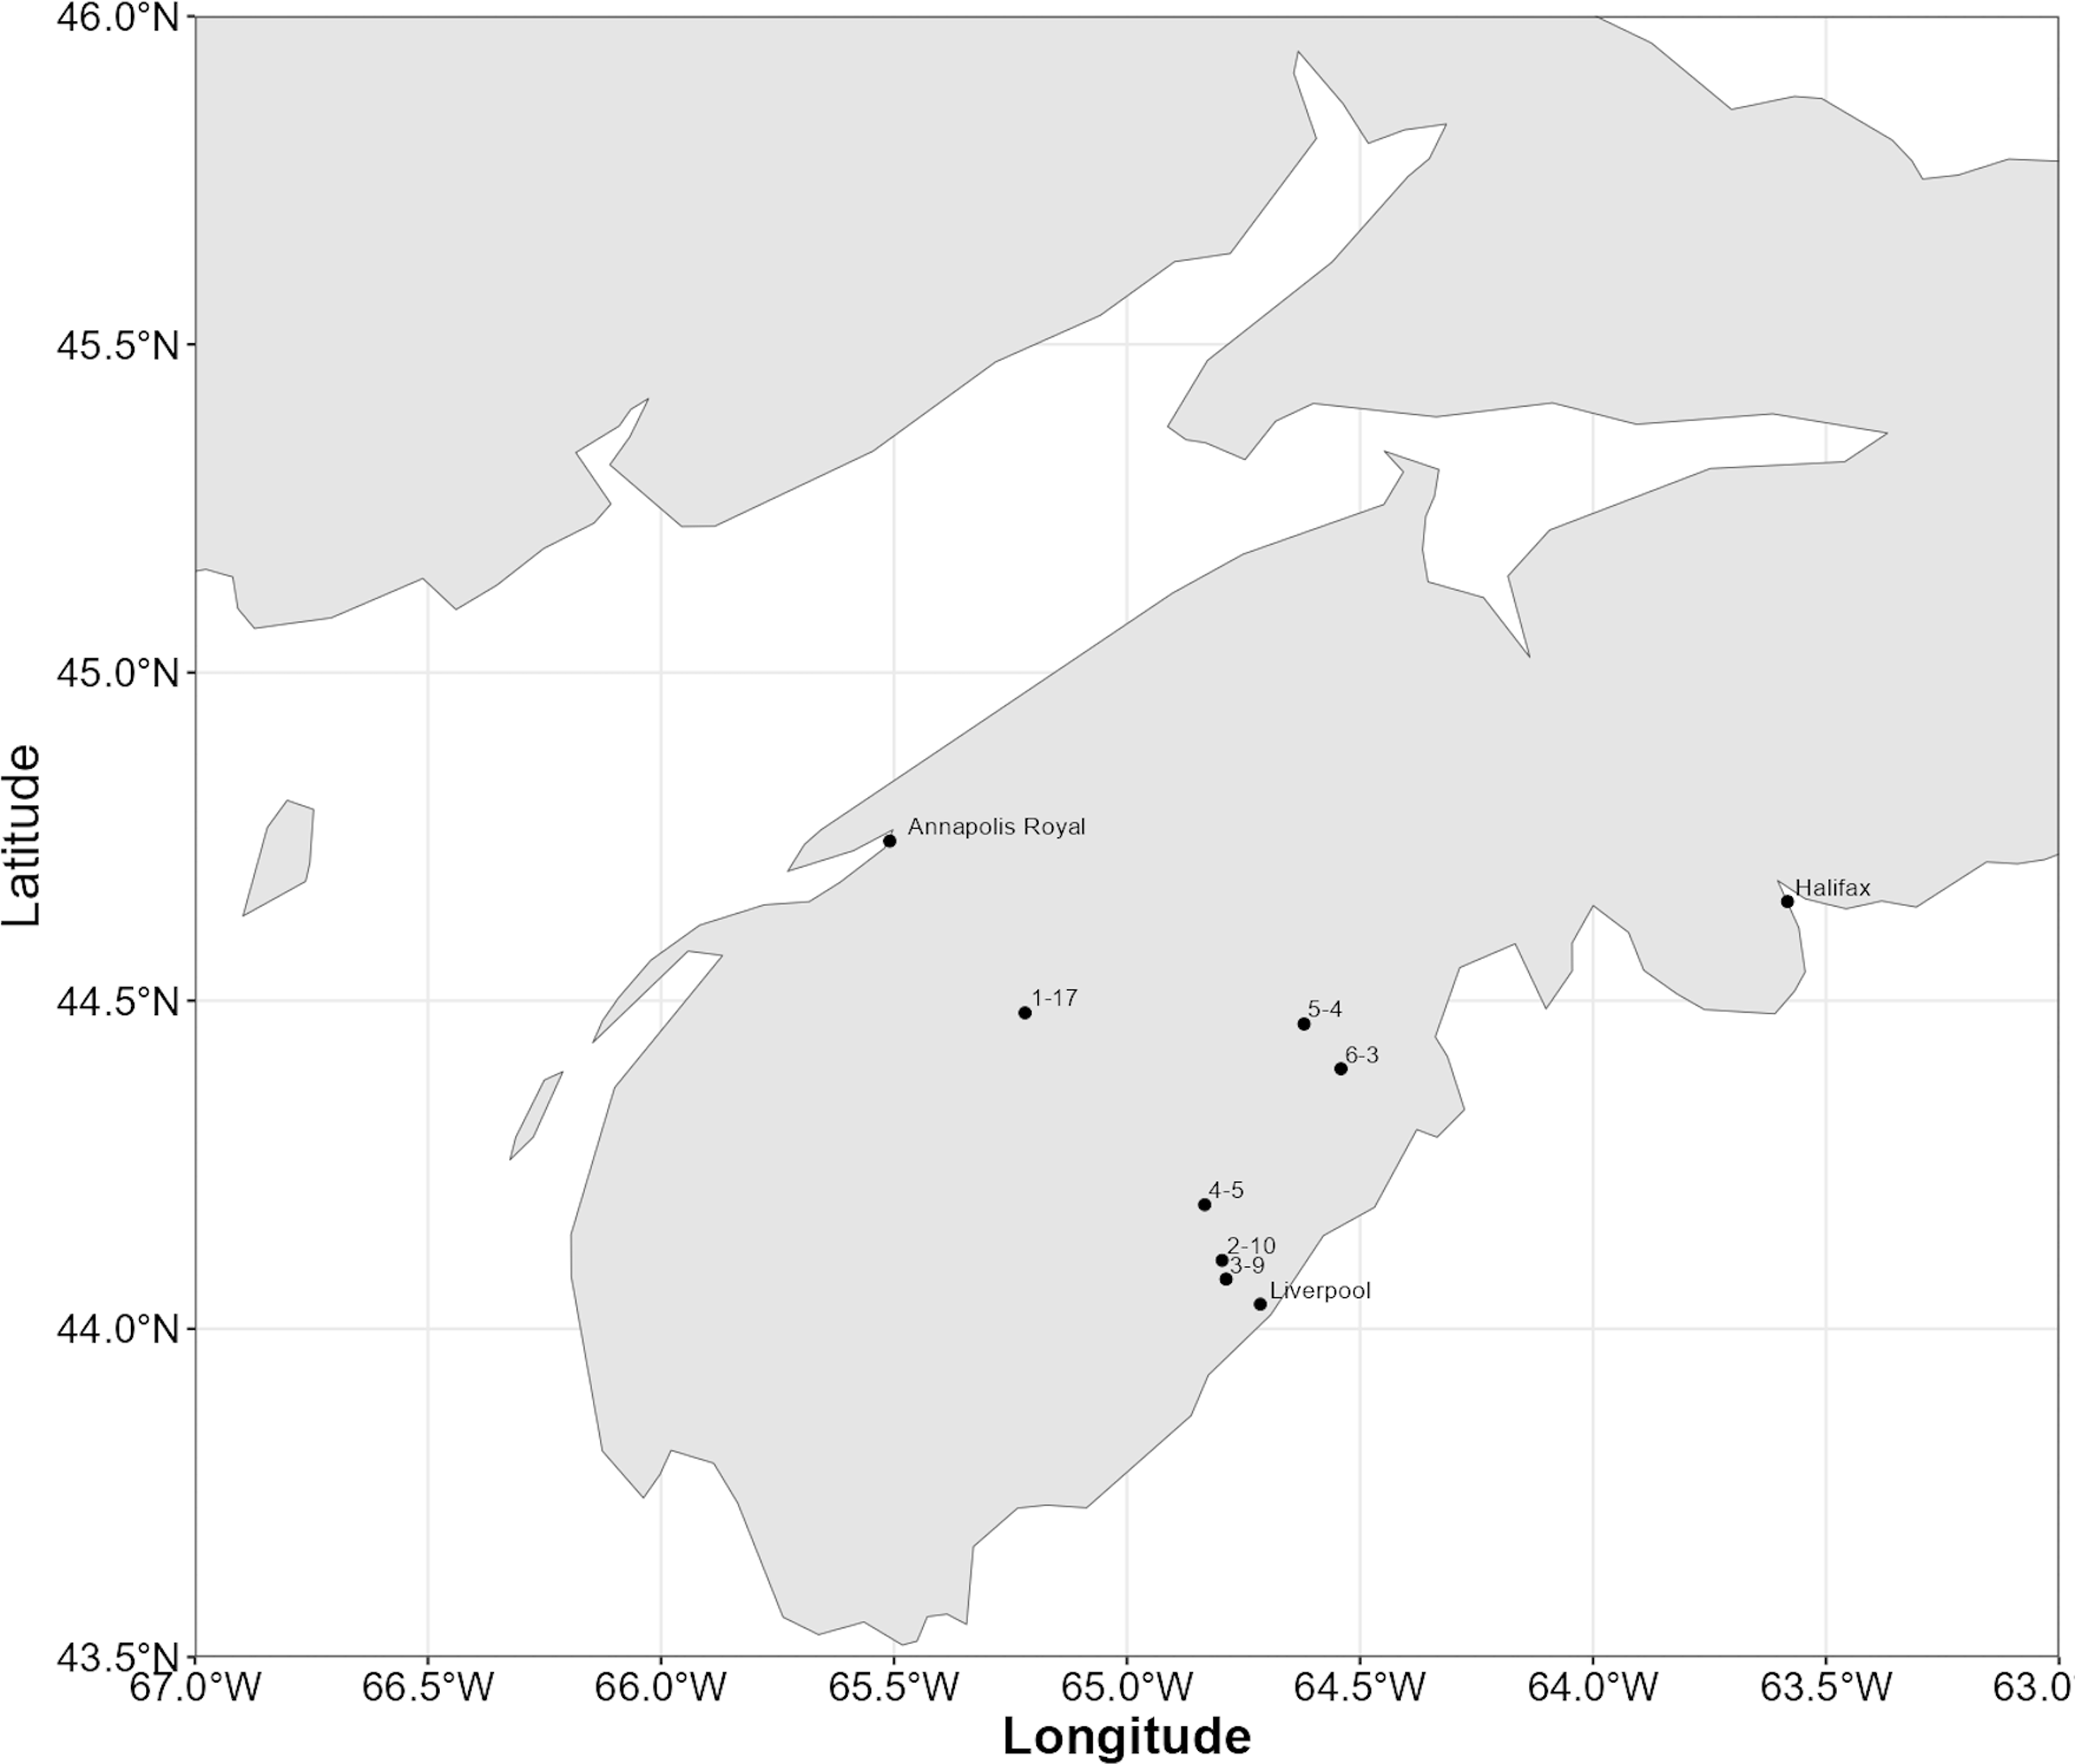
Figure 1. Location of the six sites and number of trees sampled per site (e.g., 1–17) in southwestern Nova Scotia, Canada, where Tsuga canadensis was sampled for wool of Adelges tsugae using 5.0- and 7.5-cm-diameter wooden balls fitted with Velcro as sampling devices.
The 7.5-cm-diameter wooden balls that were tested are made of maple (Acer sp.) (Sapindaceae) (Bear Woods Supply Company Inc., Vancouver, British Columbia, Canada). Each ball was painted with fluorescent-yellow paint (sun yellow, Rust-Oleum; Consumer Brands Canada, Concord, Ontario, Canada) to aid recovery when used and then fitted with 1-cm-wide strips of self-adhesive Velcro (hook side; black general purpose; Velcro USA, Manchester, New Hampshire, United States of America). The total surface area of this ball is 176.7 cm2, of which 122.9 ± 0.3 cm2 (∼70%) was covered by Velcro. Once fabricated, these balls weighed 161.0 ± 1.8 g (n = 12). The 5.0-cm-diameter maple balls had a surface area of 78.5 cm2, and 49.3 ± 0.3 cm2 of Velcro was fitted to each (covering ∼63% of the ball’s surface area). Once fabricated, the 5.0-cm balls weighed 46.5 ± 1.1 g (n = 12). The ends of each Velcro strip glued to the balls were reinforced by a drop of super glue (LePage Ultra Gel Control Super Glue; Henkel Canada Corp., Mississauga, Ontario, Canada) to improve durability. Overall, the 7.5-cm ball was three times heavier than the 5.0-cm ball and had 2.5 times more Velcro surface than the smaller ball did.
The HyperDog slingshot was used exclusively with the 5.0-cm-diameter ball, whereas the BigShot was used exclusively with the 7.5-cm ball. Each tree was sampled by targeting the crown from all sides and heights with the balls, beginning at a random location around the periphery of the crown. Each tree was sampled using two surveyors, who began on opposite sides of the tree using each ball size. Ten samples were taken per tree with each ball. A suitable sample was one where the ball contacted three or more distal hemlock branch tips as the ball ascended the crown; otherwise, the sample was repeated. Between samples, the ball was examined for adelgid wool and cleaned with a medium-bristle toothbrush to remove debris from the Velcro (Fig. 2).
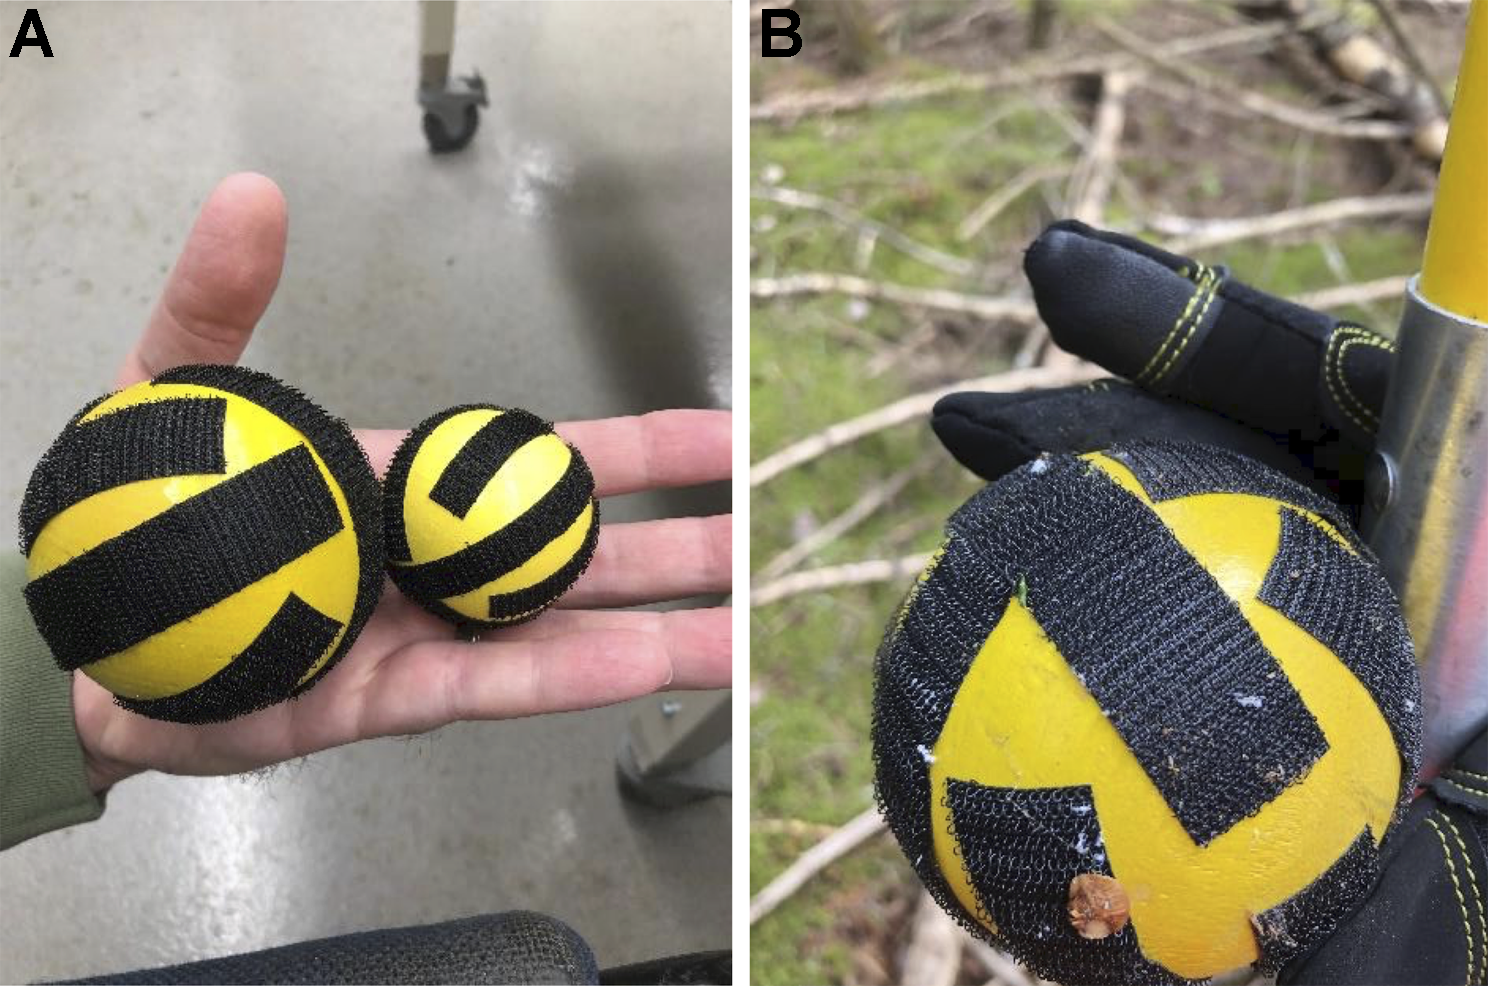
Figure 2. A, Devices (5.0- and 7.5-cm-diameter balls) used to trap wool of Adelges tsugae during Tsuga canadensis canopy sampling; B, 7.5-cm-diameter ball positive for adelgid wool, with several streaks of wool present on the ball. See text for details.
After each sample, we recorded a “1” if the Velcro on a ball had adelgid wool on it; otherwise, we recorded a “0”. From this data, we determined the attempt that resulted in the first wool, the total number of attempts, out of 10, that successfully captured wool, and the total time to complete the 10 attempts. The time to first positive was estimated by dividing the total time by 10 and then multiplying this by the number of attempts to detect first wool. To evaluate the probability of detecting wool with increasing sample attempts, we created ranked datasets for each tree. For the first dataset, we coded the first sampling attempt that detected wool and all attempts thereafter as a “1” (infested); we coded sampling attempts before this occurrence as a “0” (uninfested). For the second dataset, we ranked the detection of wool by sampling attempt. Here, we considered a rank of “10” as the detection of wool on the first attempt, a rank of “9” as the detection of wool on the second attempt, and so on, until a rank of “0”, which was no wool detected after 10 attempts. However, when analysing the detection of wool, we did not include trees where both ball sizes failed to detect A. tsugae.
We fit generalised linear mixed-effect models to describe the probability of trapping wool on the ball as the response variable and ball size and number of attempts as the predictor variables, with tree as a random effect in the model. We also fit generalised linear mixed-effect models for the other response variables. We fit separate models for the ranked number of samples until the first positive sample, time-to-first-wool detection, total time to complete all 10 samples, and the number of woolly samples out of 10 attempts as the response variables, with ball size as the predictor variable and tree as a random effect. Model fitting was done in the R statistical computing environment, version 4.3.0 (R Core Team; https://www.R-project.org/). Models were fitted using functions in the lme4 package (Bates et al. Reference Bates, Maechler, Bolker and Walker2015). Differences among levels of the predictor variables were examined using functions in the emmeans package (Lenth Reference Lenth2017). We examined the dispersion parameters and residual plots after running these models (Zuur et al. Reference Zuur, Ieno, Walker, Saveliev and Smith2009).
The probability of trapping wool on the ball increased with each successive attempt, increasing faster for the 7.5-cm ball than for the 5.0-cm ball and resulting in a significant interaction between ball size and number of attempts (D = 19.64, df = 1, 672, P < 0.0001; Fig. 3). After 10 attempts, detectability of wool was significantly higher for the 7.5-cm ball (P[detection] = 0.97 ± 0.03) than for the 5.0-cm ball (P[detection] = 0.75 ± 0.08; D = 7.09, df = 1, 62, P = 0.008; Fig. 2). Of note, detectability by the 5-cm ball was similar to that by the 5.6-cm ball used in earlier studies (Fidgen et al. Reference Fidgen, Whitmore, MacQuarrie and Turgeon2021). The resultant gain in detectability by the larger ball was likely due to the larger surface area of Velcro on the ball and to the increased mass of the ball resisting deflection when hitting branch tips.

Figure 3. Influence of ball diameter and sample attempt on detectability of Adelges tsugae wool in the canopy of Tsuga canadensis in southwestern Nova Scotia, Canada. Circles are raw data offset for visualisation.
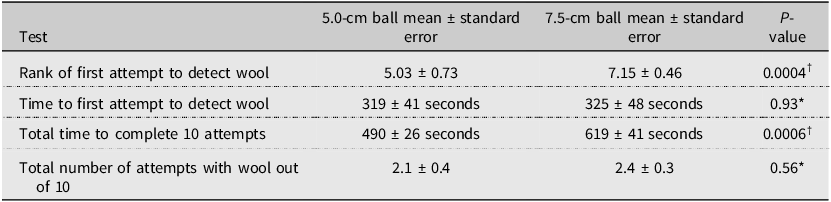
The rank out of a maximum score of 10 for the first positive attempt was significantly higher for the 7.5-cm ball than for the 5-cm ball (Table 1). The 7.5-cm ball detected wool after 2–3 sampling attempts as compared to 4–6 attempts for the 5.0-cm ball. The time to the first sampling attempt to detect adelgid wool was similar for both ball sizes (Table 1). However, the total time to complete 10 sampling attempts was significantly higher for the 7.5-cm ball than for the 5.0-cm ball. Both sampling devices detected wool the same number of times out of 10, on average (Table 1). Overall, this analysis supports using a larger ball for the detection of A. tsugae wool from the upper canopy of T. canadensis. Of note when encountering trees with undetectable or no infestation of A. tsugae, sampling with the larger ball will take 1.25 times longer to complete than using the smaller ball.
Table 1. Various comparisons of 5.0- and 7.5-cm-diameter balls as sampling devices to detect the wool of Adelges tsugae in the canopy of Tsuga canadensis in southwestern Nova Scotia, Canada
† Ordination and Multivariate Analysis for Ecology generalised linear mixed-effect negative binomial model.
* Generalised linear negative binomial model.
There is one major limitation to the adoption of a larger device when sampling more than just a few trees: the slingshot. We suspect an improved launching device will address these problems. For example, the BigShot has poor accuracy compared to the HyperDog, and users became fatigued after 30–40 attempts (J. Fidgen and G. Forbes, unpublished data). These issues could be remedied by the development of a pneumatic launching system. Once developed, we recommend re-assessing the 7.5-cm ball on trees with a range of adelgid population levels as was done for the 5.6-cm-diameter sampling device (Fidgen et al. Reference Fidgen, Whitmore, MacQuarrie and Turgeon2021). We suspect surveyors will continue to use unsanctioned tools to ball sample for A. tsugae wool. This note serves as a reminder that adaptations to the ball sampling technique must be vigorously tested and a method optimised before integrating it into an operational setting.
Acknowledgements
The authors thank M. Doyle, A. McGill, and the field staff of the Nova Scotia Department of Natural Resources and Renewables (NSDNRR) for their assistance with data collection. They also thank NSDNRR and Mersey River Chalets & Nature Retreat for permission to access and use the study sites.
Funding statement
This work was provided by NSDNRR through SERG-I and by Natural Resources Canada, Canadian Forest Service.


 Open access