


Highlights
-
• Transcranial magnetic stimulation and MRI were used to assess the relationship between motor cortex excitability and thickness in Alzheimer’s dementia (AD).
-
• AD participants had lower motor cortex thickness and higher excitability (i.e., lower resting motor threshold) than healthy individuals.
-
• There appeared to be a negative association between motor cortical excitability and thickness.
Introduction
Alzheimer’s dementia (AD) is a clinical syndrome caused by Alzheimer’s disease and related disorders, resulting in changes to memory, language, executive function, personality traits and behaviors in older adults.Reference Weller and Budson1 The prevalence of AD increases as the population ages, being 3% in persons between the ages of 65 and 75, 17% between 75 and 84 and 32% in those older than 84.Reference Soria Lopez, González and Léger2 The initial stages typically involve deficits in encoding and retrieving memories, with cognitive and behavioral challenges becoming more prevalent as the disease progresses.Reference Soria Lopez, González and Léger2 Current diagnosis of AD relies on criteria based on clinical symptoms or biomarkers based on brain imaging or blood and cerebrospinal fluid samples. Cortical atrophy can begin at preclinical stages of AD and continues with loss of cortical volume as the disease progresses.Reference Gomez-Isla, Hollister and West3 Cortical atrophy is an established marker of AD, and it can be used to support a clinical diagnosis.Reference Querbes, Aubry and Pariente4 In turn, measures of cortical thickness obtained using MRI can be used to quantify cortical atrophy in AD.Reference Turkheimer, Cullum, Hubler, Paver, Yeo and Bigler5,Reference Ozzoude, Ramirez and Raamana6 Cortical thickness is associated with cognitive performance and is a marker of disease severity and progression.Reference Dickerson, Bakkour and Salat7,Reference Wolk and Dickerson8
Electrophysiological techniques have recently gained attention to detect neural network dysfunction in AD.Reference Babiloni, Lopez and Del Percio9,Reference Babiloni, Del Percio and Lizio10 Electrophysiological assessments such as electroencephalography (EEG) are widely available, non-invasive and inexpensive. Cortical hyper-excitability characterized by subclinical epileptiform activity detected using resting state EEG has been proposed as a new potential neurophysiological marker of AD.Reference Horvath, Papp and Zsuffa11 We have shown that patients with AD have higher cortical excitability (measured via frequency of epileptiform activity), and it is associated with decreased global cognitive performance.Reference Kumar12 Resting motor threshold (rMT) assessed using transcranial magnetic stimulation (TMS) can precisely measure motor cortex excitability, with lower rMT indicating higher cortical excitability. A previous study showed that AD patients had significantly lower rMTs than healthy older adults, and rMTs correlated positively with Mini-Mental State Exam (MMSE) scores.Reference Khedr, Ahmed, Darwish and Ali13 Therefore, motor cortex excitability could be used as an easy-to-obtain marker of neurophysiological changes related to AD.
However, the relationship between cortical excitability and brain structural changes in AD remains a relatively unexplored area. A decrease in cortical thickness may contribute to a compensatory increase in cortical excitability, which may have implications for the progression of illness and eventual prognosis in AD.Reference Niskanen, Könönen and Määttä14 Further, cortical hyper-excitability in AD may be driven by excessive excitatory NMDA receptor-mediated glutamate activity,Reference Bishop, Lu and Yankner15,Reference Bell, Bennett and Cuello16 which can lead to neuronal loss and decreased cortical thickness.Reference Dodd17–Reference Wang and Reddy19 Two studies that used TMS measures to investigate the relationship between cortical excitability and brain structure in healthy adults found that cortical excitability was negatively associated with cortical volume and motor cortex thickness and positively associated with white matter hyperintensities’ volume.Reference List, Kübke and Lindenberg20,Reference Silbert, Nelson and Holman21 To our knowledge, only one study examined this relationship in participants with AD and showed a negative relationship between cortical excitability and the cuneus and precuneus cortical thickness.Reference Niskanen, Könönen and Määttä14 However, this study did not find a relationship between cortical excitability and cortical thickness in healthy adults.Reference Niskanen, Könönen and Määttä14 Thus, there is a lack of clarity about brain structural correlates of cortical excitability in AD, and the few studies examining this relationship have reported conflicting results.
The objectives of this study are to (1) compare cortical excitability and thickness between patients with AD and older healthy individuals and (2) assess the relationship between cortical excitability and thickness. We hypothesized that participants with AD would have increased cortical excitability and decreased motor cortex thickness compared to healthy older adults, and that motor cortex excitability would be negatively associated with motor cortex thickness both in participants with AD and HCs.
Methods
Participants
Data used in this study were taken from existing studies approved by the Research Ethics Board at the Centre for Addiction and Mental Health, and all participants provided written informed consent. Inclusion criteria for all participants included: age 50 years or older and corrected visual and hearing ability allowing for reading large fonts and hearing verbal instructions. Specific AD participant inclusion criteria included meeting the National Institute of Neurological and Communicative Disorders and Stroke and Alzheimer’s Disease and Related Disorders Association (NINCDS-ADRDA), National Institute on Aging and Alzheimer’s Association (NIA-AA) or Diagnostic and Statistical Manual of Mental Disorders (DSM-IV) criteria for probable AD and stable dosage of cognitive enhancer medications before the study enrollment. Exclusion criteria for all participants included any significant mental disorder (including drug or alcohol use disorders) or neurological disease affecting the central nervous system other than AD (i.e., participants with dementia other than AD were excluded) and any contraindications to TMS.Reference Rossi, Antal and Bestmann22 In addition, healthy controls (HCs) could not have any lifetime diagnosis of cognitive disorders or mental disorder (other than simple phobias) or be taking any psychotropic medications other than occasional use of hypnotic medication.
Clinical assessments
All participants underwent a comprehensive assessment to gather their socio-demographics, medical and psychiatric characteristics. AD diagnoses were confirmed using the NINCDS-ADRDA, NIA-AA or DSM-IV criteria. All participants also completed the Montreal Cognitive Assessment or the MMSE.Reference Roalf, Moberg, Xie, Wolk, Moelter and Arnold23
TMS rMT procedure
All participants were seated upright in a chair for the entirety of the procedure. Single pulse TMS was delivered over the left primary motor cortex using a standard Magstim 200 stimulator (BiStim; Magstim Company Ltd) and a 7-cm figure-of-eight coil. The TMS coil was held at a 45-degree angle to the midsagittal plane of the scalp. An active electrode was placed over the belly of the abductor pollicis brevis (ABP) muscle, with a reference electrode placed over the interphalangeal joint of the right thumb. A ground electrode was placed on the inner surface of the proximal forearm and secured with an armband to prevent it from moving. Motor-evoked potential (MEP) data were collected using Signal software by Cambridge Electronics Design (UK). Stimulation intensity was slowly increased starting at 50% TMS stimulator output until a clear MEP was generated. The ‘hot spot’ over the left motor cortex was defined as the location of the coil in relation to the scalp that generated maximal MEPs in the ABP muscle. Each participant’s rMT was determined using the ‘hotspot’ by finding the lowest stimulus strength (expressed in percentage of TMS machine output) to evoke an MEP with a peak-to-peak amplitude of ≥50 μV in at least 5–10 consecutive single pulse TMS trials.Reference Rossini, Burke and Chen24,Reference Rossini, Barker and Berardelli25
MRI analysis of cortical thickness and skull-to-cortex distance
MRI scans were acquired while participants were lying down with their eyes closed, using a 3 T GE Discovery MR750 (General Electric, Milwaukee, WI) research-dedicated scanner. T1w MRI scans were preprocessed using FMRIPREP version 20.2.6, a Nipype-based tool. Each T1w volume was corrected for INU (intensity non-uniformity) using N4BiasFieldCorrection v2.1.0 and skull-stripped using antsBrainExtraction v2.1.0 (using the OASIS template). Brain surfaces were reconstructed using recon-all from FreeSurfer v6.0, and the brain mask estimated previously was refined with a custom variation of the method to reconcile ANTs-derived and FreeSurfer-derived segmentations of the cortical gray matter of Mindboggle.Reference Dale, Fischl and Sereno26,Reference Klein, Ghosh and Bao27 Skull-to-cortex distance was obtained from each participant’s MRI scan using Desikan-Killiany atlas MNI coordinates of the motor cortex (x = −40, y = −20, z = 52Reference Navarro de Lara, Tik and Woletz28 within the Brainsight neuronavigation system (Figure 1). Similar to the method used by Kozel and colleagues,Reference Kozel, Nahas and DeBrux29 a reference point (located on the scalp) was generated using the MNI coordinates of the motor cortex, followed by a second point manually placed on the closest perpendicular gray matter visible on the MRI scan. Using a straight line (generated by the software) between the two points, the skull-to-cortex distance measure was calculated in millimeters.
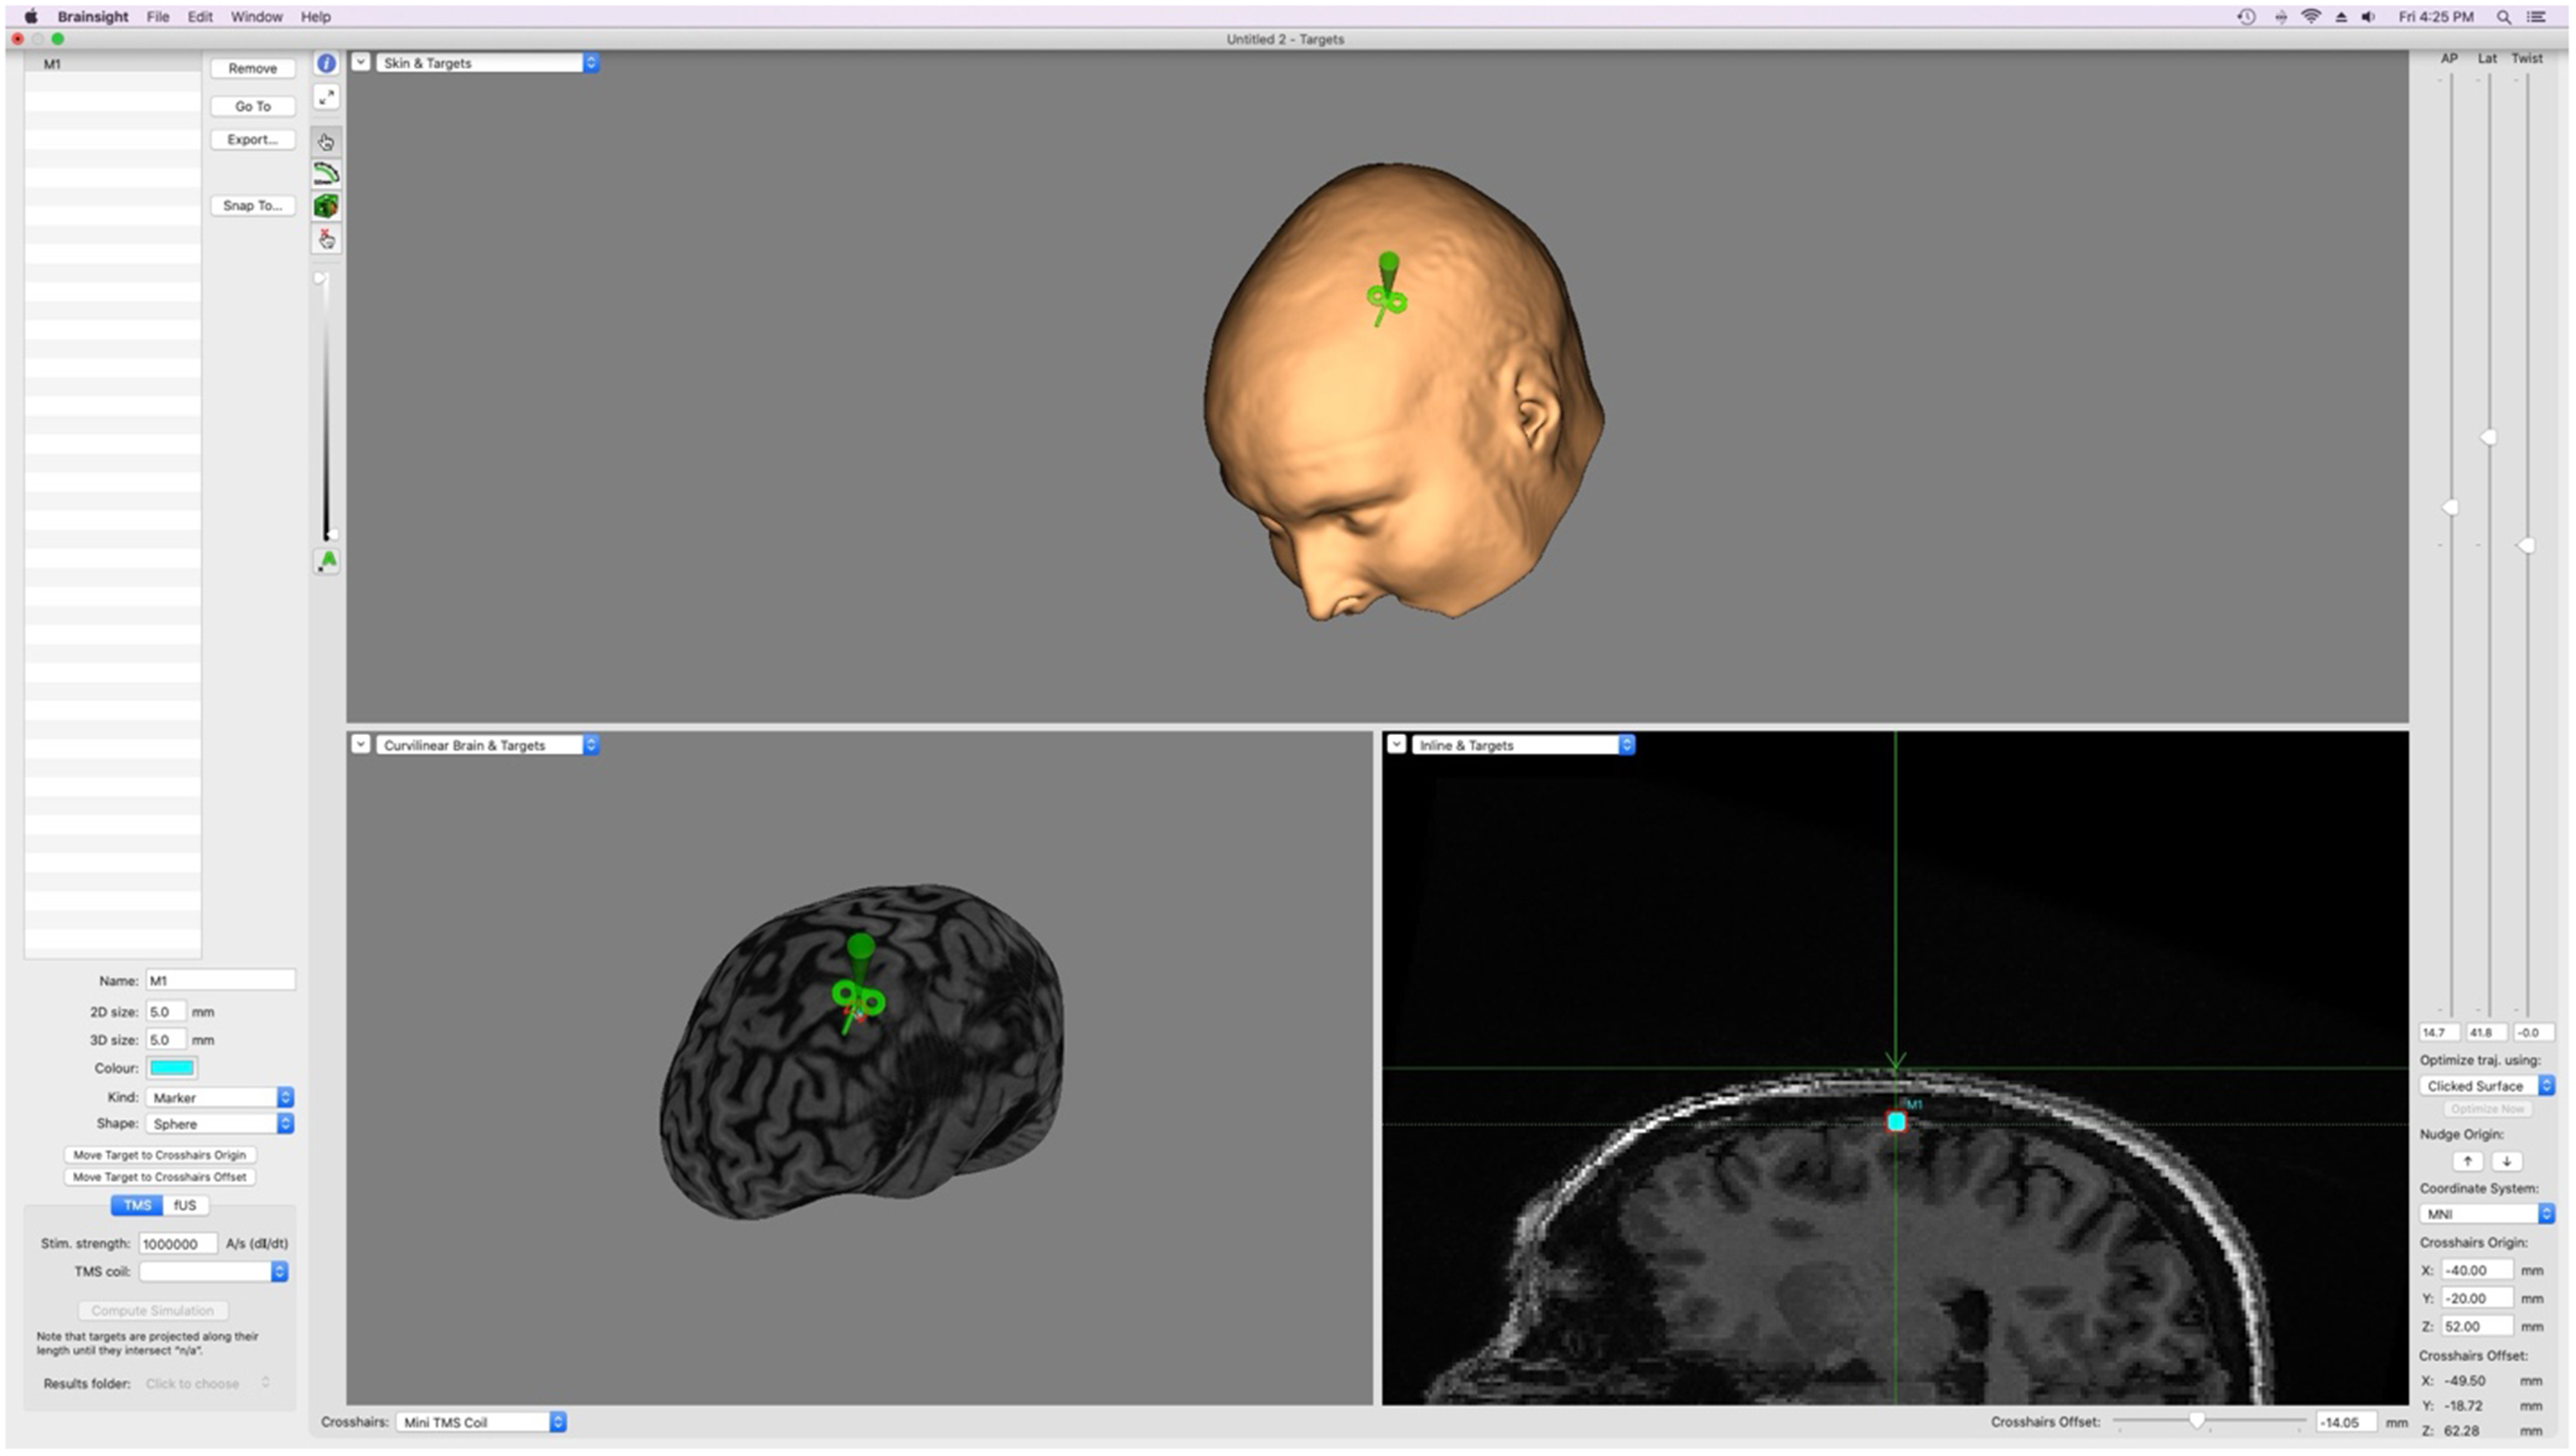
Figure 1. Brainsight neuronavigation’s manual measurement system using MRI scans and MNI coordinates; used to obtain skull-to-cortex distance measurements. M1 = motor cortex; TMS = transcranial magnetic stimulation; AP = anterior/posterior; Lat = lateral; MNI = Montreal Neurological Institute Coordinate Space.
Statistical analysis
We examined the distribution of all variables using histograms and box plots to assess their distribution and identify outliers. Sociodemographic and clinical variables were compared between the two diagnostic groups using independent t-tests or chi-square tests as applicable. We used an independent sample t-test (two-tailed) to compare cortical excitability between the two groups, followed by one-way analysis of covariance controlling for age, years of education and skull-to-cortex distance (due to potential impacts on rMT measurement). A similar approach was used for cortical thickness; we used an independent sample t-test (two-tailed) to compare cortical thickness between the two groups, followed by one-way analysis of covariance controlling for age and years of education. Finally, Pearson’s r correlation test was performed to assess the relationship between motor cortex excitability and thickness in the entire sample (i.e., combining participants with AD and HC), and a multiple regression with rMT as the dependent variable and motor cortex thickness as an independent variable while controlling for age and diagnosis. All analyses were conducted using SPSS, version 25 (IBM Corp., Armonk, NY).
Results
The study sample comprised of 62 participants with AD and 47 HC. Sociodemographic and clinical variables are presented in Table 1. Participants with AD were significantly older (Mean (M) age = 74.6, Standard Deviation (SD) = 8.0 years) than HC (M age = 71.0, SD = 7.9 years) (t(107) = 2.3, p = 0.021). Also, participants with AD had a significantly lower number of years of education (M education = 14.2, SD = 3.8 years) than HC (M education = 16.0, SD = 2.2 years) (t(107) = −2.9, p = 0.005). The skull-to-cortex distance at motor cortex did not differ significantly between participants with AD (M distance = 22.9, SD = 4.3 mm) and HC (M distance = 21.7, SD = 4.3 mm) (t(58) = 2.3, p = 0.285).
Table 1. Sociodemographic and clinical variables in participants with Alzheimer’s dementia and healthy controls
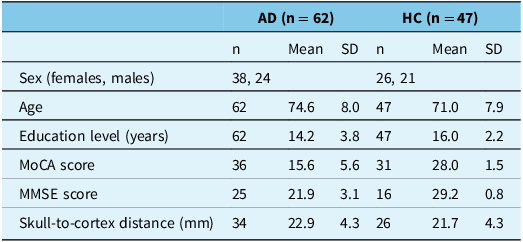
AD = Alzheimer’s dementia; HC = healthy control; n = sample size; SD = standard deviation; MoCA = Montreal Cognitive Assessment; MMSE = Mini-Mental State Exam.
Comparison of motor cortex thickness and excitability
Participants with AD had significantly lower motor cortex thickness (M thickness = 2.4, SD = 0.2 mm) than HC (M thickness = 2.5 SD = 0.1 mm) (t(92) = −4.4, p = <0.001) (Figure 2). This difference remained significant after controlling for age, sex and years of education (F1, 89 = 14.2, p = <0.001). Participants with AD also had significantly lower rMT (M rMT = 66.5, SD = 14.8 %) (indicative of higher excitability) than HC (M rMT = 72.0, SD = 13.1%) (t(107) = −2.0, p = 0.045) (Figure 3). This difference remained significant after controlling for age, sex, years of education and skull-to-cortex distance (F1, 54 = 5.5, p = 0.020).
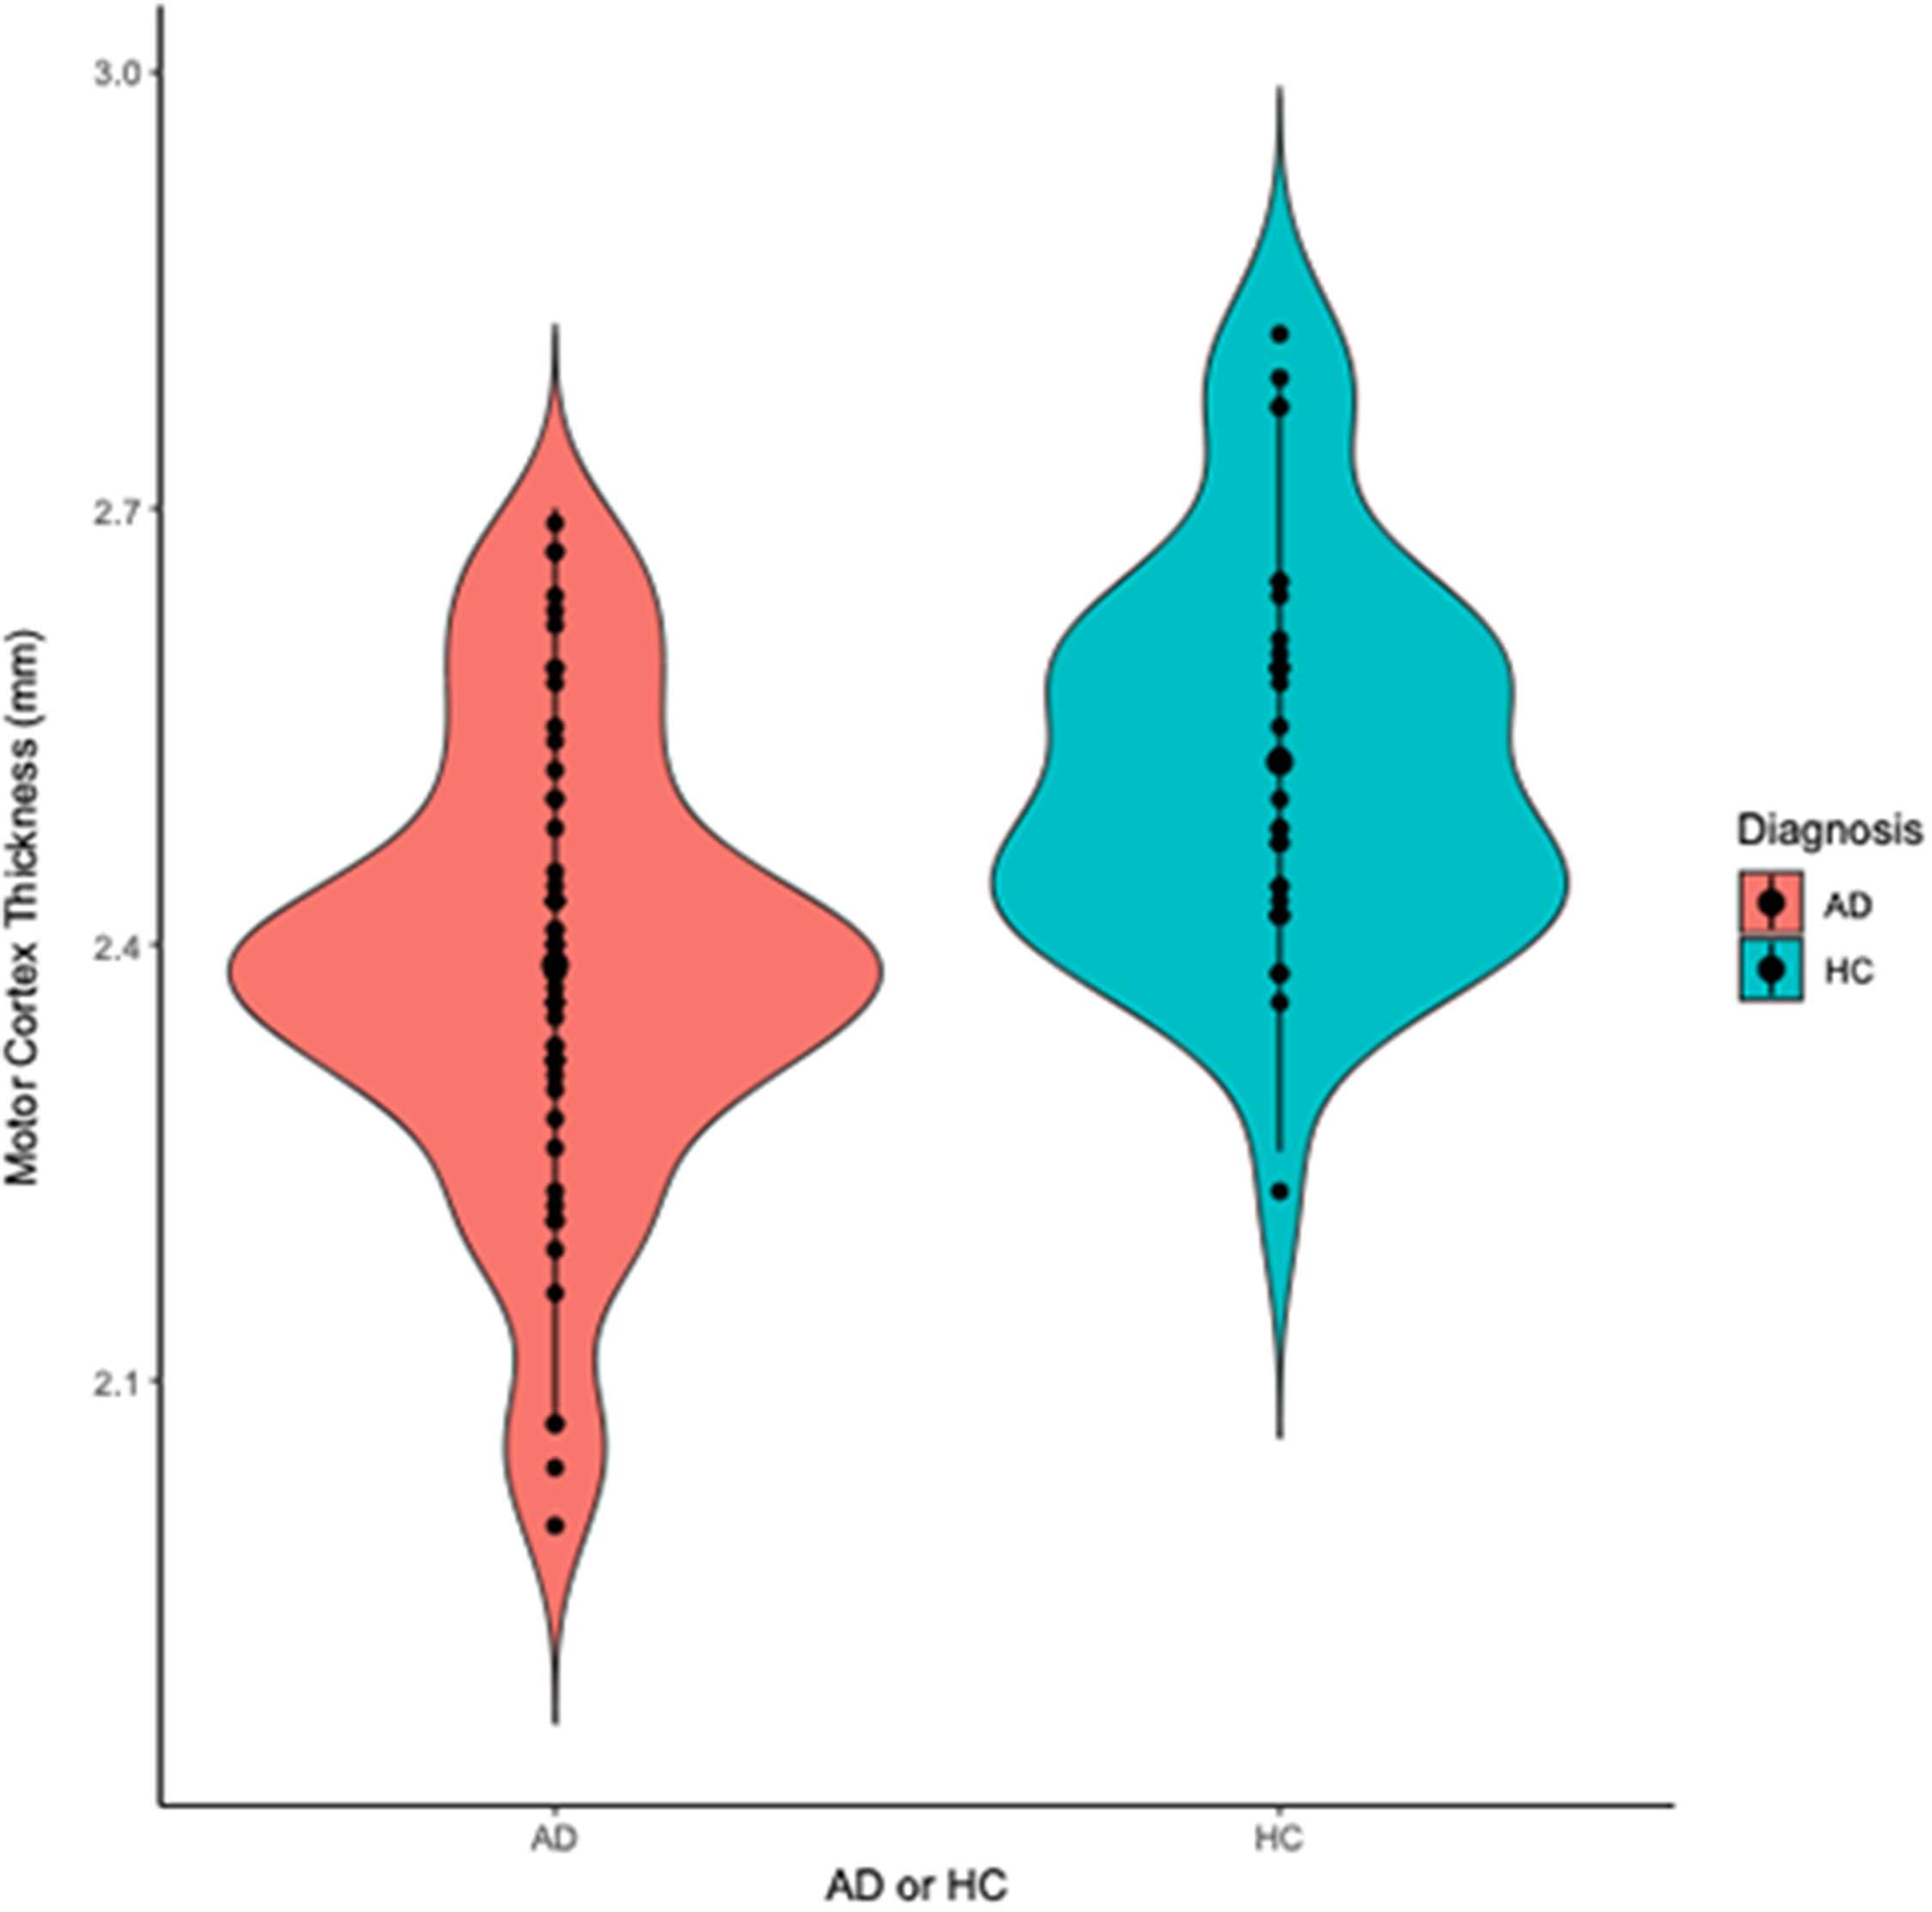
Figure 2. Violin plot displaying motor cortex thickness in participants with Alzheimer’s dementia (AD) and healthy controls (HC). Participants with AD had thinner motor cortex thickness (Mthickness = 2.4, SD = 0.2 mm) than HC (Mthickness = 2.5 SD = 0.1 mm) (t(92) = −4.4, p = <0.001).
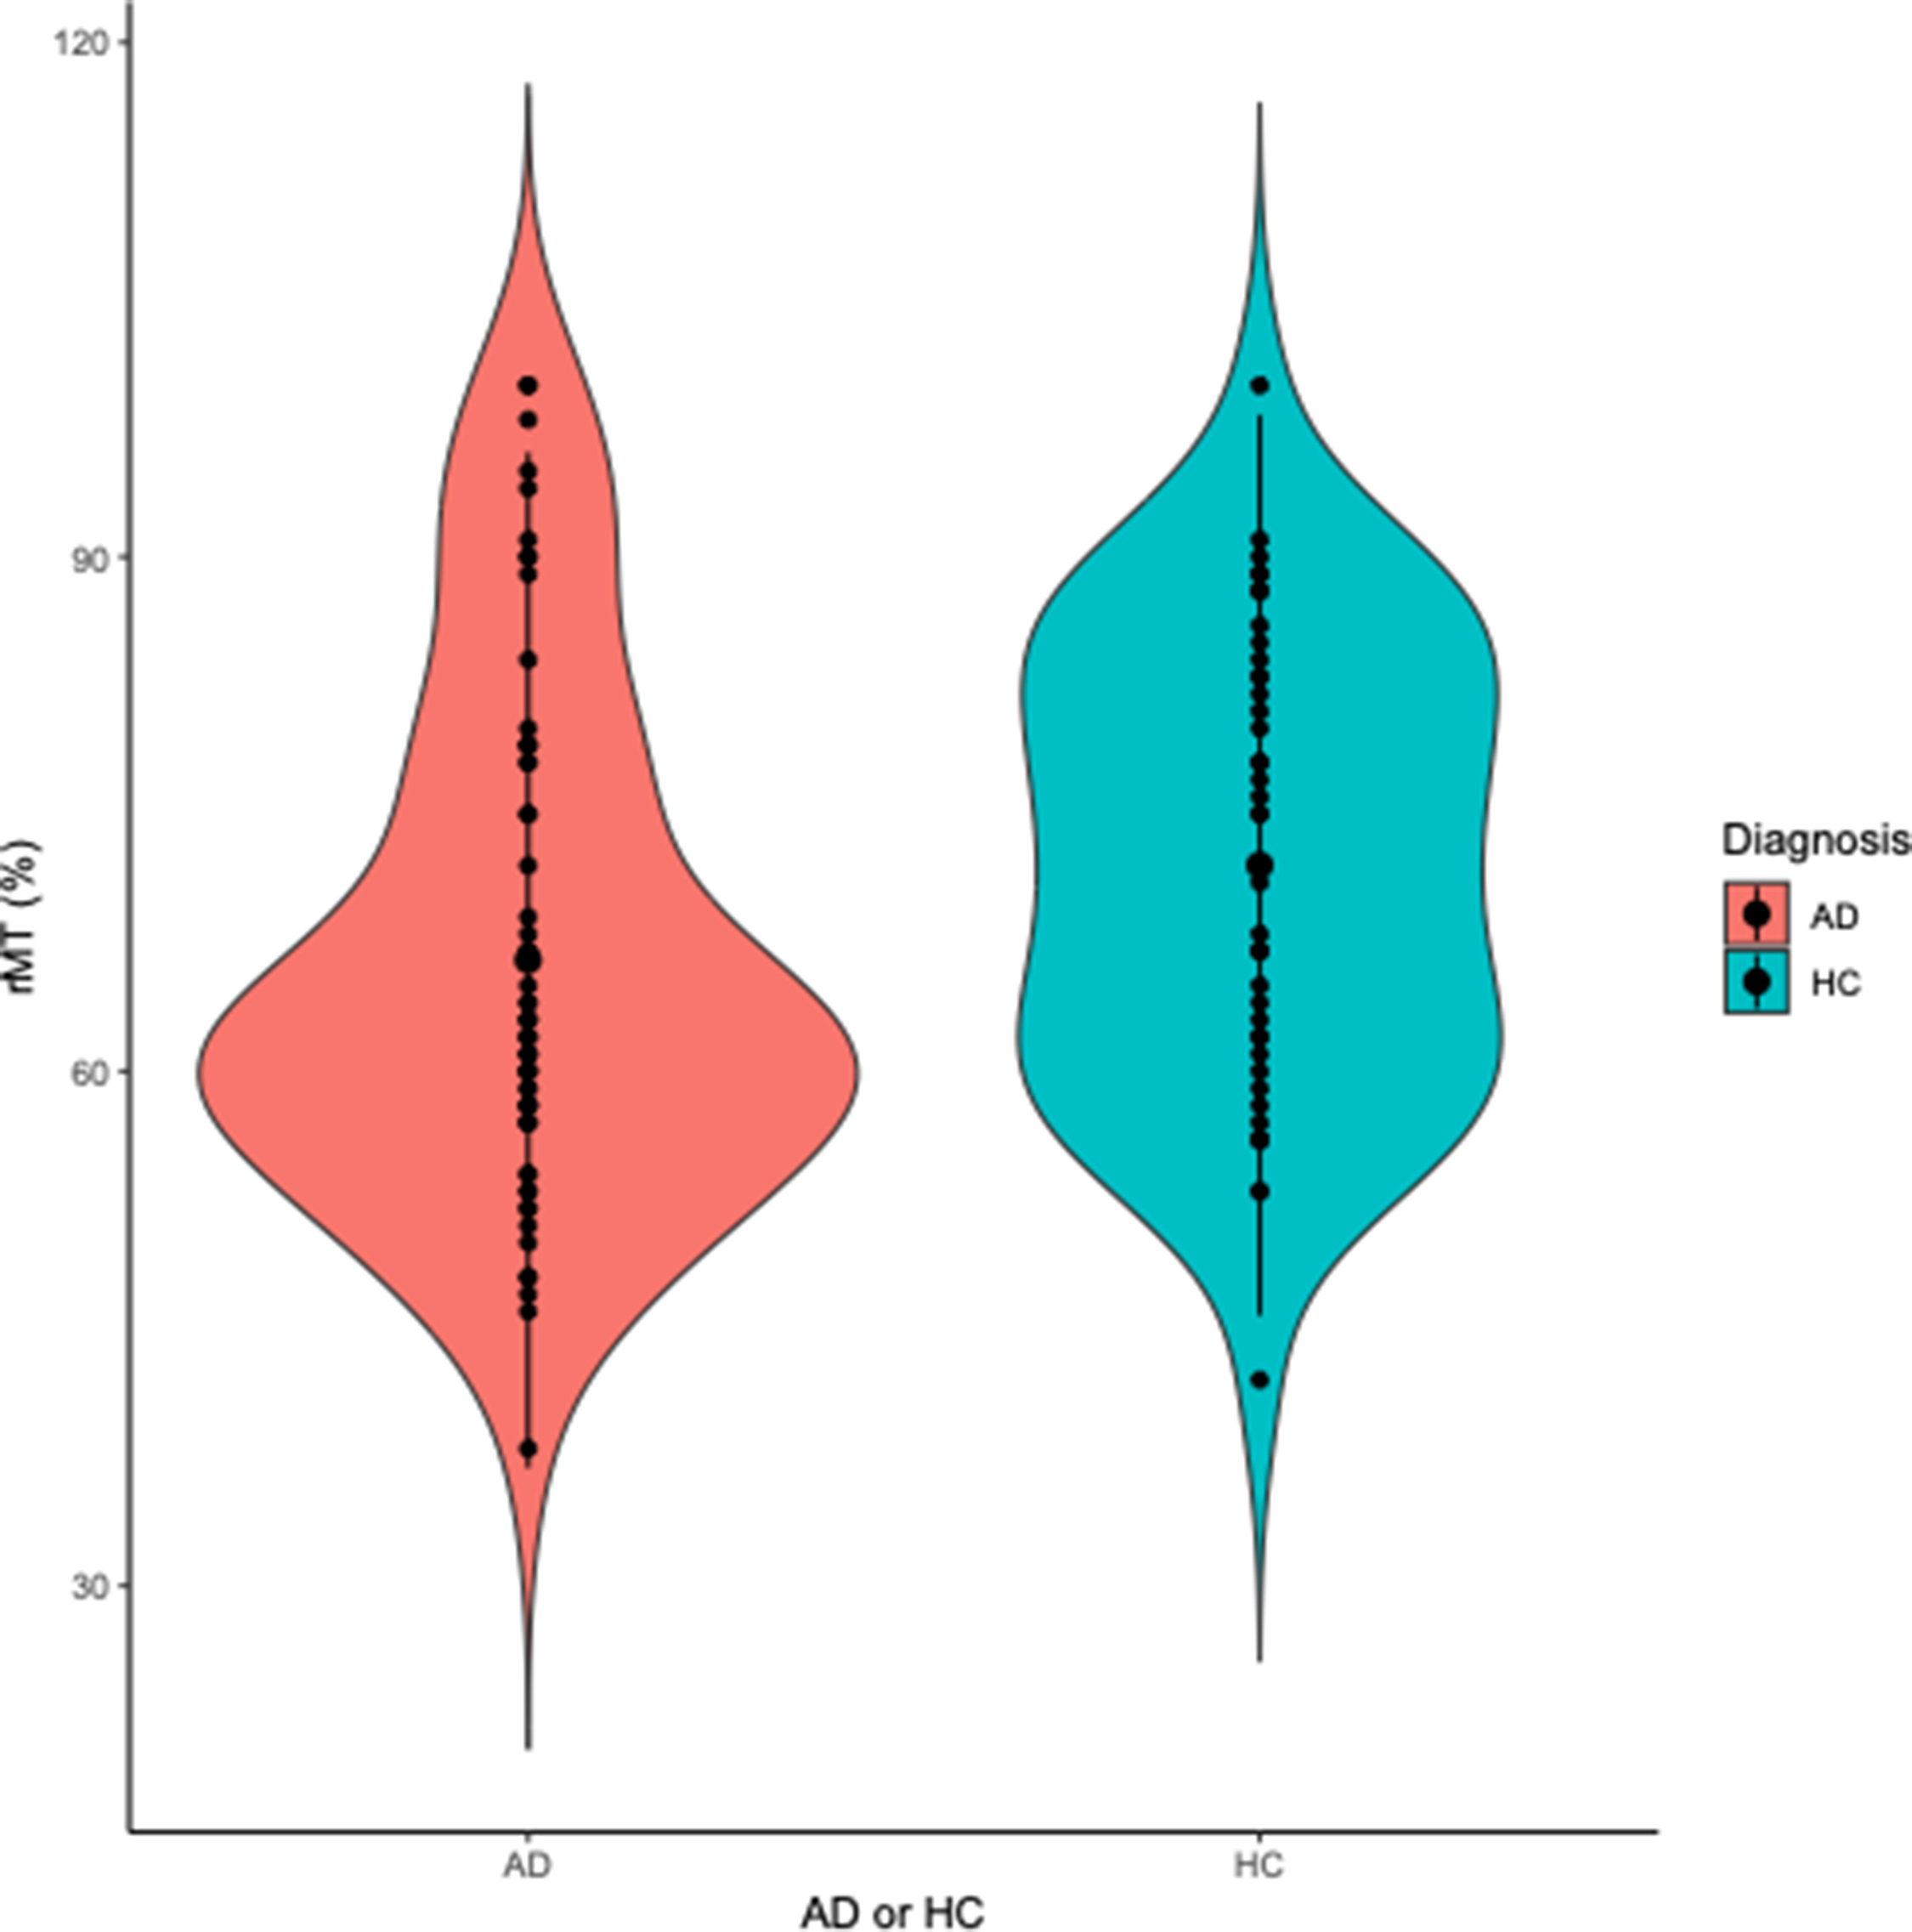
Figure 3. Violin plot displaying resting motor threshold (rMT) in participants with Alzheimer’s dementia (AD) and healthy controls (HC). Participants with AD had lower rMT (MrMT = 66.5, SD = 14.8 %) (indicative of higher excitability) than HC (MrMT = 72.0, SD = 13.1 %) (t(107) = −2.0, p = 0.045).
Relationship between motor cortex thickness and excitability
In the overall sample combining participants with AD and HC, rMT (higher rMT means lower excitability) was positively correlated with motor cortex thickness (r = 0.2, df = 92, p = 0.036) (Figure 4C). However, this association did not remain significant after controlling for age, sex, education level and diagnosis (AD or HC) (B = 2.6, R2 = 0.1, p = 0.820), but the effect of age was significant (B = −0.5, p = 0.020).
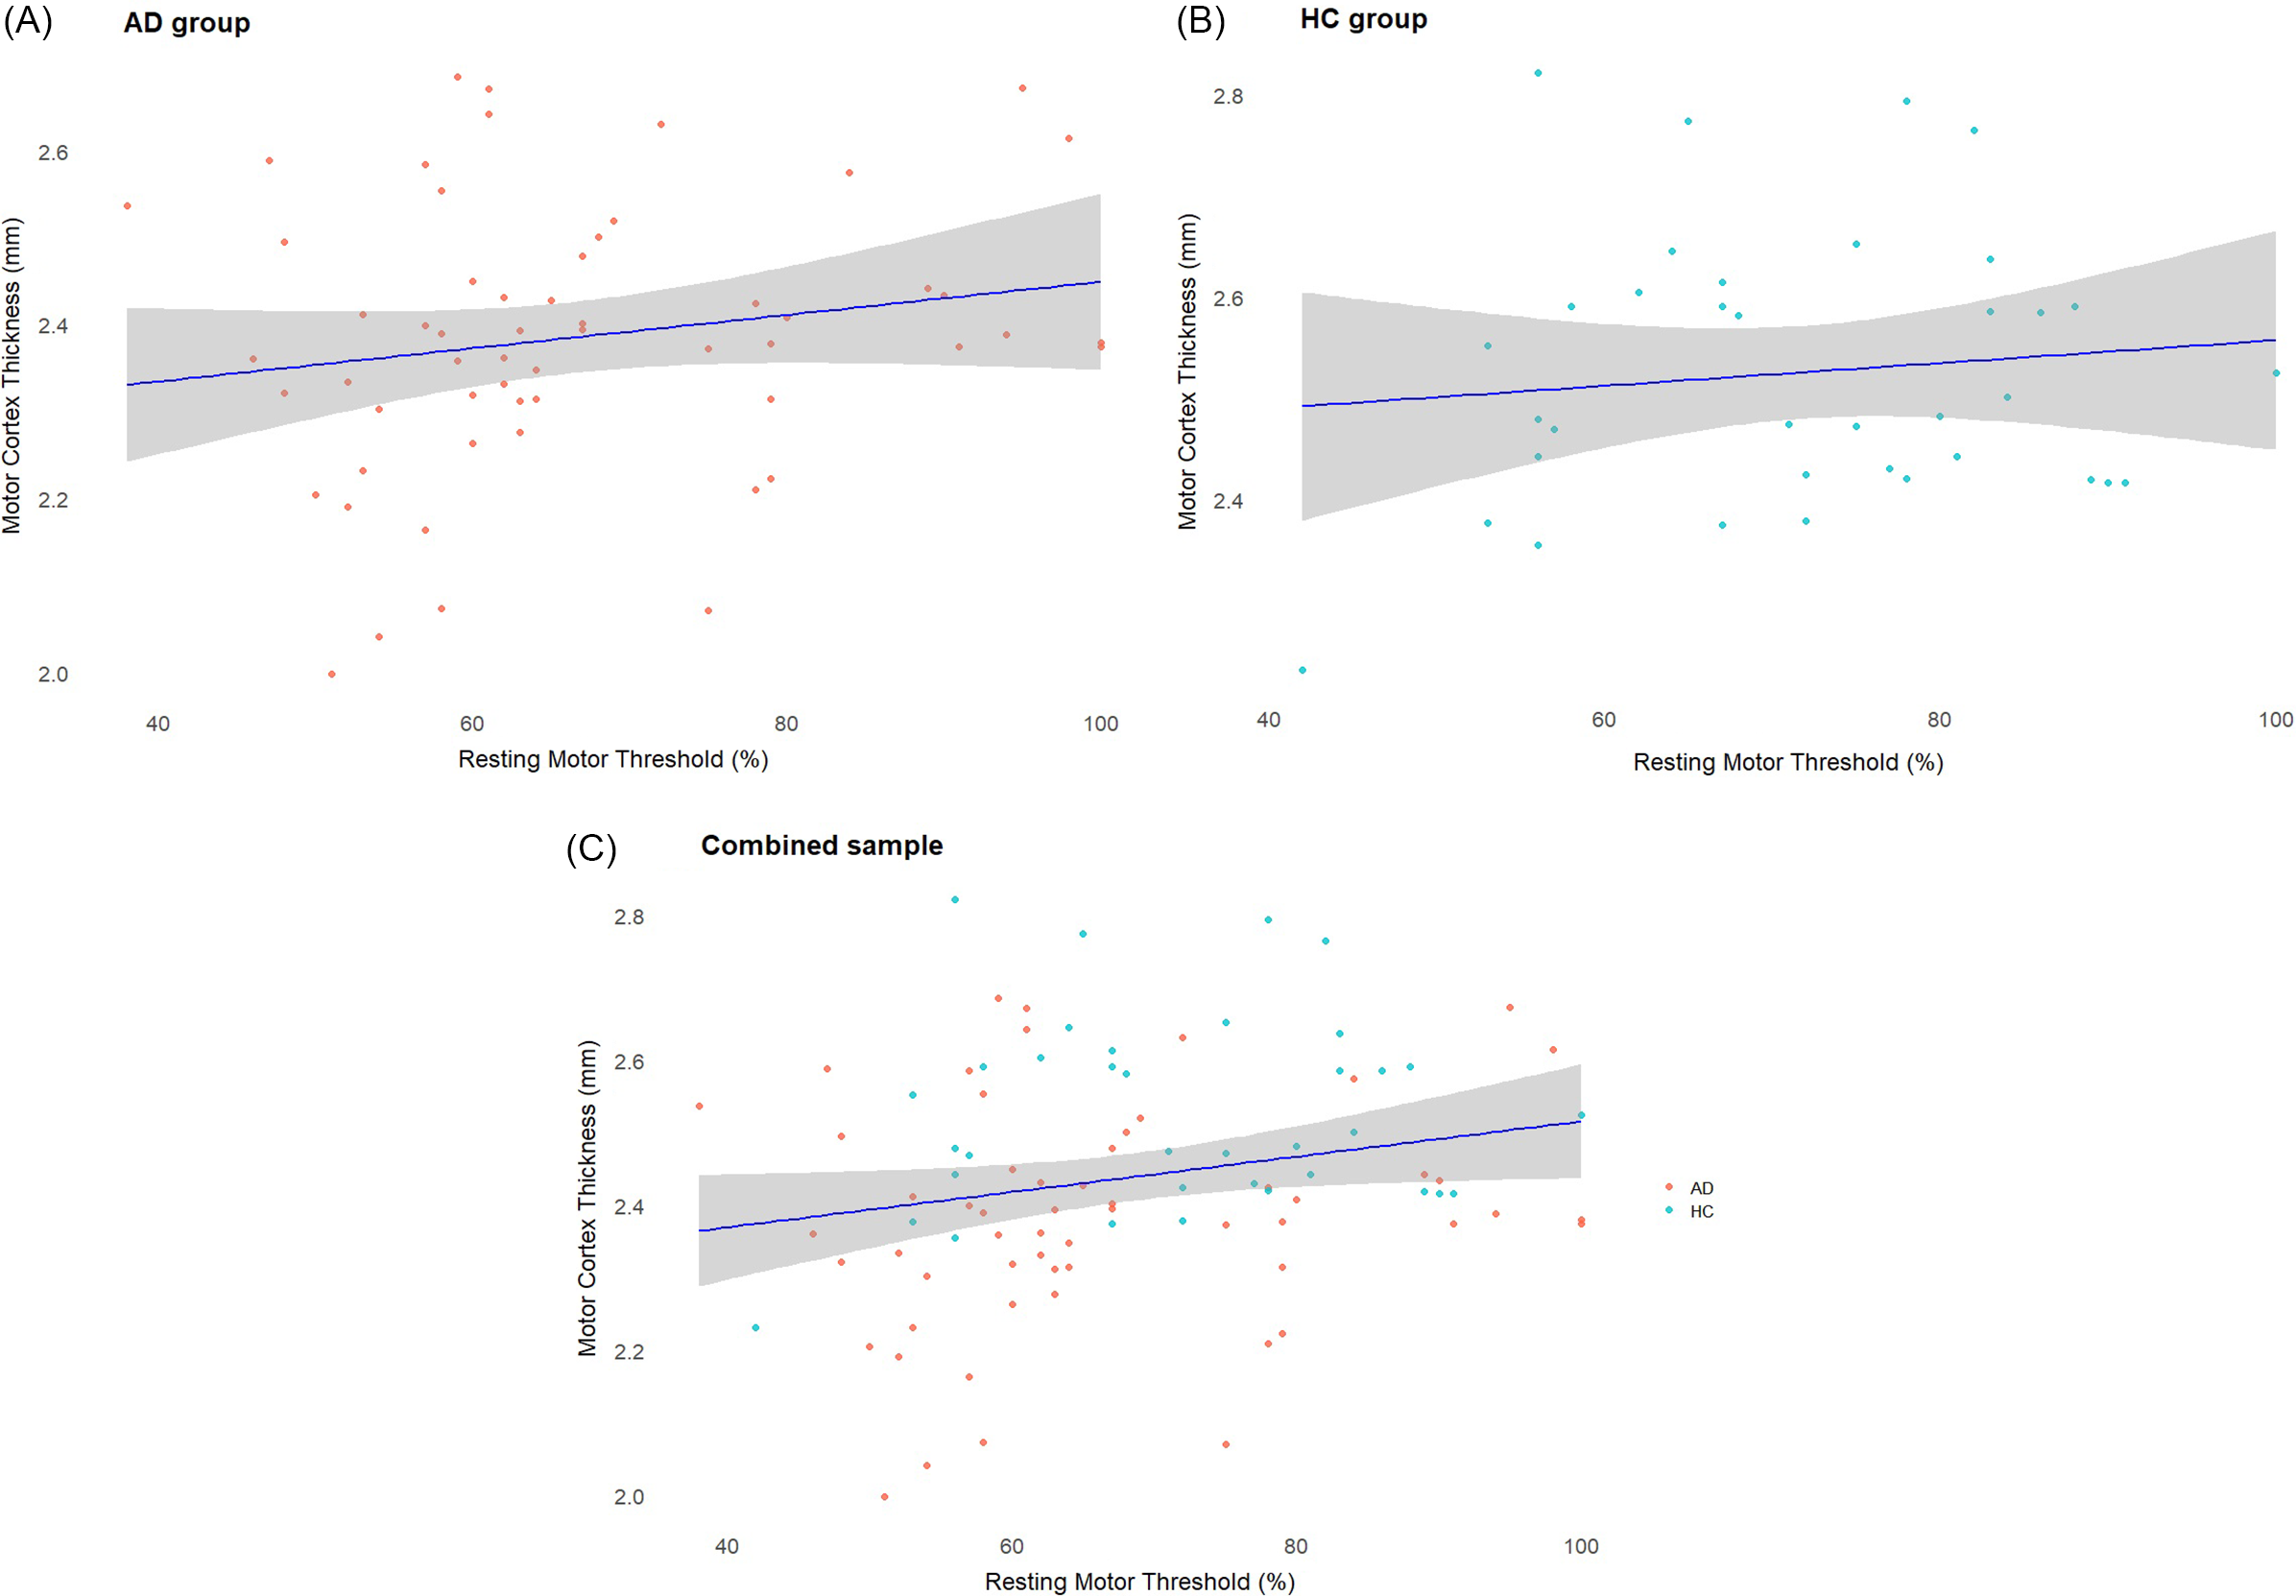
Figure 4. (A) Scatterplot displaying the correlation between motor cortex thickness and resting motor threshold (rMT) in the AD group. (B) Scatterplot displaying the correlation between motor cortex thickness and rMT in the HC group. (C) Scatterplot displaying the correlation between motor cortex thickness and rMT in the whole sample. In the combined sample, rMT was positively correlated with motor cortex thickness (r = 0.2, df = 92, p = 0.036). This association did not remain significant after controlling for age and diagnosis.
Discussion
We observed that both motor cortex thickness and rMT were significantly lower in patients with AD than in HC, which is consistent with the prior literature. In our combined sample of participants with AD and HC, rMT and motor cortex thickness were positively correlated, suggesting that participants with lower rMT (i.e., higher motor cortex excitability) had thinner motor cortex. However, this relationship did not persist after controlling for age and diagnosis (AD or HC). These findings are worth discussing in the context of our current understanding of TMS-induced cortical excitability and its relationship with neurodegeneration.
Brain atrophy is a hallmark of AD and is a marker of neurodegeneration during disease progression through different stages such as amyloidosis, pathologic tau accumulation and eventually cognitive decline.Reference Jang, Kim and Kim30 Thus, our finding of lower motor cortex thickness in AD is indicative of overall brain atrophy as reported in imaging studies that have evaluated cortical thickness at different stages of AD.Reference Querbes, Aubry and Pariente4,Reference Dickerson, Bakkour and Salat7 While motor cortex atrophy may not be the most prominent region effected during the progression of AD, postmortem studies have confirmed a similar concentration of beta-amyloid plaques present in the motor cortex when compared to other common regions implicated in AD (i.e., entorhinal cortex) in both early and late/terminal stages of the disease.Reference Suvà, Favre, Kraftsik, Esteban, Lobrinus and Miklossy31 Normalized cortical thickness indices have been shown to diagnostically differentiate patients with AD from cognitively intact older adults with up to 85% accuracy and may also correctly predict the progression from MCI to AD.Reference Querbes, Aubry and Pariente4 However, it should be noted that these findings could have been influenced by generalized atrophy (as opposed to specific motor cortex atrophy) due to AD. Future studies should consider comparing these associations across other cortical regions.
Our second finding of decreased rMT in patients with AD suggests a state of cortical hyper-excitability in AD. Previous studies have shown a significantly higher TMS-induced excitability of motor areasReference Kumar12,Reference Khedr, Ahmed, Darwish and Ali13,Reference Joseph, Knezevic and Zomorrodi32–Reference Casula, Borghi and Maiella34 and of non-motor areas such as the dorsolateral prefrontal cortex in patients with AD as compared to older cognitively healthy individuals.Reference Joseph, Knezevic and Zomorrodi32,Reference Joseph, Patterson, Wang, Blumberger, Rajji and Kumar35 This finding of higher excitability also correlates with cognitive function in patients with AD.Reference Joseph, Knezevic and Zomorrodi32,Reference Joseph, Patterson, Wang, Blumberger, Rajji and Kumar35 The findings of cortical hyper-excitability in AD could be related to a variety of underlying mechanisms. It has been suggested that the hyper-excitability may be due to dysfunction in the cholinergic transmission that increases excitatory synaptic activity.Reference Ferreri, Pasqualetti and Määttä33 Further, AD mutations such as presenilin-1 or amyloid precursor proteins are also known to increase excitatory synaptic activity.Reference Ghatak, Dolatabadi and Trudler36 Animal studies using transgenic mouse models of AD also support the role of beta-amyloid in neuronal hyper-excitability in ADReference Busche, Chen and Henning37 (Busche et al., Reference Busche, Chen and Henning2012). Thus, future studies should investigate cortical excitability using rMT in association with other established markers of the illness to understand underlying mechanisms.
Our findings also support the association between cortical excitability and thickness. However, the association we found in our combined sample did not persist after controlling for covariates. Age was the only variable that remained significant in our regression model. Several studies have previously explored the relationship between motor cortex excitability and brain atrophy, and the results have been conflicting. One study reported that decreases in cortical thickness were associated with lower cortical excitability,Reference Niskanen, Könönen and Määttä14 while others reported that decreased cortical thickness was associated with increased cortical excitabilityReference List, Kübke and Lindenberg20,Reference Silbert, Nelson and Holman21 the later is consistent with findings in our study. The results reported in Niskanen et al. 2011 may have been different due to the difference in cortical excitability measures used; electrical field motor threshold was used as the measure of motor cortex excitability. Whereas List et al.,Reference List, Kübke and Lindenberg20 Silbert et al.Reference Silbert, Nelson and Holman21 and the current study used rMT as the measure of motor cortical excitability. This discrepancy may also be related to a potential nonlinear relationship between cortical excitability and thickness over the course of illness, which would require further analysis within AD participants (and comparison to HC). Glutamate-mediated excitotoxicity is thought to be related to neurodegeneration in AD, as glutamate concentration above a certain threshold contributes to neuronal loss.Reference Dodd17–Reference Wang and Reddy19,Reference Parsons, Stöffler and Danysz38,Reference Stagg, Bestmann and Constantinescu39 While the initial increase in glutamate transmission may be compensatory in response to neurodegeneration, excess activation could eventually become pathological by contributing to increases in cortical atrophy.Reference Bishop, Lu and Yankner15 This may reflect what was observed in our study; participants with higher motor cortex excitability could be experiencing greater neurodegeneration mediated by glutamate-related excitotoxicity. Future studies should investigate this complex relationship between neurodegeneration and cortical excitability during the course of illness in AD while also accounting for age-related neurodegeneration.
Several limitations of this study should be noted. First, the sample size of this study was not sufficient to examine the relationship between cortical excitability and cortical thickness in individual diagnostic groups (AD and HC alone). We tried to mitigate this by combining the groups and including diagnosis as an independent variable. The data used in our analysis were derived from three studies that were not designed to test the relationships between cortical rMT and thickness. Future studies are needed to address this relationship and the required sample size could be calculated based on our results. Second, we did not use the individualized neuronavigation-based location of the motor hotspot to measure the skull-to-cortex distance in each participant, which may have influenced the relationship between brain atrophy and excitability in AD. Third we were not able to control for medication use and medical comorbidities, which could influence cortical excitability measures. Fourth, the inclusion criteria for our participants with AD and HCs were based solely on a clinical diagnosis rather than pathological biomarker-based criteria. Also, the participants with AD and the HC differ significantly in terms of age and years of education; however, we addressed these differences by including age and years of education as covariates in our analyses. Finally, the cross-sectional nature of this analysis limits the ability to understand causality or changes in the cortical atrophy and excitability over time. Future studies may address these limitations by replicating these findings in large, biomarker-confirmed longitudinal cohorts and also study the influence of the stage of dementia on cortical excitability.
Conclusion
Consistent with previous literature, we observed a higher motor cortex excitability and a lower cortical thickness in participants with AD than in HC. We also found a negative association between cortical excitability and cortical thickness in the combined sample; however, it was not significant after adjustments for covariates. Nevertheless, the effect of age on this relationship remained significant. This suggests that cortical hyper-excitability and excitotoxic neurodegeneration related to age and neurodegeneration interact in complex ways. Future studies are needed to better understand these interactions and the specific mechanisms underlying neurodegeneration.
Acknowledgments
Acknowledgment is made to the donors of Alzheimer’s Disease Research, a program of BrightFocus Foundation, for support of this research.
Author contributions
Study conceptualization: RL, DMB, ZJD, CF, BHM, BGP, TR, AV and SK
Data collection, processing and cleaning: RL, RZ, MJ, HA and GA
Statistical analysis: RL and SK
Manuscript review and editing: RL and SK
Funding statement
This study was funded in part by NARSAD award by Brain and Behavior Foundation to SK, Academic Scholars Award from University of Toronto Department of Psychiatry to SK and the Amgen Scholars Award to Renée Lawson.
Competing interests
RL received 10 weeks of funding from the Amgen Scholars Summer to conduct research at CAMH. DMB has received funding from CIHR, NIMH, Brain Canada, PCORI, Magaventure and Brainsway to conduct investigator-initiated research and holds leadership advisory positions within the Clinical TMS Society, Sooma Medical and the Neurostimulation Procedures Advisory Committee. ZJD has received funding to conduct investigator-initiated research from NIMH, CIHR, Brain Canada, the Temerty Family and the Grant and Kreutzkamp Family Foundations, as well as consulting fees for scientific advisory for Brainsway Inc. ZJD has also received research and equipment in-kind support through Brainsway Inc. and Magaventure to conduct investigator-initiated research. CF has received funding from Hoffman La Roche, Novo Nordisk, Brain Canada, the Hilary and Galen Weston Foundation, Mito 2i, ADDF, NIH/NIA, CCNA/CIHR, Temerty-Tanz and Vielight Inc. CF has also received payment for speaking at the Icahn School of Medicine (Mt. Sinai) and the Care of the Elderly Course, as well as received support to attend the IPA Buenos Aries Meeting. CF has also held a leadership advisory role for IPA BPSD Psychosis. BM has received funding to conduct research from the University of Toronto, CAMH Foundation, Brain Canada, CIHR, Patient-Centered Outcomes Research and NIH. BM has also received honorarium for speaking at the Czarina Santos-Borja MD Memorial Lecture, UMASS Psychiatry Grand Rounds, AAGP Invited Plenary Session, University of Arizona Grand Rounds and the University of Washington. BM has also received equipment from Capital Solutions Design LLC and HAPPYneuron. BGP currently holds a US Provisional Patent Nos. 6/490,680 and 17/396,030 and Canadian Provisional Patent No. 3,054,093 for a cell-based assay and kits for assessing serum anticholinergic activity. TR has received funding through holding the Canada Research Chair, Tier 2 position and received consulting fees for scientific advisory from Biogen Canada in 2022. TR also holds a US Provisional Patent No. 17/396,030 and holds a leadership role on the Board of Trustees of CAMH. TR has also received equipment from Newronika and Scientific Brain Training Pro. AV has received funding from NIMH, CIHR, the Canada Foundation for Innovation, CAMH Foundation, University of Toronto, Brain Canada and the Wellcome Trust.


 Open access