


1. Introduction
Floor plan layouts (FPLs) are systems that perform functions and processes resulting in outputs defined by spatial configurations. FPL spatial planning is considered a challenging, complex and wicked problem (Papalambros & Wild Reference Papalambros and Wild2000, p. 6; Helme, Derix & Izaki Reference Helme, Derix and Izaki2014; Bahrehmand et al. Reference Bahrehmand, Batard, Marques, Evans and Blat2017; Wortmann Reference Wortmann2018, p. 64). It is an important task in the conceptual phase of the architectural design process and involves an area of design that continues to receive a great deal of attention (Jo & Gero Reference Jo and Gero1998). In this phase, decisions are made that define the solution to the FPL, which are also relevant to the performance of the building and are very difficult to change in later phases of the design process (Rodrigues, Gaspar & Gomes Reference Rodrigues, Gaspar and Gomes2014). Although there are many similarities between planning and design, the function of planning involves implementing a set of actions, whereas the function of design is to capture individual solutions to specific problems, which include the attributes and relationships of a geometric and topological nature, as well as intrinsic and important properties of the architectural form of the house. However, design involves more than this, which raises questions about how to achieve the desired goal due to the lack of an effective description of how to capture the solution to the problem and a lack of criteria for evaluating it (Hensel Reference Hensel2012, p. 47). Thus, the act of designing can be understood as a decision-making process (Rosenman, Gero & Oxman Reference Rosenman, Gero, Oxman and Schmitt1991; Papalambros & Wild Reference Papalambros and Wild2000). The solution to the FPL is a fundamental issue for architecture and is problematic for the architect both due to the complexity of the design process and because there is no general and precise method for its solution; it therefore constitutes an ill-structured problem (Lobos & Donath Reference Lobos and Donath2010). Attributes and relationships of a geometric nature play a key role in the architectural design process, especially in the context of a graphic and descriptive representation of the FPL solution and in the exploration and quantitative evaluation of the design (Dino Reference Dino2016), and it has even been suggested that this is the only possible way to evaluate and optimize the FPL of a house (Medjdoub & Yannou Reference Medjdoub and Yannou2000). This is because the direct measurement and evaluation of the design quality of a house still pose a challenge (Gann, Salter & White Reference Gann, Salter and Whyte2003; Vivienne Reference Vivienne2015, p. 10), which can only be overcome by identifying a geometric solution for the FPL that enables good house performance and by creating a model to define and evaluate it (Lawson Reference Lawson2005, p. 63; Bao et al. Reference Bao, Yan, Mitra and Wonka2013). A good design solution that supports the required performance of the house adds economic value to the artifact and offers use value to the user; it also reduces or eliminates the negative unintended consequences of losses resulting from a poor solution, which can impair the lives of the house’s users (Papalambros Reference Papalambros2015). Performance is a key aspect of meeting this challenge. In view of this, the concept of defining performance through the physical functional characteristics of the house is used here. This concept is supported by the application of Japanese industrial quality standards, which define quality as the totality of performance characteristics that can be used to determine whether a product or service conforms to its intended use (Thomson et al. Reference Thomson, Austin, Devine-Wright and Mills2003). With the aim of investigating and demystifying the problem of architectural design, particularly for students, with regard to the generation of the FPL of a house, and to offer solutions that assist them in the field of action-decision of design variables, a computational tool is proposed, called ARLE GPS (ARcher − systematic model + LEqc − Layout Evaluation of the quality and cost + GPS − Geometric Planning Solver). This dedicated tool allows for the grouping and application of an ecosystem of models, principles, approaches and strategies, including procedures for structuring a design process, collecting data, defining requirements and objectives, simulating and evaluating candidate solutions, and establishing an ideation method. It was designed with the aim of supporting students in dealing with the problem of spatial planning and design of a house (Gericke, Eckert & Stacey Reference Gericke, Eckert and Stacey2022). However, the intention is that the tool will assist not only students who are at the early stages of contact with the complex problem of design (Lawson Reference Lawson2005, p. 31), but also architects who have already passed through this phase. This goal of supporting both types of decision makers will be referred to here as ‘supporting architects’. The term ‘house’ is used here to describe the artifact of a verticalized house, although the tool is fully available to architects for the task of designing detached houses.
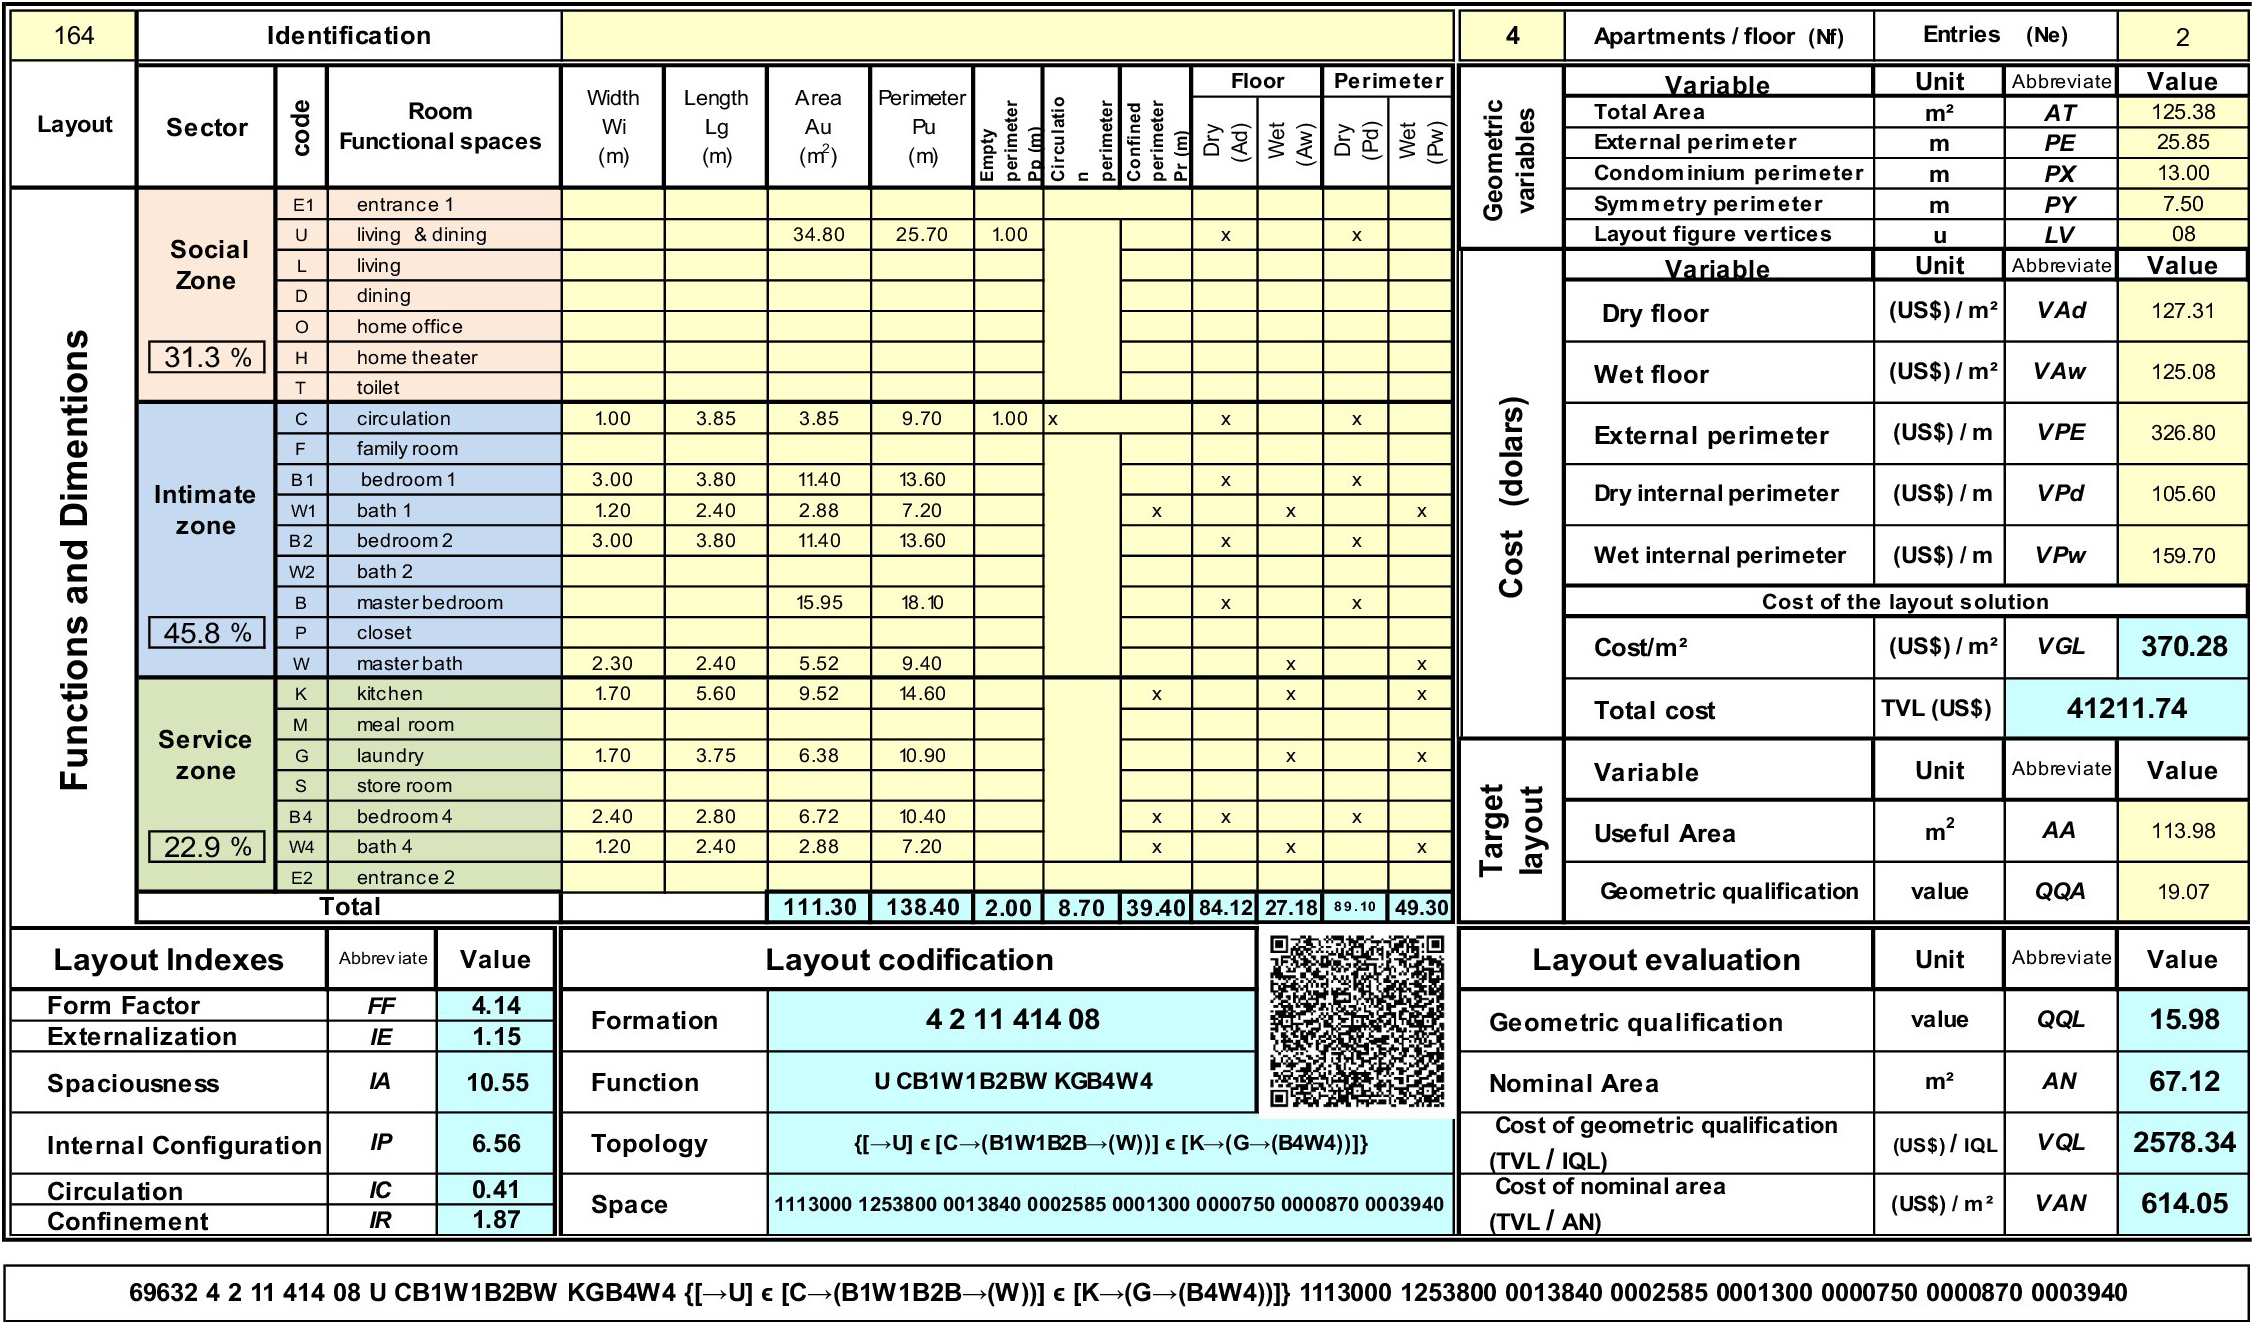
The tool was developed as an analogy model of the geometric qualification of the FPL in relation to the functional physical performance of a house. The starting point for the structuring of the ARLE GPS tool was an analogy model proposed by Martins (Reference Martins1999), which can act as a collector, processor and transmitter of information about the functional physical performance of the house in relation to the geometric design variables of the FPL (Gane & Haymaker Reference Gane and Haymaker2012). The transposition of this analogy model to the spatial planning task of FPL is carried out by means of the computational tool ARLE GPS, which is programmed in the form of a spreadsheet (Excel) and is accessible via the link ARLE GPS. As shown in Table 1 and illustrated in Figure 16, the spreadsheet enables geometric planning and evaluation of the qualification of FPL 164.
Table 1. Geometric planning of FPL 164.
The geometric variables are captured, analyzed and evaluated in comparison with the house performance using a numerical method. In this way, the proposed mathematical model defines a law of relationship between the objective of the geometric qualification solution and the action directed through the geometric variables to promote this qualification (Martins Reference Martins1999). The mathematical model used to convert the analogy model is obtained through statistical processing of a design space consisting of 177 FPLs of apartments. It is defined based on a power regression curve according to the model proposed by Kirkpatrick (Reference Kirkpatrick1970, p. 8), as shown in Figure 1.
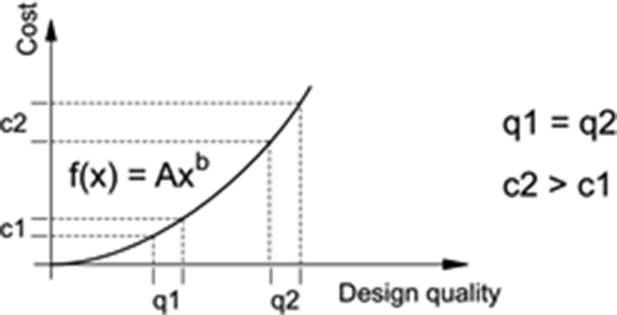
Figure 1. Model of design quality versus cost (Source: Kirkpatrick Reference Kirkpatrick1970).
The mathematical model is established based on a cubic power curve, y = Ax3, and defines the law of analogy that relates the variables involved in the geometric modelling of the FPL to the functional physical performance of the house (Martins Reference Martins1999), as shown in Figure 2.
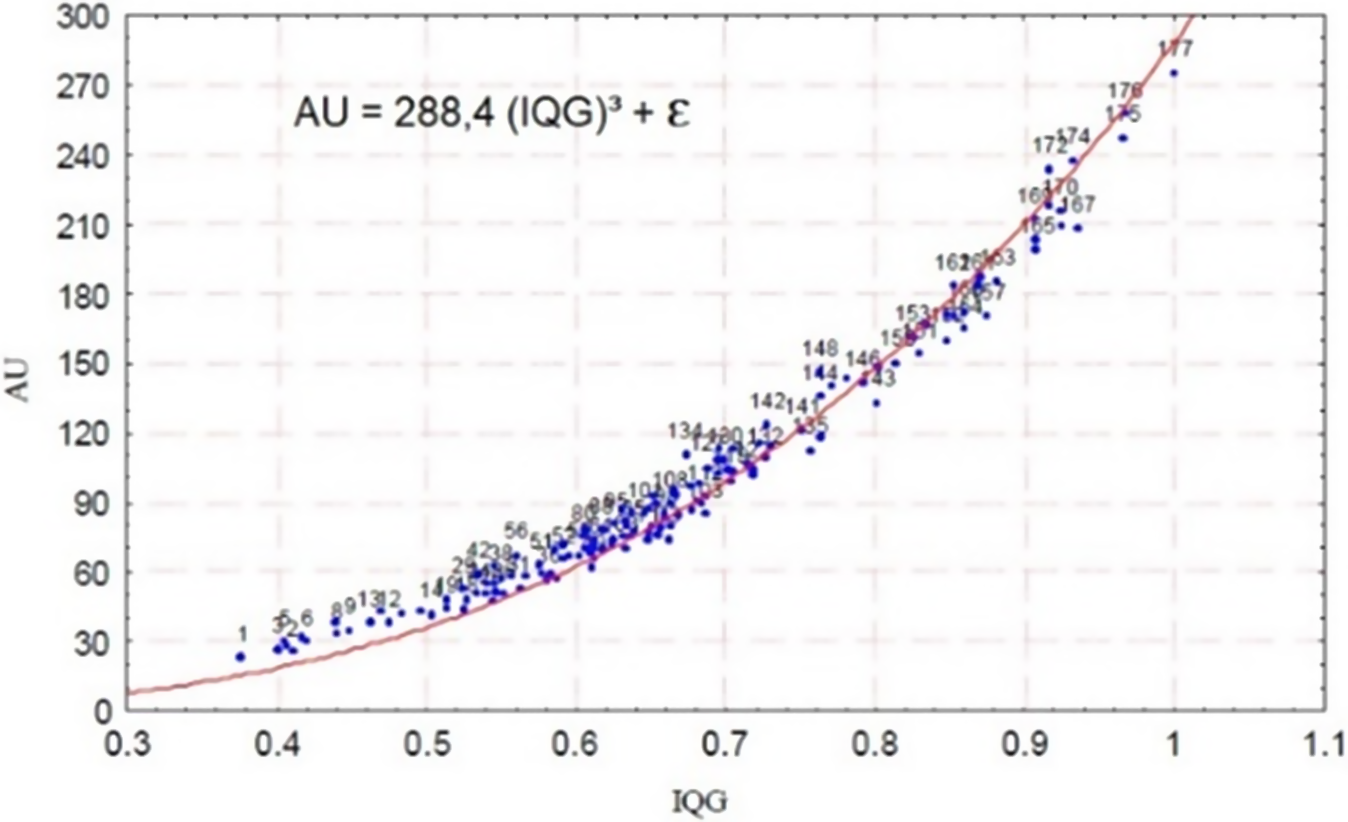
Figure 2. Regression model: cost × quality (source: Martins Reference Martins1999).
The generated physical law shown in Figure 2 indicates that the mathematical model is consistent. It varies on a continuity scale (Papalambros Reference Papalambros2002), and has a high coefficient of determination, R2 = 0.994, a condition that supports its validation (Kleijnen & Sargent Reference Kleijnen and Sargent2000; Simpson et al. Reference Simpson, Poplinski, Koch and Allen2001; Kleijnen Reference Kleijnen2017). The geometric variables are processed by the mathematical model under the assumption of the same degree of importance, i.e., the same weights. The consistency and robustness of the mathematical law of analogy can be measured by the statistical treatment of the project space shown in Figure 3, which consists of 180 FPL apartments with two, four or eight units per floor, one or two accesses to the external surroundings, between nine and fifteen rooms, usable areas of between 52.70 and 149.11 m2, and a functional classification of three bedrooms, as shown in Table 2. The result of processing the explored design space of 180 FPLs is presented in Figure 3, and shows the behavior of the house performance, as captured by eight families of geometrically qualified FPLs.

Figure 3. Geometric qualification of FPLs in the design space.
Table 2. 180 FPL data.

Six families of FPLs are statistically defined according to their geometric qualification, and two families that define the boundary regions of low and high qualification are modeled using the ARLE GPS mathematical model, according to the explored design space. The model indicates that the geometric cost of achieving a given range of house performance increases with the performance requirements.
This property of the mathematical model can be demonstrated using the performance curve equations obtained from the statistical processing of the design space. For example, using the level eight equation describing the geometric cost of house performance in the high-performance range (shown in Figure 3), it can be seen that adding one point to the geometric QQL qualification of the FPL in the range 15.5 to 16.5 involves a geometric cost of 12.60 m2, whereas adding one point in the QQL range 18.5 to 19.5 involves a geometric cost of 17.76 m2. This is also a condition found in products with high levels of embedded technology, such as computers and avionics. The mathematical model is converted into the surrogate model or LEQC metamodel to simulate the performance of the house, as determined by the geometric qualification of the FPL. At this stage in the process of structuring the LEQC meta-model, a cost model is incorporated. The monetary cost calculation model for the house is implemented using the same geometric variables as the FPL design. Consequently, this choice allows the architect to evaluate the cost of design decisions made in the FPL geometric planning. The model directly computes the monetary cost of converting the FPL geometric variables into the house artifact, following the methodology presented by Martins, Jungles, and Oliveira (Reference Martins, Jungles and Oliveira2023). The LEQC metamodel then calculates the values of the FPL geometric qualification indices, their geometric qualification, QQL, and their geometric and monetary costs, thus determining the geometric and monetary costs of geometric qualification (shown in Figure 4). The geometric qualification indices of the FPL aim to assess and ensure the tangible performance required of the house (Volker Reference Volker2008; Vivienne Reference Vivienne2015, p. 37; Dino Reference Dino2016). The LEQC metamodel is structured by the analogy model proposed by Martins (Reference Martins1999), the mathematical model/law advocated by Kirkpatrick (Reference Kirkpatrick1970), and the cost model presented by Martins, Jungles and Oliveira (Reference Martins, Jungles and Oliveira2023). The information and instructions provided by Archer’s systematic model (Reference Archer1968) are used, together with the conceptual model for remodeling the design solution space proposed by Gero (Reference Gero and Parmee1998), and the concept of the general problem solver (GPS) presented by Simon (Reference Simon1973). The structuring of a rational design methodology through a mathematical model, based on the vision of renowned scientists (researchers), in terms of problem definition, exploration, experimentation and evaluation, makes it possible to create a tool that enables the architect to make decisions and implement robust actions in a process of continuous evolution throughout the design activities and hence to obtain optimized and validated solutions (Schaathun Reference Schaathun2022).
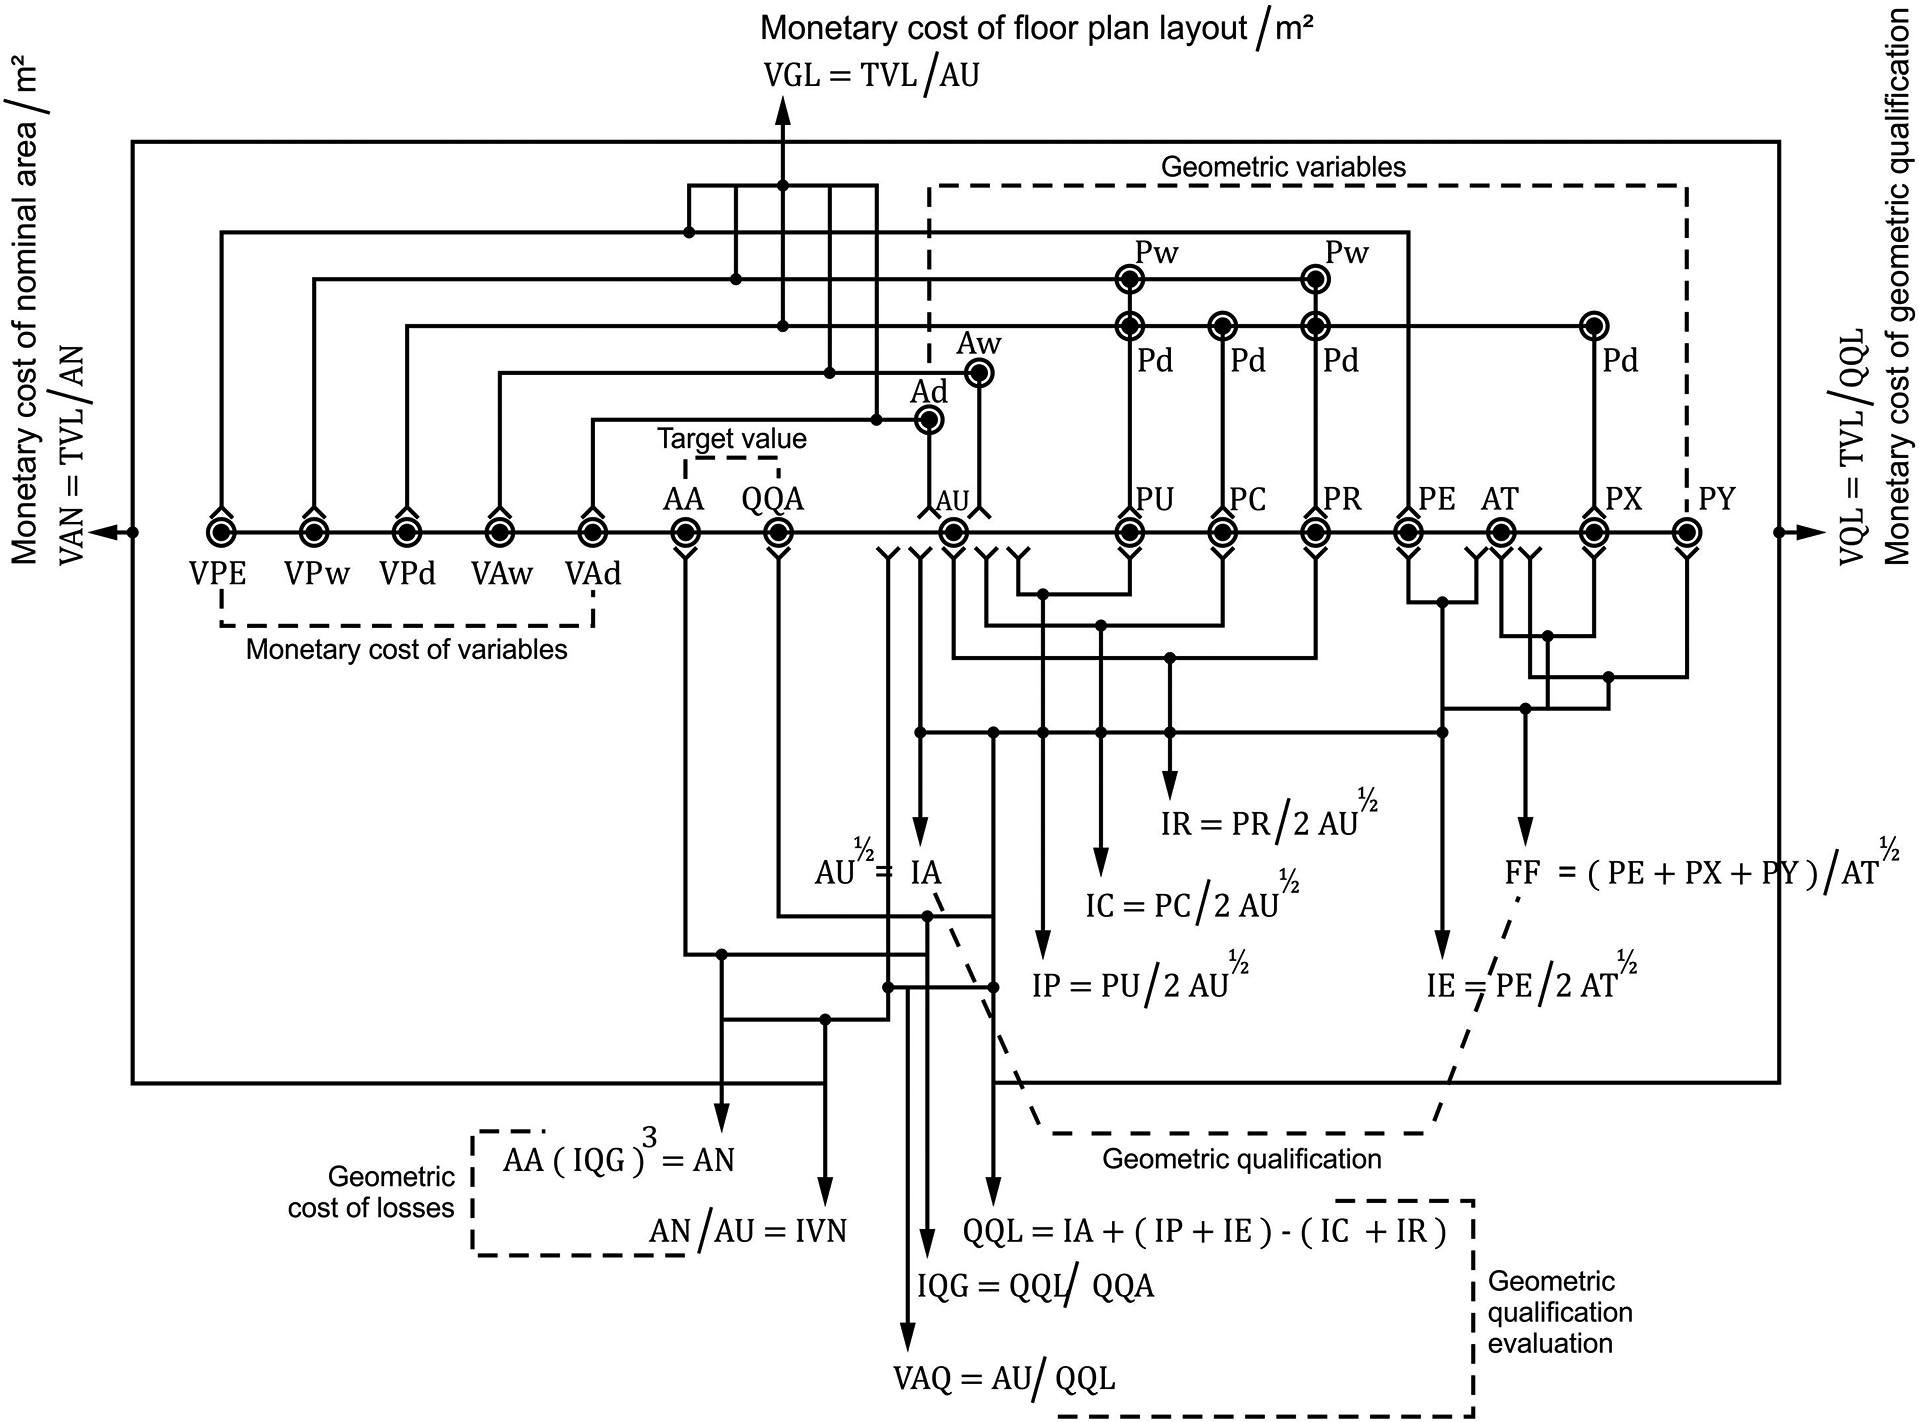
Figure 4. LEQC metamodel.
AU = useful surface area; AT = total surface area; AA = target surface area; PE = external perimeter; PU = internal perimeter; PX = condominium perimeter; PY = symmetry perimeter; PC = circulation perimeter; PR = confined perimeter; Ad = sum of the useful areas of the dry rooms (horizontal plane); Aw = sum of the useful areas of the wet rooms (horizontal plane); Pd = sum of the perimeters of the dry rooms (vertical plane); Pw = Sum of the perimeters of the wet rooms (vertical plane); IA = spaciousness index; IP = configuration index; IE = exteriorization index; IC = circulation index; IR = confinement index; FF = form factor; VPE = cost of external vertical plane; VPw = cost of the wet internal vertical plane; VPd = cost of the dry internal vertical plane; VAd = cost of the dry horizontal plane; VAw = cost of the wet horizontal plane; QQA = target geometric quality; QQL = geometric quality of the layout; IQG = index of geometric quality; IVN = index of cost of losses; AN = geometric cost of losses; VGL = unitary monetary cost; VQL = monetary cost of geometric quality; VAN = monetary cost of losses; VAQ = geometric quality cost.
The cost of the horizontal plan is defined by the cost of finishing the floor of the room (wood laminate, carpet, ceramic material) and the surface of the ceiling of the room (mortar, paint, plaster, plastic laminate), considering their locations in dry rooms VAd (living room, bedroom) or wet rooms VAw (bathroom, kitchen). The cost of the vertical planes is defined by the construction cost of the internal and external walls, halved longitudinally, resulting in two halves and three perimeters: VPd (dry), VPw (wet) and VPE (external). It also takes into account the respective finishes (VPd – mortar, plaster, paint; VPw – ceramic material; VPE – mortar, paint, ceramic material, glass), components (sill) and connections (door, window), and calculates their height, which is equal to the distance from the floor to the ceiling. The cost of transforming the FPL into a house is calculated using the geometric variables used to assemble the FPL, according to the methodology presented by Martins, Jungles and Oliveira (Reference Martins, Jungles and Oliveira2023), and does not include the cost of the building structure, installations and materials (electrical, hydraulic, logic), and the other materials and services used to construct the building. The design space explored here comprises 71 apartment clusters with different functionalities, as shown in Table 3.
Table 3. Clusters of apartments based on functionality.

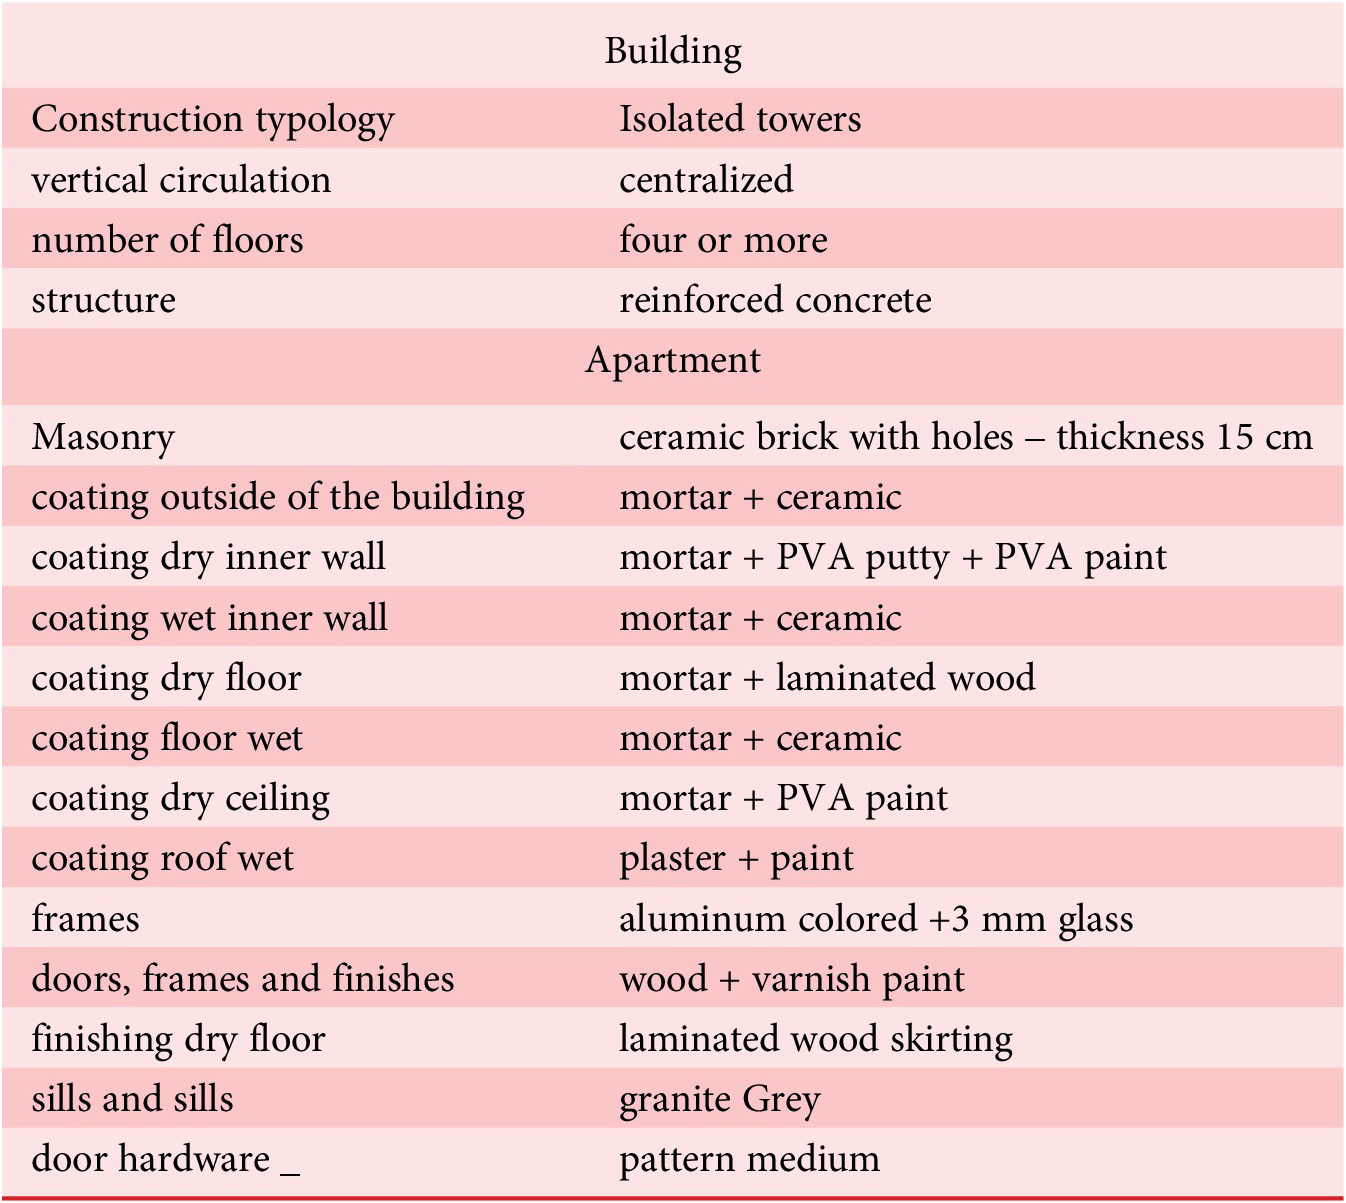
The design space consists of dwellings that have certain similarities in terms of the constructive and structural typology of the buildings, as well as the constructive similarity, height and finishing pattern of the dwellings, as shown in Table 4.
Table 4. Constructive characterization of building and apartments.
The design space consists of flats (FPLs) located in 77 buildings with two flats per floor, 102 buildings with four flats per floor, and one building with eight flats per floor (FPL 37). The composition of the apartments in terms of the number of units per floor is an indirect parameter that directly influences the performance of the apartment through the parameter of confinement. Apartment FPL 37 is part of cluster U CB1W1B2BW KG (Figure 5, Table 5); it consists of nine rooms, eight of which are living rooms and one of which is a circulation room, with three enclosed living rooms. The adoption of eight dwellings per floor produces solutions in the form of FPLs with low geometric qualification compared to solutions with four or two units per floor, as shown in Figure 6a. This result is demonstrated by evaluating the geometric qualification of FPL 37 and calculating its geometric losses with respect to the target FPL 59 (AU = 75.97 m2 and QQA = 16.66), which is representative of an apartment located in the high-performance region of the studied design space, as shown in Figure 3. The calculated losses in this case are 32.56 m2, which represents a large geometric loss, as shown in Table 5. By analogy, this geometric loss refers to the design of a dwelling that suffers large losses in functional performance during its service life (Martins Reference Martins2022a).
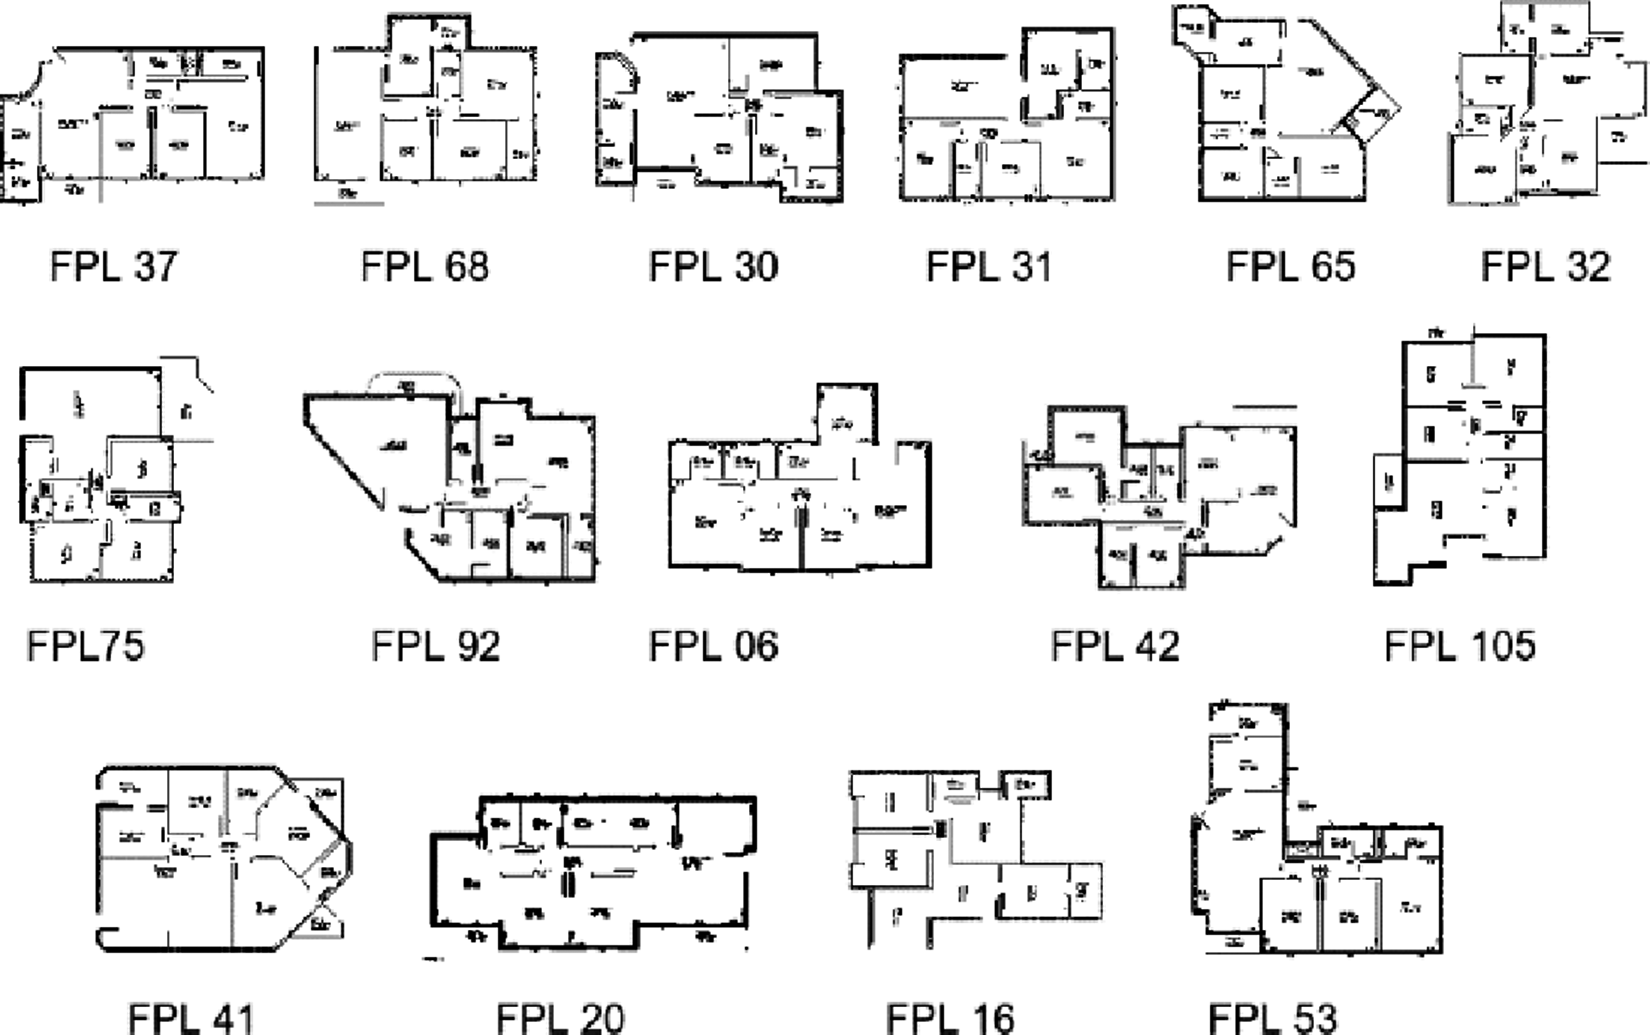
Figure 5. FPL cluster U CB1W1B2BW KG.
Table 5. Data of cluster U CB1W1B2BW KG.
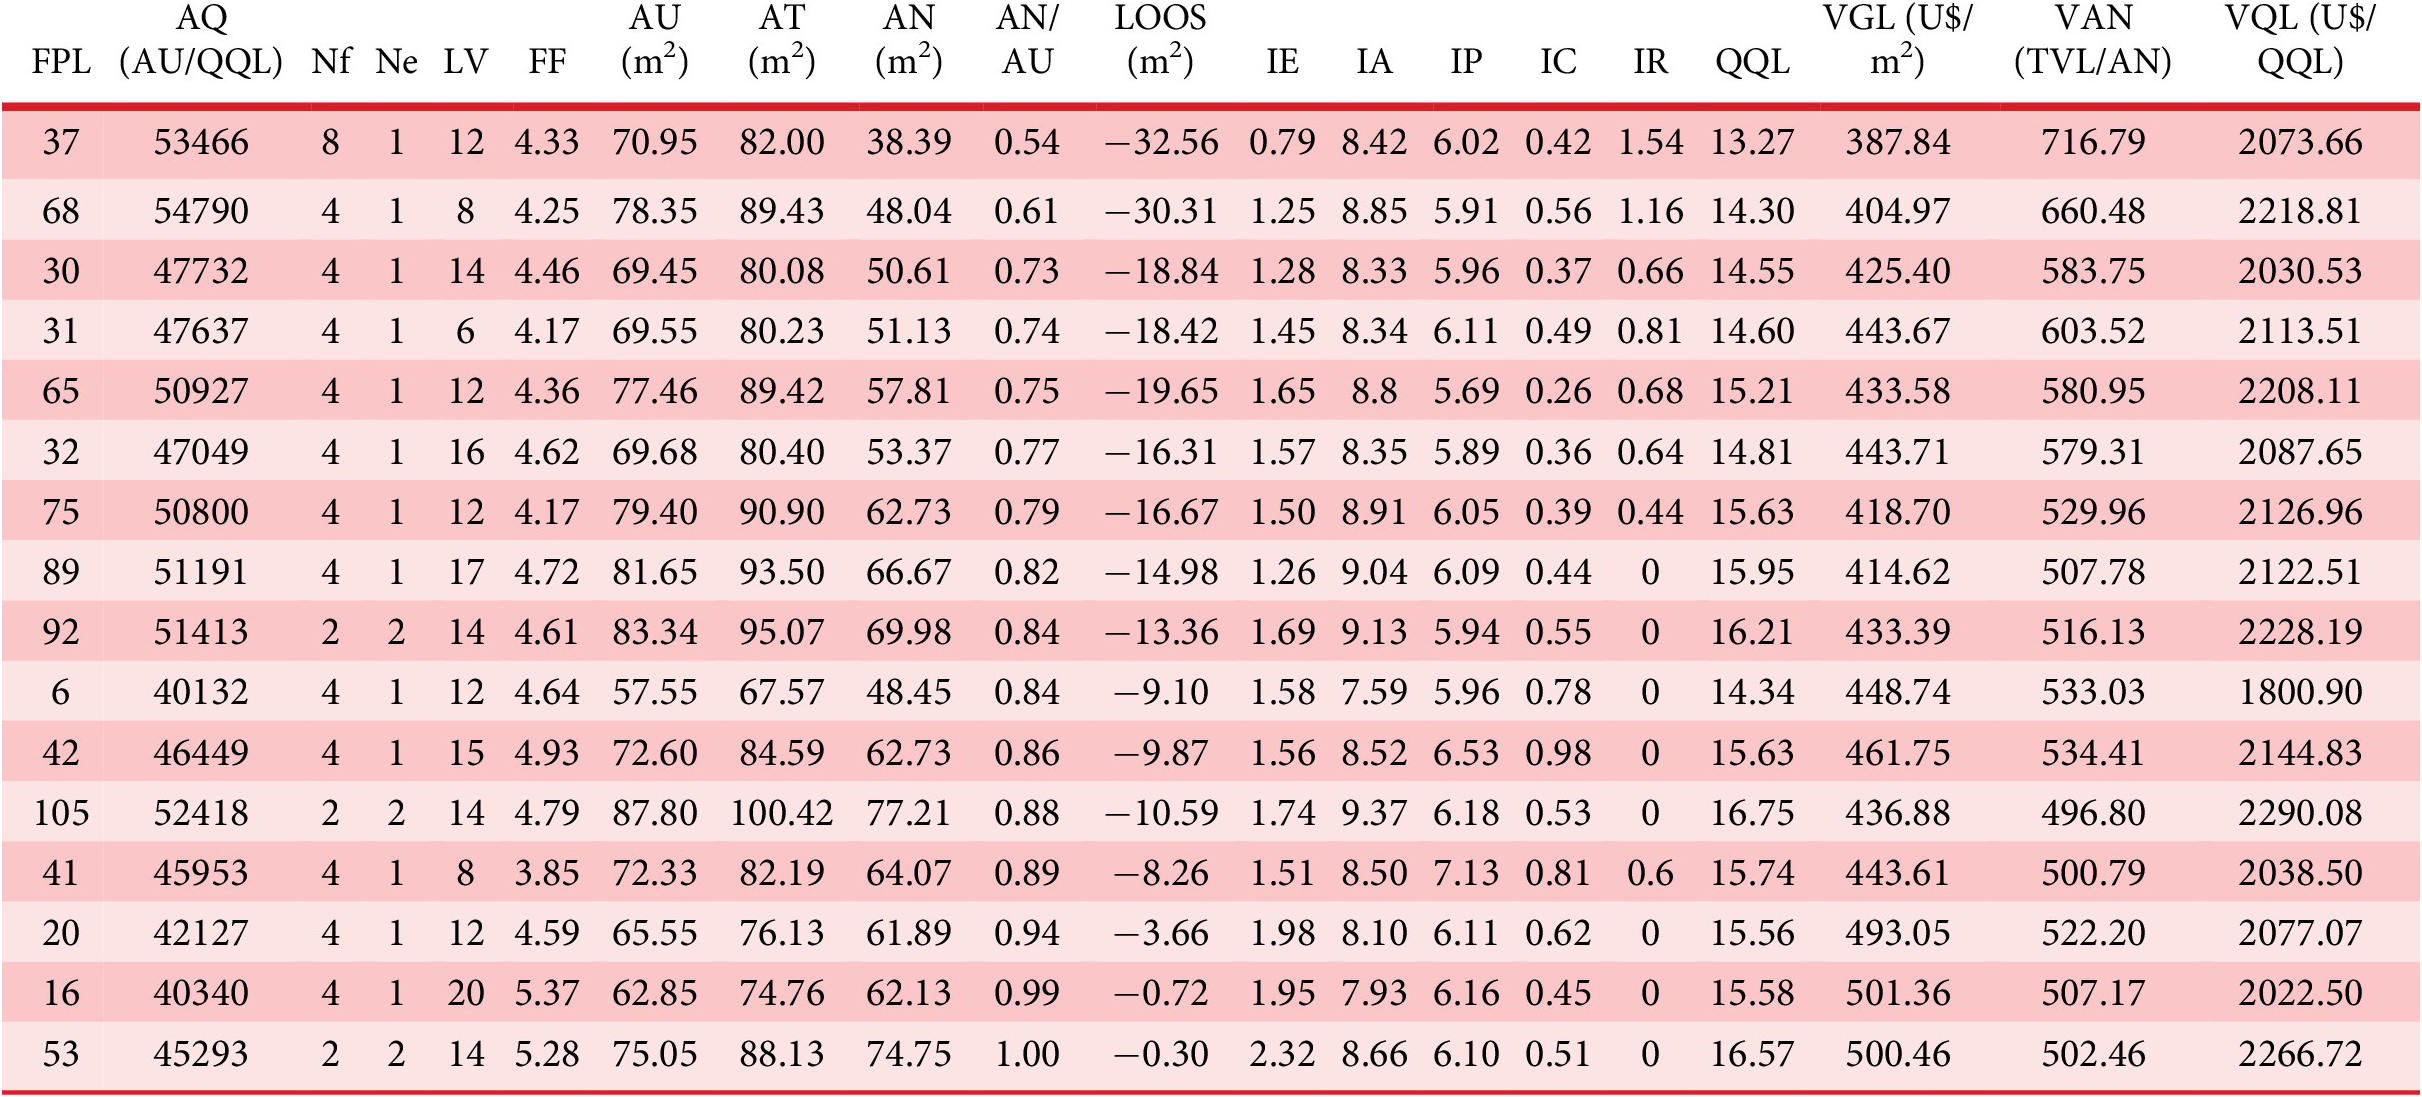
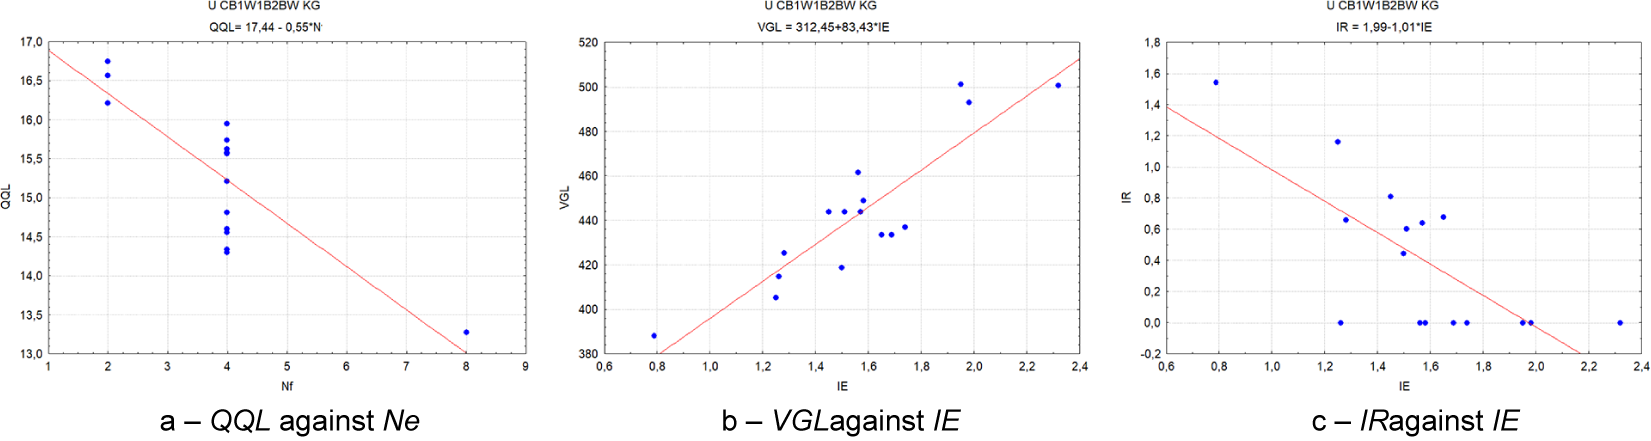
Figure 6. (a) QQL versus Ne; (b) VGL versus IE; (c) IR versus IE.
2. Geometric qualification of the FPL versus house performance
The design process of a house involves questions about the difficulty of describing and applying indicators of design quality. There is no agreed definition of design quality, nor is there a metric for its evaluation, something that has been discussed for some time and remains without a definitive answer (Michalek, Choudhary & Papalambros Reference Michalek, Choudhary and Papalambros2002, p. 10–12, Dino Reference Dino2016). The only means available to meet this challenge is to define a design that enables the fulfilment of the performance requirements of the house. The performance of the house, on the other hand, is related to criteria of a dimensional and topological nature that must be established to satisfy the functional and usability demands desired by the user (Ibrahim Reference Ibrahim2011, p. 21; Basarir Reference Basarir2018, p. 5). The importance of meeting these requirements can be inferred from the significance assigned by the architect to meeting the functional dimensioning needs of the house (Savoini & Lafhaj Reference Savoini and Lafhaj2017). Functional dimensioning is achieved through the optimized dimensioning of the rooms of the house, according to their functional purpose. It is related to the area required for the distribution of furniture and equipment, as well as the areas required for the circulation, access and work of the users (Deilmann et al. Reference Deilmann, Kirschenmann and Pfeiffer1973). It is also related to the dimensions and magnitude of human articulatory movement (Panero & Zelnik Reference Panero and Zelnik1996). Functional dimensioning is a critical aspect of the design of the FPL of the house, as it is one of the factors that influences the user’s perception and evaluation of the house’s performance (Brown & Steadman Reference Brown and Steadman1991a; Brown & Steadman Reference Brown and Steadman1991b). Optimization of the geometric solution of the FPL is established by the LEQC metamodel through a solution that minimizes the geometric variables area and perimeter corresponding to the functional dimensioning of the rooms (Martins, Jungles & Oliveira Reference Martins, Jungles and Oliveira2023). However, only the architect can guarantee that functional dimensions have been established for the rooms. The size of the rooms is one of the factors evaluated by the authorities when approving the design and construction of a house, and its importance can be deduced from the analysis of the housing quality indicators used in the design assessment of social housing in the UK. These indicators state that room sizes greater than 10% or less than the size required by the functional dimensioning of FPL indicate poor planning of the house and the need for a design review (HQI 2008). This importance is reaffirmed by examining architects’ assessments, as reported in a survey entitled Optimization in Architectural Practice, of the functional physical attributes they are interested in optimizing in a house. They point out that the main attributes are natural light, circulation, and the form and structure of the layout, a finding that reveals the relevance of geometry in optimizing the FPL solution (Cichocka & Musikhina Reference Cichocka and Musikhina2014; Cichocka, Browne & Rodriguez Reference Cichocka, Browne and Rodriguez2017). The requirements for the performance of the house can be captured and transferred to the geometric design of the FPL using the analogy model presented below.
3. LEQC analogy model
The establishment of an analogy model was the first step in the construction of the ARLE GPS computational tool. The model was defined through the collection, quantification and qualification of the geometric variables of the FPL in comparison with the functional and usability performance of the house (Martins Reference Martins1999). The FPL consists of a graphical representation in the 2D plane and is configured based on the geometric variables of area and perimeter, which describe the representative polygons of the rooms of the house and quantify and qualify the spaciousness and configuration of the house. Spaciousness is defined by the amount of surface area available for room modelling. This surface area is divided by generatrices that form the contours or perimeters that delimit the walls of the rooms thus defining the vertical planes and delimiting the closed shapes of the rooms, and revealing their configuration (Lobos & Donath Reference Lobos and Donath2010; Merrell et al. Reference Merrell, Schkufza and Koltun2010; Rodrigues, Gaspar & Gomes Reference Rodrigues, Gaspar and Gomes2013). The configuration of the FPL is a parameter of the subjective quality of the design solution (Manning Reference Manning1991; Malnar & Vodvarka Reference Malnar and Vodvarka1992). This parameter is evaluated through the existing dialogue between the horizontal and vertical planes of the rooms (Consiglieri Reference Consiglieri1995, p. 54), which captures and evaluates the geometric features most suitable for optimizing the geometric solution of the FPL, as well as making it possible to qualify this solution (Guerra Reference Guerra and Broadbent1971; Baker Reference Baker1991). The LEQC metamodel uses the variables of area and perimeter (Costa & Cesar Reference Costa and Cesar2001, Section 1.3–2.3; Franz et al. Reference Franz, Von der Heyde, Bulthoff, Martens and Keul2005) to capture, quantify and qualify the configurational performance of the rooms of the house, using the ratio perimeter/√area (Martins Reference Martins1999; Demetriou, See & Stillwell Reference Demetriou, See and Stillwell2013; D’Amico & Pomponi Reference D’Amico and Pomponi2019). This ratio has the property of being invariant under the geometric transformations of dimension change, translation and rotation (Montero & Bribiesca Reference Montero and Bribiesca2009). The acquisition, quantification and qualification of the geometric variables of the FPL were established by Martins (Reference Martins1999) based on the correlations between the dimensions, positions and contributions of the geometric variables of the FPL, which can represent the performance of the house. These aspects were established through the analysis and statistical processing of a design space of 177 FPLs of dwellings with functional configurations from one to four bedrooms and useful areas (AU) of between 23.2 m2 and 275.4 m2. The metrics used to capture and quantify the geometric variables of the FPL were presented by Martins, Jungles and Oliveira (Reference Martins, Jungles and Oliveira2023). The qualification of the geometric variables used to structure the analogy model is defined by the indices used to capture, quantify and qualify the variables of surface area and the internal, external, condominium, symmetry, circulation and confined perimeters, using the following analogy.
3.1. Useful surface area (AU)
The useful area is equal to the area of the polygon of the room contour (Au), and the sum of the useful areas of the FPL gives the useful area of the house (AU), which defines the horizontal plane used to structure the FPL. This value represents an indicative and primordial parameter of the performance of the house, as well as providing a benchmark of its functionality and marketability (house area) (Medjdoub & Yannou Reference Medjdoub and Yannou2000; Hillier Reference Hillier and Hillier2007, p. 19; Steadman Reference Steadman2008, p. 70). A dimensional increase in this parameter (spaciousness) defines the direction of maximizing the performance of the house; however, optimization of the geometric solution of the FPL by ARLE GPS is done by minimizing the geometric variable of useful area, which corresponds to the functional dimensioning of the rooms (Martins, Jungles, & Oliveira Reference Martins, Jungles and Oliveira2023). Its contribution to the qualification of the FPL is calculated by the index of spaciousness (IA = √AU). A calculation of the spaciousness based on the useful area makes it possible to isolate the thickness of the wall of the FPL, enabling the use of a sketch defined by lines to capture, quantify and evaluate all its geometric variables.
The perimeters are used to demarcate the walls and to create the vertical planes of the house. They define a series of parameters that capture the performance of the house and successively transfer their share to the FPL qualification. They can be divided into four categories: internal, external, condominium and symmetry perimeters. Their qualification is defined according to their position in the FPL structure, by analogy with the function they perform in delimiting the performance of the house. The four categories of perimeters are described in more detail below.
3.2. Internal perimeter (PU)
Internal perimeters affect the performance of the house by generating a system of vertical planes for the house. These planes define the demarcations of the walls, which represent the physical boundaries of the rooms and reveal their spatial configuration (Peponis et al. Reference Peponis, Wineman, Rashid, Hong Kim and Bafna1997; Medjdoub & Yannou Reference Medjdoub and Yannou2000; Sönmez Reference Sönmez2015). The walls also have the function of supporting access or communicability between rooms and with the external environment, as well as providing physical support for the arrangement of furniture and equipment. Thus, they contribute to the performance of the house and consequently transfer to the FPL its share in the qualification of this performance, which is calculated by the configuration index (IP=PU/(2√AU)). The value of two in the denominator arises from the conversion of the perimeter variable to its equivalent of a wall (as a wall is equal to two perimeters). However, internal perimeters are treated as non-contributors to house performance when they refer to enclosed or circulation rooms (Nagy et al. Reference Nagy, Lau, Locke, Stoddart, Villaggi, Wang, Zhao and Benjamin2017). Enclosed rooms are defined by a lack of direct connection to the external environment. Enclosure involves denying users direct access to sunlight, preventing air and heat exchange with the external environment, and denying users access to the landscapes of the outside world. It offers a global parameter for assessing the quality of the design solution (Cichocka & Musikhina Reference Cichocka and Musikhina2014; Cichocka, Browne, & Rodriguez Reference Cichocka, Browne and Rodriguez2017). A circulation room, on the other hand, does not have the function of a room in which users live and, in this case, is used as a passage or connection, which is configured as a room of locomotion (Bahrehmand, Evans & Blat Reference Bahrehmand, Evans and Blat2014).
3.3. Confined perimeter (PR)
The presence of these perimeters is routine in circulation rooms and sporadic in bathrooms and kitchens. Circulation rooms, which are usually enclosed, are evaluated separately, and a specific index is created for this function. Thus, the capture of the confinement associated with the house only covers the living rooms (Lobos & Donath Reference Lobos and Donath2010; Cichocka, Browne, & Rodriguez Reference Cichocka, Browne and Rodriguez2015; Nagy et al. Reference Nagy, Lau, Locke, Stoddart, Villaggi, Wang, Zhao and Benjamin2017; Yargin, Morosanu & Crilly 2018). In the LEQC meta-model, it is calculated by subtraction from the total internal perimeter. Its participation in this qualification calculation is determined by the confinement index (IR = PR/(2√AU)). The purpose of this guideline for analogy and performance evaluation is to encourage the architect to design the rooms of the house without confinement to minimize losses during the use of the house.
3.4. Circulation perimeter (PC)
A circulation room plays a key role in the use of the house, as it is characterized by enabling passage and connection between rooms, but its performance is limited to this activity. It offers a global parameter for assessing the quality of the design solution (Cichocka & Musikhina Reference Cichocka and Musikhina2014; Cichocka, Browne & Rodriguez Reference Cichocka, Browne and Rodriguez2017). Its functional dimensioning is mainly carried out to satisfy the requirements for the movement of people and the transport of equipment and furniture. In this condition, the minimization of geometric variables (area and perimeter) to meet this function does not interfere with the performance of the house. The purpose of minimizing these variables in the design of the FPL is that they are applied to living rooms. Similarly to the guidelines used for the confined perimeter, the circulation perimeter is not calculated as a contributor to the performance of the house. Its participation in this qualification calculation is determined by the circulation index (IC=PC/(2√AU)). This parameter is relevant in FPL geometric planning (Michalek, Choudhary & Papalambros Reference Michalek, Choudhary and Papalambros2002; Markus Reference Markus2003; Lobos & Donath Reference Lobos and Donath2010; Bahrehmand, Evans & Blat Reference Bahrehmand, Evans and Blat2014; Cichocka, Browne & Rodriguez Reference Cichocka, Browne and Rodriguez2015; Nagy et al. Reference Nagy, Lau, Locke, Stoddart, Villaggi, Wang, Zhao and Benjamin2017; Bahrehmand et al. Reference Bahrehmand, Batard, Marques, Evans and Blat2017).
3.5. External perimeter (PE)
The external perimeter has the function of establishing a shield for the house in terms of external protection, climatic safety and thermal and hygrometric comfort. It also offers a portal for access, exchange and communication with the external environment at the levels of the physical, lighting, thermal, atmospheric and visual aspects of the house, as well as providing aesthetic beauty to the house (Bribiesca Reference Bribiesca1997; Medjdoub & Yannou Reference Medjdoub and Yannou2000). In this way, it contributes to the performance of the house and subsequently transfers its share of this qualification to the FPL, calculated by the exteriorization index (IE = PE/(2√AU)). The exterior perimeter is added to the condominium and symmetry perimeters to give the contour perimeter of the house.
3.6. Condominium and symmetry perimeters
The condominium and symmetry perimeters define the portion of the house boundary that is inside the building. These perimeters are not the exclusive property of the house and do not perform the functions of the external perimeter (Zusne & Michels Reference Zusne and Michels1962; Park Reference Park2000; Hillier Reference Hillier and Hillier2007). The difference between them is that the condominium perimeter is shared with the collective area of the building, whereas the symmetry perimeter is shared with another house and establishes axes of symmetry between them. Hence, in the analogy model, they are conceptualized as not contributing to the FPL qualification. However, they contribute to the cost of converting the FPL into the house artifact and are calculated for this purpose based on the PX (condominium) and PY (symmetry) values. These geometric variables represent the totality of the variables used to assemble the geometric structure of the FPL. The qualifying geometric variables of the performance of the house are linked in the ARLE GPS model by the direct parameters involved in the evaluation of the geometric qualification of the FPL, i.e., the spaciousness (IA), configuration (IP), exteriorization (IE), confinement (IR) and circulation (IC), through the equation QQL = IA + IP + IE-(IC + IR). The qualification (QQL) is influenced by indirect parameters such as the formation (Nf, number of units per floor), as shown in Figure 6a, and the shape of the FPL polygon, which is defined by the compactness index through the form factor (FF), which in turn is related to the exteriorization parameter (IE) through the external perimeter. This variable causes significant variations in the monetary cost VGL for the conversion of the FPL into the house, since the external perimeter costs substantially more than the other perimeters. The external perimeter can be thought of as the villain behind rising costs (Figure 6b), although it represents the ‘good guy’ who fights against confinement (Figure 6c).
4. Structuring the ARLE GPS computational tool
The ARLE GPS computational tool was structured based on the LEQC metamodel and includes the systematic model proposed by Archer (Reference Archer1968), the conceptual model of remodeling the design solution space proposed by Gero (Reference Gero and Parmee1998), and the principles of GPS (General Problem Solver) proposed by Simon (Reference Simon1973, Reference Simon1996, pp. 122–123). It uses an architect-centered design approach that focuses on generating multiple alternative FPLs and providing design feedback to allow the architect to refine these alternatives (Son & Hyun Reference Son and Hyun2022), and a strategy for generating, analyzing and evaluating FPLs through a scientifically robust framework (Steadman Reference Steadman2008, p. 2; Dorst Reference Dorst2019; Aburamadan & Trillo Reference Aburamadan and Trillo2020). ARLE GPS addresses the issue of architectural design in a robust way by linking design decisions and managing the uncertainties associated with design decisions. It also has the interdisciplinarity necessary to meet the emerging challenges of a technology-based society (Papalambros Reference Papalambros2015; Sharma, Allen & Mistree Reference Sharma, Allen and Mistree2021): it acts directly as an information, action implementation and decision-making system, assisting the architect in repetitive and complicated tasks related to the generation and evaluation of solutions. It unifies the physical and biological approaches to FPL solutions into a methodological tool that can be shared, evaluated and discussed, and whose results can be easily reproduced and verified (Boujut in Papalambros Reference Papalambros2015). Its framework acts as a physical model of FPL geometric planning through the construction of a virtual geometric prototype, simulation and evaluation of the FPL geometric solution in a manner analogous to the case study in evolutionary biology (Langrish Reference Langrish2016). The use of a biological analogy in design development arises from the evolutionary process of biological development, which gives the architect the opportunity to change the structure and qualification of the design. This remodeling is processed based on the conceptual model of remodeling the design solution space (Gero Reference Gero and Parmee1998), as shown in Figure 7.
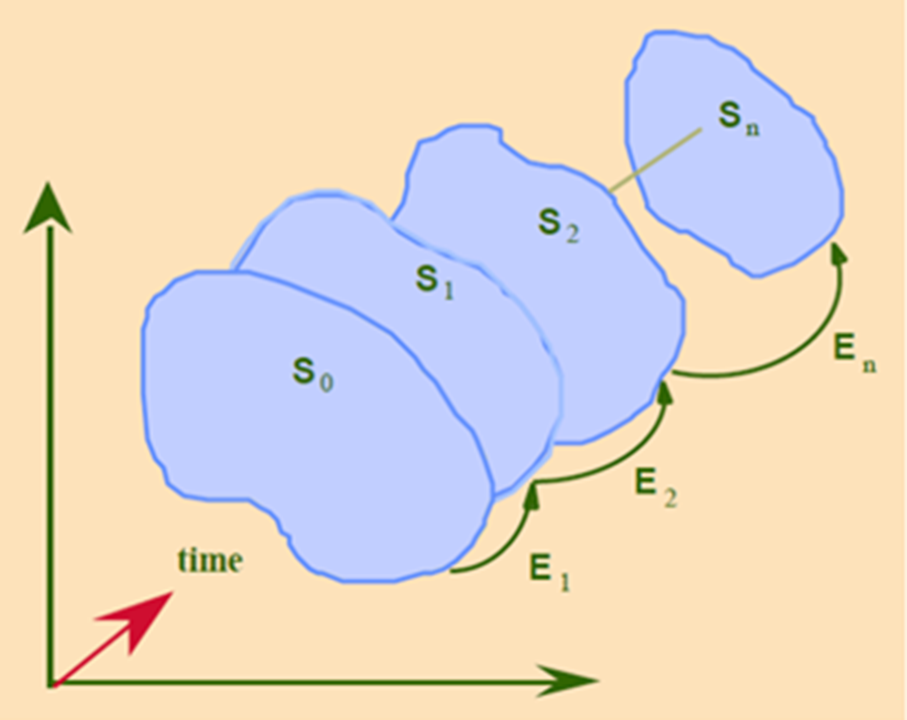
Figure 7. Conceptual model for remodeling the design solution space (Gero Reference Gero and Parmee1998).
The LEQC metamodel adopts this concept and allows the architect to use this biological strategy in the geometric design of the FPL. The architect takes advantage of this concept and generates a case by defining the FPL assembly components, establishing the geometric variables of the FPL solution, exploring the possible solutions for the proposed case, and accepting the solution that meets the goals of the project (Langrish Reference Langrish1993). The architect can propose as many cases as desired. In contrast, the ARLE GPS tool simulates the performance of the house and continuously evaluates the proposed cases to meet the architect’s objectives. The actuation stage also includes a biological model of the collection, storage and transcription of the FPL’s genetic information. This model provides the architect, through the Gtopology gene, with the order of assembly and connection between the rooms of the house. In this way, it provides an alternative for dealing with difficult and complex design problems (Gero Reference Gero and Parmee1998; Langrish Reference Langrish2016). Physical and biological approaches to design research differ in terms of the strategies used to tackle the problem: the physical approach explores the probability of generation and occurrence of an artifact from the artificial world through laws established by mathematical equations, whereas the biological approach explores the strategies used for the generation, adaptation and survival of artifacts in their habitat through the selection of the design solution, guided by the architect’s decision. According to Langrish, the main issue arising from the choice of one of these approaches for use in the design process is related to whether the architect achieves the intended goal (biological strategy) or accepts the allowed goal (physical strategy) (Langrish Reference Langrish1993). However, the ARLE GPS model, despite offering a physical approach for simulating, evaluating and optimizing the geometric solution of the FPL, is driven by the architect’s decision making, as well as the architect’s competence to define the intended goal and to establish the acceptability criteria for the FPL solution. The ARLE GPS model simulates the proposed geometric solutions and presents a diverse array of possible solutions to the architect, in a manner analogous to the case studies considered in evolutionary biology (Langrish Reference Langrish2016). Thus, a hybrid physical-biological approach is configured to simulate, evaluate and optimize the geometric solution of the FPL. The ARLE GPS tool acts as an assistant to the architect in the design of the FPL, in terms of decision making, implementing actions to structure and solve the problem, removing uncertainties from decision making, defining boundaries, and evaluating the performance of the house. It offers support in regard to the architect’s role as a safe arbitrator in the evaluation and selection of the optimal solution, once it has been converted from a subjective to an objective (mathematical) one. The FPL planning process also allows architects to apply their creativity and reflective practice to exploring the possibilities of FPL solutions and to run repetitive simulations until the desired solution is captured (Milovanovic Reference Milovanovic2019, p. 24; Reich Reference Reich2017; Raghunath et al. Reference Raghunath, Koronis, Karthikayen, Silva and Yogiaman2023). Using the models, principles and approaches listed above, ARLE GPS transforms the architectural design problem, conceptualized by Simon (Reference Simon1973) as ill-structured, into a well-structured problem that is verbalized and consistent with the available data (Schaathun Reference Schaathun2022). The principles proposed by Simon for solving this type of problem, which he calls GPS (General Problem Solver) (Simon Reference Simon1973; Simon Reference Simon1996, pp. 122–123), are defined by the following functional criteria to characterize the problem states (properties or qualities) as initial, intermediate, and final solutions:
-
• Use operators that promote the reduction or elimination of differences between states of the problem to induce changes of state until the solution state is reached;
-
• Apply tests to detect the difference between intermediate states;
-
• Attend to the solution state.
The solution to the problem is established with the help of GPS as follows:
-
• Set up an automatic solution generation process, with continuous simulation of the solutions, using the GPS functional criteria;
-
• Evaluate the solutions and select the optimal ones;
-
• Incorporate the optimized solutions into the design solution space, with the aim of continuously using these solutions to solve the current problem and future problems;
-
• Define the solution space that meets the requirements of the value space.
By analogy, the principle of GPS (General Problem Solver) can be compared to the GPS (Global Positioning System) navigation system, which solves the problem of finding a path to a given location. A combination of these two GPS principles, i.e., navigation and solving, with the LEQC metamodel defines the functionality of the ARLE GPS (Geometric Planning Solver) computational tool. An analogy between the two GPS systems can be drawn as follows: the FPL represents a competing vehicle in a race, piloted by the architect, in a competitive circuit defined by the value space of the design space. To win the race, the vehicle must reach the finish point, defined by the geometric qualification index (QQA) required by the FPL, which is set by the pilot. The pilot plans the vehicle’s trajectory and uploads the data on the locations to be covered, which are defined by the values of the FPL’s geometric variables, to ARLE GPS. The finish point is demarcated by the required quality (QQA). The GPS simulates the route and defines the end point of the planned route, defined by the geometric qualification index of the FPL (QQL). If the vehicle travels along the simulated route and reaches the end point, QQL ≥ QQA, it is a winner; if it does not reach this point, with QQL < QQA, it is a loser. In this case, the pilot compares the data from the locations covered along the route, using the FPL geometric qualification indices (IE, IP, IC, IR) provided by the GPS, with the data from the checkpoints defined by the FPL geometric qualification target values (IEa, IPa, ICa, IRa; a = target) set by the pilot. The checkpoints define the strategic points through which the vehicle must pass on its trajectory until it reaches the end point. In this way, the pilot evaluates the trajectory traveled and the extent of the deviation from the trajectory in relation to the checkpoints and defines new trajectory data through new values of the geometric variables of the FPL, thus proposing a new trajectory. These data are uploaded to the GPS, which then runs a new trajectory simulation until the pilot establishes a value of geometric variables that enables the vehicle to reach the arrival point, defined by QQL ≥ QQA.
5. Archer’s systematic model
Bruce Archer (1922–2005) was one of the leading figures of the design methods movement (DMM) and was instrumental in the development of the discipline of design research in the 1960s. The DMM arose as a result of post-war optimism and a desire to make design into a scientific process, using physics as a model. This movement, as well as its disappearance, is of more than historical interest, as the scientific approach to design that was sought at the time has not yet been reached. However, according to Langrish, the adoption of a physical model of design research was one of the determining factors in the rejection of the design methods developed in the 1960s, which are considered to be ‘first generation’ methods (Bayazit Reference Bayazit2004; Langrish Reference Langrish2016).
In short, this was due to the following issues:
-
• The perversity of real-world problems;
-
• The inability of physics to deal with the complexity of design;
-
• A need for a biological approach to the process of designing artifacts for the artificial world.
-
• A lack of information about inheritance and genetic transmission of existing artifacts, which was needed for the creation of new artifacts.
Archer developed the systematic method in the 1960s and described it in a compilation of 12 articles published in Design magazine in 1963–1964 under the title Systematic Design Methods. He presented and defended his systematic model in 1968 (Archer Reference Archer1968). In this model, the design process was divided into key steps. However, due to the problems outlined above, the use of the method did not become widespread, and it was not commonly adopted outside the Department of Design Research (DDR) in the UK (Design Council 2007). However, the method, with its mathematical underpinnings, proved suitable for data processing and contributed to the development of existing computer-aided design (CAD) software.
To better understand Archer’s systematic vision, it is important to point out his prescience in terms of recognizing the relationship between two types of research: one related to the conception and production of things (artifacts of the artificial world) and the other related to the understanding not only of things themselves but also of the environment in which they are conceived, produced and used. According to Margolin (Reference Margolin, Durling, Chen, Poldma, Roworth-Stokes and Stolterman2010), reviving the vision of design research developed by Archer would allow for a breakthrough in the field of design. The recovery and extension of this vision, and its operationalization as a tool to assist architects, formed a motivational pillar for the development of the ARLE GPS computational tool. The decision to adopt Archer’s thesis as the main pillar for the construction of the ARLE GPS tool was made following participation in a doctoral program in the period 1995–1999 and work on a research topic through a thesis entitled Evaluation of the Quality of Houses Through their Design (FPL) (Martins Reference Martins1999).
The extensive literature search carried out at that time, at a global level, indicated a deficiency of bibliographical information and the absence of a model for the evaluation of design quality. Among this researched material, two publications stood out: a book entitled Metodologia Del Diseño Arquitetónico, which represented a compilation of texts by several authors, including the text La estructura del processo del diseño by Archer (Reference Archer and Broadbent1971), and a book entitled Quality Control for Managers and Engineers by Kirkpatrick (Reference Kirkpatrick1970). Archer’s text presents a logical model of the design process and provides a systematic model within which, according to Archer, designers can operate and on which they can base their research and analysis. The second publication looks at quality in a broad sense, and one of its sub-themes is the “cost of design quality.” Kirkpatrick states that the assessment of design quality involves a complex set of problems and that establishing a model to accurately assess quality is particularly difficult and an extraordinarily complex task. However, on page 8, the author presents a graph of the “cost versus design quality” relationship, shown here in Figure 1, which involves a curve/law that establishes a pattern of cost behavior in relation to quality and which caught our attention as a conceptual proposal for a law of the cost of design quality. Archer, on the other hand, provides a roadmap and a logical framework for defining a law (mathematical model) that establishes a relationship between the goal (design quality) and the action directed by the geometric variables to promote that goal. Once the conceptual model of a law of “design quality cost” and the systematic model to establish this law were established, two questions had to be answered:
-
1. How should Archer’s systematic model be structured and the variables that define the cost of design quality, through the geometric variables of the floor plan (FPL) of apartments, be established?
-
2. Is Kirkpatrick’s conceptual model valid in terms of architectural design?
Regarding the first question, the defining variables of quality were established based on a model of analogy of the qualification of the geometric variables of the FPL with the functional physical performance of the apartment, and it only remained to define the cost variable. Of the various hypotheses evaluated, the area variable (AU) proved to be the most feasible. This question was decided through a functional-physical analysis of the rooms of the 177 apartments in the design space. In particular, we focused on the functional rooms, i.e., bathrooms. Bathroom 1, with a smaller surface area of approximately 1.0 m2, provides only a toilet, with the functionality of satisfying the physiological needs of human beings. Bathroom 2, with the largest surface area of approximately 10.0 m2, contains a collective whirlpool bath and two individual bathrooms, each of which is equipped with a toilet, hygienic shower, washbasin with worktop, and glazed shower installation. These bathrooms, therefore offer very different functional performances. To improve the functional performance of the bathrooms, with the aim of raising their qualification, a physical-functional simulation of each was carried out by increasing the surface area (Au) by 1.0 m2. In this scenario, Bathroom 1 now has a surface area of 2.0 m2, making it possible to double its functionality with the installation of a column washbasin, which makes it possible to meet the personal hygiene functionality. This new usability condition of Bathroom 1 is perceived by the users as an increase in its functional performance, thus increasing its qualification. The same 1.0 m2 increase in the surface area of Bathroom 2 does not provide a significant increase in its functional performance and does not have the same impact, benefit and qualification as achieved for Bathroom 1; to reach the same level of qualification perceived for Bathroom 1, it is necessary to increase the surface area by much more than 1.0 m2. This simulation exercise not only allowed us to establish the surface area (Au) as a representative variable of the cost of quality but also to confirm the validity of Kirkpatrick’s conceptual model for architectural design. A combination of these two proposals allowed for the structuring of an analogy law that relates cost to the geometric qualification of the FPL and relates this qualification to the functional physical performance of the apartment, as shown in Figure 2. Refinement of this analogy model and the incorporation of the monetary cost model and the biological model made it possible to structure the ARLE GPS computational tool in its current format. Its successful application during this period, particularly in architectural design education, meant that its scope and capability could be validated and certified (Martins Reference Martins2022b).
6. ARLE GPS physical model
The ARLE GPS physical model is structured using the information and instructions proposed and conveyed by Archer’s (Reference Archer1968) thesis, in which he states that the logic of any design problem can be better understood in the context of an elementary structure of knowledge. Thus, he makes no distinction between the fields of architecture, engineering and industrial design; furthermore, he does not define what good design is, nor does he suggest a formula for conducting the design process. The aim is simply to provide a systematic model to assist the decision-maker in the design process. In this way, Archer defines a relationship between an objective or goal to be achieved in a design, which he calls a property, and the action directed towards achieving that goal (Section 2.1). When this thesis was published in book form in 1971, the term ‘property’ was changed to ‘quality’ (Archer Reference Archer and Broadbent1971). The information and instructions presented in the thesis define the assembly of the LEQC metamodel structure, with the identification and location of the assembly instructions proposed by Archer (section of the thesis), and the result of its use represented with an example of the application of this process to the solution of the geometric planning of the FPL and apartment design, shown in item 13, through:
-
1. Expressing the QQL value as the geometric qualification value of the FPL, and setting the target value of the required qualification QQA as a criterion or threshold for the acceptability of the FPL solution (Archer – Sections 2.5, 2.6, 2.15, 2.24) (Example shown in item 13, QQL = 17.93; QQA = 16.94);
-
2. Defining the input/output (I/O) mechanism of the LEQC meta-model by means of a suitable metric to capture, quantify, and qualify the geometric variables of area and perimeter, which are promoters of the QQL qualification action of the FPL (Archer – Sections 2.18, 3.2, 3.11).
The LEQC meta-model is structured based on the following input data, which are controlled by the architect:
geometric: AA, Au (useful area of the rooms), Pu, Pc, Pr (perimeters of the rooms), PE, PX, PY, LV, Pp, Ad, Aw, Pd, Pw;
cost: Vad, Vaw, Vpd, Vpw, VPE;
required quality: QQA.
The meta-model computes this input data and converts it into the following output data:
geometric qualification: QQL;
geometric qualification indices: IA, IE, IP, IC, IR, FF;
geometric cost: AU, AN;
monetary cost: VGL, VAN;
geometric cost of geometric qualification: VAQ;
monetary cost of geometric qualification: VQL;
genetic coding: Gform; Gfunction; Gtopology, Gspace;
-
3. Building a mathematical regression model in the form of a curve representing the law of relationship between the objective of QQL qualification and the action directed by the geometric variables to promote this qualification (Archer – Sections 2.9, 2.19) (ARLE GPS, represented in Figure 3);
-
4. Establishing the simulation of FPL solutions as an analogy of the LEQC meta-model for the performance of the house artifact (Archer – Sections 4.6, 11.7) (ARLE GPS, represented in Figure 3);
-
5. Solving the problem of assessing a solution of the FPL by establishing mathematical criteria defined by QQL, VAQ and VQL, since when performed subjectively, the judgment may change or may diverge with a change of referee (Archer – Sections 2.16, 3.30, 8.10, 8.11);
-
6. Maximizing the added value of the house artifact and electing the geometric cost of geometric qualification VAQ and monetary cost of geometric qualification VQL as the arbiters of the evaluation, ranking and selection of optimized FPL solutions (Archer – Sections 2.15, 2.16, 7.16);
-
7. Collecting, tabulating, classifying, and storing FPL data using the ARLE GPS computational tool (Archer – Section 9.10) (ARLE GPS – shown in Table 1);
-
8. Developing the ARLE GPS tool as an effective model for establishing analogies and simulations that is capable of referencing a logical structure of the FPL geometric planning problem and that is competent to generate solutions to solve the problem (Archer – Section 4.1);
-
9. Valuing the creative role of the architect as the pilot of the idea conception process and establishing the principles of the geometric solution of the FPL (Archer – Section 10.12);
-
10. Describing the nature of the design process, considering that the quality of the geometric solution of the FPL varies under the influence of the architect’s decisions (Archer – Section 3.19) and that the act of designing consists of:
-
a. Meeting the goals of geometric qualification and solution optimization (ARLE GPS – QQL, VAQ and VQL);
-
b. Identifying the geometrical qualifications present in the solution (ARLE GPS – IE, IP, IA, IC, IR, FF);
-
c. Determining the relationships between the geometric qualification goal QQL, and the geometric variables participating in the goal fulfilment action (ARLE GPS – LEQC meta-model, presented in Figure 6);
-
d. Establishing the space of values and the limits and ideal states for the geometric qualification of the FPL (ARLE GPS – IEa, IPa, ICa, IRa, FFa – a = target), (ARLE GPS – presented in Tables 7 and 8);
-
e. Identifying the variables decision geometric available to the architect and their correlations (ARLE GPS – LEQC meta-model shown in Figure 4);
-
f. Formulating a systematic decision model that meets the objectives of geometric qualification;
-
g. Ensuring that the interdependence of the geometric qualification of the FPL takes the form of families of designs, arranged in an executable and acceptable design space (ARLE GPS – shown in Figure 3);
-
h. Proposing the establishment of one or more families of the geometric qualification in this space (ARLE GPS – shown in Figure 3);
-
i. Selecting an optimized proposal that is arbitrated by the qualification indices of geometric qualification QQL, geometric qualification cost VAQ, and monetary cost of geometric qualification VQL;
-
An advanced version of the proposal is also created by extending the physical view of the model through:
11. Generating the indexing, encoding and digital signature of the FPL (ARLE GPS – presented in Table 6);
12. Establishing a methodology for constructing design spaces, defining their value space, and outlining a mechanism for recovering best cases;
13. Determining the monetary cost of converting the geometric solution of the FPL in the house artifact (TVL), simultaneously with the evaluation of the geometric qualification (QQL). This variable defines the relationship between monetary cost/geometric quality (VQL) and establishes a strategy for controlling the cost of design decisions;
14. Defining a model for calculating the geometric and monetary losses (or gains) AN of the FPL in relation to the requirements established by the target value QQA through an analogy with the performance of the house during its useful life;
15. Building a computational simulation of the geometric solution of the FPL (shown in Tables 1, 11, and 12).
Just as it is considered and solved what Davis and Gristwood (Reference Davis and Gristwood2018) point out in relation to the existence of a persistent tension between the theory and practice of design, due to the existence of disturbances in the model proposed by Archer, motivated by:
-
• Complexity arising from the interrelationships of design variables;
-
• The possibility of design program review;
-
• Guarantees of good data/information.
The complexity resulting from the interrelationships of design variables requires the architect to manage uncertainties and make numerous decisions that affect the design itself, meaning that it is imperative for the architect to eliminate uncertainties and make robust decisions. Finding a suitable spatial planning of the house through the robust design model provided by ARLE GPS offers a solution to this problem. It allows the architect to eliminate uncertainties and take robust decisions on the controllable parameters to solve the problem, using the geometric variables of the FPL that satisfy a set of performance parameters established by the ARLE GPS analogy model. This establishes a relationship between the geometric variables of the FPL assembly and the response defined by the target (required) performance of the house, as defined in the construction of the solution. The performance is quantified using a mathematical metric (QQL) established by the geometric qualification of the FPL. However, the design decisions simulated and evaluated by the tool do not consider noise factors (parameters beyond the architect’s control) (Sharma, Allen, & Mistree Reference Sharma, Allen and Mistree2021). For example, deployment of four apartments per floor in an isolated building with centralized vertical circulation, where all apartments are optimally positioned in terms of solar orientation or view/landscape, each of the four apartments will be assessed by the tool with the same level of performance. Thus, the problems mentioned by Davis and Gristwood are solved with competence and robustness by the ARLE GPS tool, as demonstrated by the solution of the geometric planning and design of the FPL, presented in item 13, and the geometric evaluation of the FPLs, presented in item 14.
7. Biological model of ARLE GPS
As mentioned above, a functional evolution of the ARLE GPS tool is proposed, based on the introduction of a biological vision into the architectural design process and the construction of a biological model structured by encoding the digital signature of the FPL (Langenhan & Petzold Reference Langenhan and Petzold2010). The digital signature genetically characterizes the “FPL individual,” referred to here as the “i-design.” The motivation for using the term “i-design” is to distinguish the treatment of the design as an individual from the artificial world, represented by a digital code, analogous to the genetic coding of an individual from the biological world. For a better understanding of the process, an analogy with the taxonomy of living things in biology is used (Shi & Gero Reference Shi and Gero2000). A biological model aims to know, locate, compare and transcribe the genetic information of an individual in order to introduce genetic improvements to the creation of new individuals, as well as to establish an ordering and classification system, with the aim of constructing and exploring design spaces (Markus Reference Markus1993, p. 19; Jo & Gero Reference Jo and Gero1998). To this end, a proposal based on spatial semantics is presented, in which architectural spaces can be described qualitatively and quantitatively through computable and codifiable features (Yap & Muslimin Reference Yap, Ha and Muslimin2019). In genetics, information about the structure of an individual is stored in a sequence of genes that define its genetic code. Genetics identifies genes, their clusters and their sequence structure in species genomes, which is the genetic material used to represent the organism at its reproductive level (Gero & Kazakov Reference Gero and Kazakov1997; Langton Reference Langton2000). In the artificial world, genes describe the components of the determinant vector of the i-design genome, represented as a sequential linear coding of characters in a particular alphabet (Saxena Reference Saxena2012, p. 90), which, in the case of ARLE GPS coding, is a symbolic alphanumeric alphabet. Thus, an artifact of the artificial world is coded by the presence or absence of a certain feature, such as size, shape, quantity, or position (Steadman Reference Steadman2008, p. 268). The coding system for artifacts is chosen to be very low level, using very simple basic genes, incorporating minimal knowledge of the possible features to be described and transcribed into the coding, and ensuring that no important part of the search space is excluded (Schnier & Gero Reference Schnier, Gero, Gero and Sudweeks1996). To continue the genetic analogy we note that genes are the building blocks of an organism in natural evolution, and perform a similar function in i-design. Genes store the information needed to assemble a component of the i-design structure (Gero Reference Gero and Lee2018). The assembly of structures from their components requires guidelines and instructions that define the reproducible formation of a structure from numerous possibilities. This assembly information must specify the dimensions, location and connectivity of the building blocks within the assembled structure, as well as the order and the way in which they are incorporated into the structure. Two conceptual strategies are used to assemble structures: top-down and bottom-up. Structure assembly using the top-down strategy involves defining the structure without initial detailing. From this proposal, each component of the structure is defined, detailed and modelled. An example of the use of the top-down strategy is offered by the ancient Egyptians, who were expert i-design programmers; they used the technique of building artifacts of the artificial world based on the genetic theory of simple building blocks and applied it to the construction of complex structures such as monuments, pyramids and temples, as shown in Figure 8, using building blocks to assemble these complex structures via assemblers. The bottom-up approach works in a similar way to a jigsaw puzzle, where the assembly of the structure is carried out using simple building blocks through selective interactions that define the position of each building block in the final assembly (Cademartiri & Bishop Reference Cademartiri and Bishop2015).

Figure 8. Pharaonic constructions (images by Daniel das Neves Martins).
The information sequenced by the ARLE GPS tool can be converted into a two-dimensional barcode, in this case a QR code. This can store up to 7089 numeric characters or 4296 alphanumeric characters and can be easily scanned with a mobile phone equipped with a camera. Its potential use lies in the retrieval and transport of information by establishing a link between offline communication, represented by the QR code, and online communication, represented by a mobile phone network (Wikipedia 2020). It also makes it possible to capture and transmit a virtual URL (Uniform Resource Locator) in addition to the information in the QR code, as shown in Figure 9.

Figure 9. QR code for FPL 164.
The structure of the LEQC model makes it possible to reproduce Archer’s precise vision and approach to establishing a physical model for mathematical evaluation, numerical simulation and optimization of the FPL. The physical model makes it possible to establish a biological model, which is incorporated into the ARLE GPS tool and complements the process of geometric design of the FPL, thus paving the way for the structuring of a solution methodology for the design of the house. It establishes an elaborate and prescriptive methodology that specifies a comprehensive approach that defines the activities the architect must follow to solve the problem, how they are sequenced, the results generated by the different activities, and how to evaluate the data from the house design solution (Gericke, Eckert & Stacey Reference Gericke, Eckert and Stacey2022).
8. Coding of the FPL
The genetic code of i-design contains information about the form, functionality, zoning, order of assembly of the rooms in the house, and connections between rooms, and it quantifies the geometric variables used in the assembly of the house design. It uses the genes Gform (form), Gfunction (function), Gtopology (topology) and Gspace (dimension). The first number in the genetic code of the FPL has five digits and defines the geometric cost of its geometric qualification in units of square centimeters. It is determined by the ratio of useful area to geometric qualification (AU/QQL). The direction of its minimization defines the direction of optimization of the geometric solution. However, the mathematical model defines that this cost potentially increases with the calculated geometric qualification in relation to the required performance of the house. The Gform gene provides the parameters of the formation of the house structure: the first digit defines the number of repetitions of the structure on the floor (Nf); the second digit defines the number of connections with the external environment (Ne); the third and fourth digits define the number of functional rooms of the house; the following three digits define the shape of the house, based on a form factor multiplied by 100 (FF x 100) (sequence defined by integer); and the last two digits indicate the number of vertices (LV) of the polygon modelling the house. The Gfunction gene defines the design program and indicates the function of the rooms in the house and the functional zoning of the rooms (social, intimate and kitchen/service). The Gtopology gene defines the order of the rooms and their connections. The topological coding mechanism of the FPL, its assembly and its information retrieval system are structured according to the following model:
{[E1 → U → (LDOHT)] ϵ [C → (FB1W1B2(→W2)B(→PW))] ϵ [K → (MG → (SB4W4E2))]}
Assembly parts – E1ULDOHTCFB1W1B2W2BPWKMGSB4W4E2.
[E1 → U(→LDOHT)] – living rooms block.
[C → (FB1W1B2(→W2)B(→(PW))] – intimate rooms block
[K → (MG(→SB4W4E2))] – kitchen/service rooms block
{− start assembling the artifact
} – end assembling the artifact;
[− start assembling an artifact block;
] – end assembling an artifact block;
→ – process the connection;
(− process the multiple connections;
) – finish multiple connections;
ϵ – connect the next part with the “U” part of the artifact assembly.
The Gspace gene quantifies the geometric variables that define the structure of the FPL: AU – useful area, AT – total area, PU – internal perimeter, PE – external perimeter, PX – condominium perimeter, PY – symmetry perimeter, PC – circulation perimeter and PR – confined perimeter (dimensions in centimeters). The information transmitted by the Gspace gene makes it possible to determine or retrieve the FPL geometric qualification indices (QQL) and the house performance value, defined by the ratio AU/QQL, which determines the geometric cost of house performance (VAQ). Once the ARLE GPS tool has been structured, the next step is to operationalize its use as a means of assisting the architect in the design process. The results of the Optimization in Architectural Practice survey indicate that architects highlight the importance of geometry in optimizing the geometric solution of the FPL and consider access to computational optimization methods that can assist them in the design process to be essential (Cichocka & Musikhina Reference Cichocka and Musikhina2014; Cichocka, Browne, & Rodriguez Reference Cichocka, Browne and Rodriguez2017).
9. ARLE GPS computational support
Computer-aided design responds to the prevailing demand from architects for computers as valuable tools that can assist them in planning, exploring, and manually or automatically generating designs (Woodbury & Burrow Reference Woodbury and Burrow2004). Advances in computing power in the 2000s, with exponential increases in memory and data processing capacity, and the creation of the World Wide Web enabled faster and more powerful computing and contributed greatly to research into computer-aided architectural design (Rhee, Veloso & Krishnamurti Reference Rhee, Veloso and Krishnamurti2023). They also contributed enormously to resolving the issues that caused rejection of the first generation of physical design research models developed in the 1960s. However, computers are hardware and need to be loaded with specific software to meet the demands and design needs of architects in order to be configured as a computational support tool. The main difficulty in meeting this demand today is a lack of this type of software. The ARLE GPS computational tool was developed with the aim of helping to alleviate this problem.
The tool contributes to overcoming some of the challenges of the design process and can assist the architect through:
-
• Universal access to the tool, which can be shared, evaluated, and discussed, and the results easily reproduced and verified;
-
• User-friendly computer support, which is integrated into the designer’s behavior and is focused and centered on the user rather than on the design;
-
• Dialogue with the computer;
-
• Addressing the issue of architectural design in a scientific and interdisciplinary manner;
-
• Acting on the design solution using a physical-biological and cost approach;
-
• Removing uncertainties from decision making;
-
• Defining the boundaries of the action-decision field of design variables, and the limits of possibility for the design solution;
-
• Acting in the role of a self-assessing arbiter;
-
• Offering conceptual strategies for design assembly;
-
• Simulating and evaluating the geometric solution of the FPL;
-
• Changing the structure and qualification of the design;
-
• Incorporating the practice of make-believe games;
-
• Exploring the state of the geometric solution of the FPL in real time;
-
• Refining the result of exploring the solution space in a progressive manner;
-
• Determining the monetary cost of the house based on the geometric variables of the FPL;
-
• Revealing the cost of design decisions;
-
• Calculating the losses in the use of the house as a function of the magnitude of the qualifier’s variables of the FPL;
-
• Evaluating the performance of the house and selecting the most suitable or optimized proposal;
-
• Collecting, storing, transcribing, and retrieving genetic information from the FPL;
-
• Building and exploring design spaces and establishing value spaces;
-
• Navigating the design solution space through the FPL’s genetic code;
-
• Guaranteeing good data/information.
(Langrish Reference Langrish1993; Gero Reference Gero and Parmee1998; Papalambros & Wild Reference Papalambros and Wild2000; Simpson et al. Reference Simpson, Poplinski, Koch and Allen2001; Eckert, Stacey & Reference Eckert, Stacey, Heisig, Clarkson and Vajna2010; Bao et al. Reference Bao, Yan, Mitra and Wonka2013; Bernal Reference Bernal2015; Wortmann, Costa & Nannicini Reference Wortmann, Costa and Nannicini2015; Papalambros Reference Papalambros2015; Bahrehmand et al. Reference Bahrehmand, Batard, Marques, Evans and Blat2017; Yargin, Morosanu & Crilly Reference Yargın, Moroşanu and Crilly2018; Poznic et al. Reference Poznic, Stacey, Hillerbrand and Eckert2020; Purup & Petersen Reference Purup and Petersen2020).
ARLE GPS is a powerful tool because it isolates an aspect of reality and allows an architect to represent, interpret, manipulate or control problem states (properties or qualities). It has predictive power because it carries out virtual simulations of what will happen in the problem states if the offered suggestions are met and the suggested changes are made. It was developed to fill a gap in the housing design process, contribute to the related field of design quality research, and improve the quality of design solutions (Zboinska Reference Zboinska2015; Zhang, Lui & Wang Reference Zhang, Liu and Wang2020). The current lack of computational tools to support architects can be extended in terms of providing a platform for the automated generation of FPLs. Several software programs have been developed for this purpose over the last decades, but despite these efforts, no software has reached architectural offices as an effective tool for the automated generation of the FPL (Rodrigues et al. Reference Rodrigues, Gaspar and Gomes2013). The tools that have been presented, mainly by academics, have been aimed at exploratory support for the generation of the FPL and have not found much appreciation in practice. In this context, according to Zboinska, a viable proposal for solving this problem is the construction of hybrid platforms (CAD/E, computer-assisted design and engineering) that bring together several existing tools in a robust set and are capable of supporting several types of activities inherent in the design generation process from its initial phase, such as exploration of the design space, rapid generation, simulation, evaluation, classification and selection of optimized solutions. However, the current state of the art does not include such a platform (Zboinska Reference Zboinska2015; Zboinska Reference Zboinska2019). In view of this situation, the essence of the structural proposal of the ARLE GPS computational tool is that, in addition to providing computational support to the architect in the planning of the FPL and the design of the house, it can also contribute to the process of automating the generation of FPLs by providing another tool for the assembly of this platform.
10. Use of the ARLE GPS computational support tool
Traditionally, the design of a house begins by fulfilling the requirements of the design program, as well as its specifications and restrictions. Architects begin the design process by drawing sketches that represent the principles of spatial planning established based on topologically feasible solutions, without the exact geometric dimensions (Medjdoub & Yannou Reference Medjdoub and Yannou2000; Langenhan et al. Reference Langenhan, Weber, Liwicki, Petzold and Dengel2013; Roith, Langenhan & Petzold Reference Roith, Langenhan and Petzold2017). In this sketching phase, preliminary drawings are usually done by hand, and possible topological solutions are defined (Rodrigues, Gaspar & Gomes Reference Rodrigues, Gaspar and Gomes2013). Once this phase is complete, the next step involves the definition of the geometry of the sketches, which depends on the fulfilment of the geometric specifications of the FPL, such as functional dimensioning and good proportions of the dimensions of the rooms (Lobos & Donath Reference Lobos and Donath2010). The final solution is achieved with the topological and geometric resolution of the FPL that meets the requirements and design objectives. Its evaluation is subjective, since an objective evaluation of the solution is only possible at the geometric level (Medjdoub & Yannou Reference Medjdoub and Yannou2000; Medjdoub & Yannou Reference Medjdoub and Yannou2001; Lawson Reference Lawson2005, p. 69). There is no example of the evaluation and selection of an FPL solution based on topological adjacencies (Shekhawat Reference Shekhawat2015). An objective evaluation, on the other hand, requires an assessment and comparison of benefits and sacrifices (Thomson et al. Reference Thomson, Austin, Devine-Wright and Mills2003). The evaluation offered by ARLE GPS is carried out based on the geometric cost, defined by the consumption of useful area, or the monetary cost, represented by the disbursement of monetary values, and the quality, calculated using a graphic model in the 2D plane, which defines the geometric qualification of the FPL and configures the functional physical performance of the house. In this way, the design process of the house is prototyped using models based on sketches, drawings and plans. These prototypes are used as a descriptive form of the design, even though they are an abstraction of the real artifact (Smithers Reference Smithers1992; Papalambros & Wild Reference Papalambros and Wild2000, p. 4; Mahdavi Reference Mahdavi and Augenbroe2003). This is the configuration used to systematize the assembly or modelling of the structure of the FPL (Roberts, Archer & Baynes Reference Roberts, Archer and Baynes1992; Croos Reference Cross2001; Frankel & Racine Reference Frankel and Racine2010). However, in the process of computational design and computer-aided design, the models aim at the construction and geometric representation of the design. Condition that translates into a primary question of how to enter the information and data of the problem and how they are transformed into the generation and representation of the geometric configuration of an FPL. The construction of this configuration has a major influence on the results that can be generated (Aasholm Reference Aasholm2015, pp. 30, 40, 105), as well as on the performance of the house and the monetary cost of FPL conversion in the house. In computer-aided design with ARLE GPS, the ARLE GPS software (spreadsheet) is loaded by the architect with a set of geometric data (Au, Pu, PE, PX, PY), the monetary cost of variables (Vad,VAw, VPE, VPd, VPw) and the value of the geometric qualification required by the problem (QQA), with the aim of defining and solving this as a well-structured problem. The software processes this set of data and provides, as output, the dimensioning of the structuring parts of the FPL (rooms), as well as topological information on the order of assembly of these parts in the structure and the connections between them. In this way, it produces an immediate visualization of the virtual geometric prototype, which is evaluated in relation to the parameters required by the problem. The architect can configure this prototype in an agile way by changing the value of the geometric variables, meaning that ARLE GPS constitutes a low-cost simulator (Camburn et al. Reference Camburn, Viswanathan, Linsey, Anderson, Jensen, Crawford, Otto and Wood2017). ARLE GPS evaluates the prototype in terms of whether it satisfies the requirements for useful area (AA) and required quality (QQA) and provides a geometric qualification of the internal region of the FPL based on the indices of spaciousness IA, configuration IP, circulation IC, confinement IR. It also provides the Gtopology genetic code as output data, which specifies the order of assembly and connections of the rooms. This set of data allows the architect to model a geometric-topological graphic prototype that is representative of the FPL solution and thus, through this prototype, to collect the rest of the geometric data for the FPL structure: the external perimeter PE, the external qualification IE, condominium perimeter PX, symmetry perimeter PY, and the number of vertices LV of the FPL polygon. Complementing the geometric modeling data of the prototype, which establishes the data required by ARLE GPS for the evaluation of its geometric qualification, which is representative of the performance of the house and the cost of converting the FPL into a house. This is converted into a graphical prototype, which is modeled and refined by the architect until an FPL is generated that meets the requirements of both the problem and the client’s, as shown in the example in item 13. This process is carried out by the architect using computational thinking to make decisions and implement actions to structure and solve the problem (Kelly & Gero Reference Kelly and Gero2021), as the problem is well-structured. The assembly of graphical geometric prototypes is carried out using two approaches, based on bottom-up and top-down assembly (Hendricx et al. Reference Hendricx, Geebelen, Geeraerts, Neuckermans and Timmermans1998).
11. Assembly of the geometric prototype
11.1. Top-down approach
Assembly of the house design is achieved using a top-down approach by solving for a geometric plan that meets the requirements for the design program, the functional dimensioning of the rooms, the target floor area (AA) and the performance of the house (QQA). This pre-planning of the room dimensions represents the creation of a geometric prototype of the house design, which is adapted, rearranged and topologically modelled by the architect until it captures the design solution. This prototype allows the architect to start the process of modelling the topological solution using the representative parts of the rooms, which have already been dimensioned, evaluated and optimized in relation to the required performance, and knowing the order of assembly and connections between the rooms. In this way, assistance is provided by the tool to the architect at the very beginning of the design process. The ARLE GPS software facilitates the simulation and continuous evaluation of the geometric assembly of the FPL and continuously provides optimized values of this assembly for the modelling of the topological solution of the design until a solution is obtained that meets the requirements for solving the problem, as illustrated in item 13. The architect is supported in this design solution approach by the process of exploration and co-evolution (Figure 10) (Maher et al. Reference Maher, Poon, Boulanger, Gero and Sudweeks1996; Yu et al. Reference Yu, Gu, Ostwald and Gero2015; Gero, Kannengiesser & Crilly Reference Gero, Kannengiesser and Crilly2022). When the modelling process is complete, ARLE GPS provides the genetic code of the FPL.

Figure 10. ARLE: a systematic model of exploration and co-evolution based on a top-down approach.
11.2. Bottom-up approach
Assembly of the FPL using a bottom-up approach is performed at the initial planning stage of the FPL, using the same preliminary approach as in the top-down assembly. The difference between these two approaches is that in bottom-up assembly, once a geometric prototype has been defined that meets the requirements, specifications and design constraints, this geometric prototype is then used directly in the topological assembly of the structure of the FPL, in the same way as a jigsaw puzzle. This approach enables the assembly of different FPLs using the same parts (rooms), since they can be assigned to different positions. The assembly process requires the architect to locate the rooms in the topological structure of the FPL. In this type of process, the rooms of the house are usually rectangular in shape, and the assembly of the FPL is done similarly to a jigsaw puzzle. This means that logistical reasoning skills are required of the architect to solve the problem, like the assembly activities performed by the player to win the game (Smithers Reference Smithers1992; Chang Reference Chang, Van Leeuwen and Timmermans2004; Cheng & Chang Reference Cheng and Chang2007; Lo, Fu & Li Reference Lo, Fu and Li2009; Nico, Lai & Chang Reference Nico Lo, Lai and Chang2014). Spatial systems based on puzzles and their geometric regularities provide a unique model for the design of individual units or housing developments (Palócz & Katona Reference Palócz and Katona2019).
11.3. Genetic strategy for the case study
11.3.1. Case study
A case is a memory model that is used to explore the information and experiences conveyed by design solutions. Case studies illustrate the diversity of ways in which designs can exist and be conceived (Langrish Reference Langrish2016). Successful use of this approach in the process of retrieving and adapting cases, as represented by the case-based reasoning (CBR), case-based design (CBD) and similarity-based design (SBE) models, depends on retrieving the most relevant experience, represented by the best similar case (Mantaras et al. Reference Mantaras, McSherry, Bridge, Leak, Smyth, Craw, Faltings, Maher, Cox, Forbus, Keane, Aamodt and Watson2006). The efficiency and robustness of best-case search and retrieval using ARLE coding are directly related to the effectiveness of the coding and indexing (Rosenman, Gero & Oxman Reference Rosenman, Gero, Oxman and Schmitt1991; Mubarak Reference Mubarak2004, p. 5). The implementation of a design space created with ARLE GPS through i-design enables the storage and retrieval of design solutions through the genetic record of designs. This facilitates the knowledge, comparison, transmission and transcription of the genetic information of designs. Its use represents a miner in the exploration of design experience, and it can assist architects in the design process (Hugues & Fenves Reference Hugues and Fenves2000; Woodbury & Burrow Reference Woodbury and Burrow2006b), as it allows them to explore existing solutions in order to interpret and understand the intentions and choices that were made. It can also enhance their ability and creativity in terms of generating new designs and encourage them to broaden their understanding of the design process through going beyond the expected solution, represented by the ‘best solution–best design’. It offers a way to encourage their curiosity and creativity and stimulates them to excel in solving the problem (Maher & Grace Reference Maher, Grace, Aha and Lieber2017).
11.3.2. FPL assembly in the case study
In the case study strategy, the assembly of the FPL is processed in a design space using the same approach as top-down assembly. The fundamental difference between the two approaches arises at the step in which the geometric prototype is established and the genetic code of the FPL is generated. In the case study strategy, the genetic code of this i-design is used directly to search for the best similar case in the design space. This is retrieved through the Gfunction gene, which determines the functionality of the house and is linked to the useful area variable AU, which represents its dimensions, and the location of the minimum value of the geometric cost of qualification (VAQ), which defines the best case. Once the best similar case has been found, the i-design folder is opened in the design space database, where the geometric planning/ARLE GPS spreadsheet and the CAD drawing are stored. This plan is then used to model the topological solution of the design, and the recovered CAD drawing is reworked. With the ability to query and retrieve other similar i-designs to retrieve different assumptions used in the design solutions. To achieve this, a process of continuous simulation between the geometric design (FPL) and the topological assembly of the design is used to capture a solution that meets the design requirements, as shown in Figure 11.
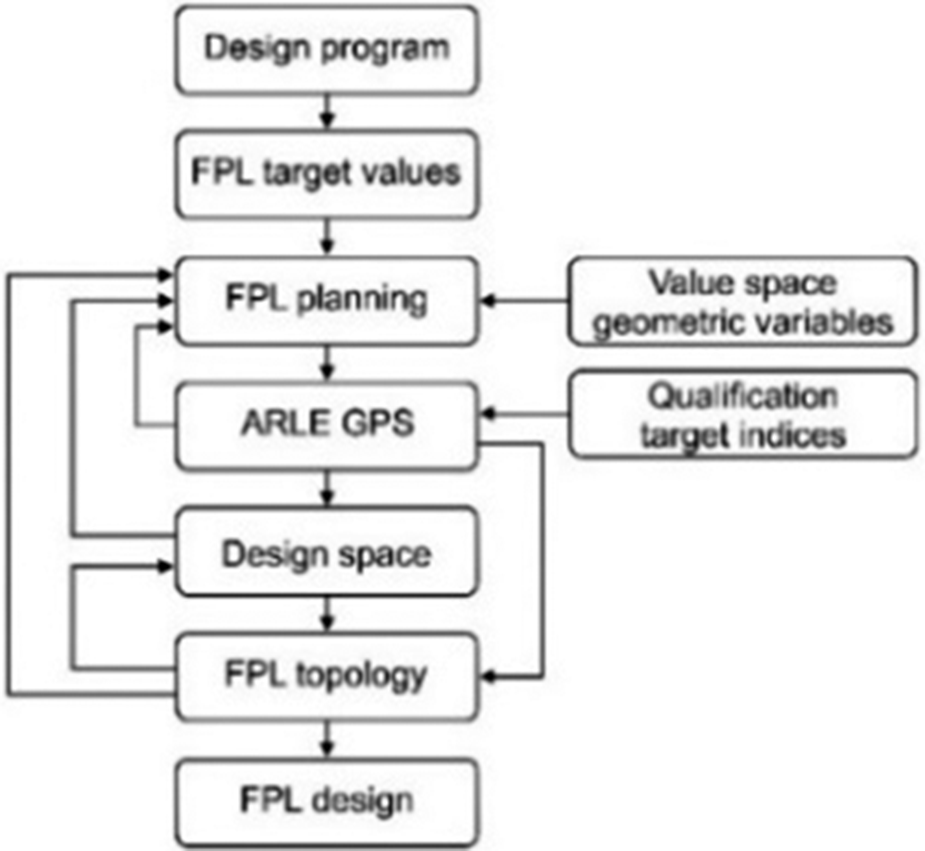
Figure 11. ARLE systematic model of exploration and co-evolution: case study approach.
12. Design space and design value space for the house
A design space can be defined as a cluster of designs with certain affinities, which are defined by ARLE GPS in terms of proximity characteristics such as constitution and functionality. Constitution is related to a group of i-designs that share a similar descendant and is represented by ARLE GPS through the Gform gene, whereas functionality is associated with families of i-designs defined by their functional affinity and is represented by the Gfunction gene. The design space is intended to be used in the process of exploring design solutions. Construction of the design space in ARLE GPS is carried out based on the digital signature of the FPL, which names the i-design storage file directly in a folder of the operating software used by the architect (Windows, Mac, Linux). In terms of the design space created, they store the design (CAD) and the ARLE GPS spreadsheet (Martins, Jungles & Oliveira Reference Martins, Jungles and Oliveira2023). The success of the design space exploration process with ARLE GPS is related to the effectiveness of the coding and indexing of the designs and the functionality of the search mechanism and is also correlated with the degree of affinity of the members of the cluster. For example, segmentation of the current design space into two spaces, containing designs of two- and four-unit apartments per floor, to define an affinity of their cluster constitution, has the potential to facilitate the exploration of design solutions due to the establishment of a greater affinity between the members of the design space. Exploration of the design space in ARLE GPS is guided by an efficient algorithm (i-design) for navigating through a space of possibilities. This is performed using the physical-biological and cost model of the ARLE GPS tool: the physical model is structured based on a sophisticated mathematical model that provides a set of metrics for analyzing and evaluating the FPLs of the design space which allows for the evaluation of candidate solutions. The design solution is explored by the biological model through its geometric planning data, in a similar way to the required performance of the house. The analogous biological model is structured based on the genetic code of the FPL, which is defined by its digital signature (i-design). The genetic code defines a digital information tape for the FPL, which allows the researcher to determine the settings used for the design solution directly from the code. Navigation through the genetic code (i-design) does not require a graphical representation to explore the design space, and is done directly in the genetically encoded database. Exploration of the design space in its digital format reveals partial information about the form, function and space (2D dimension) of the FPL and, by analogy, the performance of the house. However, by retrieving the information stored in the folders, it is possible to obtain relevant information on the planning of the FPL and the process of the design solution, as these folders may contain any type of design information. The signature operates as a search engine that retrieves the stored information and directs the architect to navigate through the action-decision field of the design variables. This exploration process allows the researcher to make a distinction between the problem space and the solution space, as well as making it possible to explore problems related to existing solutions in the design space in order to avoid them in the planning of the FPL. In this way, the exploration process can help architects navigate the space of design solutions and retrieve information that can help them recreate the assumptions used to solve for optimized FPLs and use these to create new designs (Burrow & Woodbury Reference Burrow and Woodbury1999; Moya, López & Moya Reference Moya, López and Moya1999; Woodbury & Burrow Reference Woodbury and Burrow2004; Akin Reference Akin2006; Goldschmidt Reference Goldschmidt2006; Krishnamurti Reference Krishnamurti2006; Woodbury & Burrow Reference Woodbury and Burrow2006a; Woodbury & Burrow Reference Woodbury and Burrow2006b; Kannengiesser & Gero Reference Kannengiesser, Gero and Gero2017; Davis & Gristwood Reference Davis and Gristwood2018; Wortmann Reference Wortmann2018). The computational support provided by the ARLE GPS tool goes beyond its performance as a physical model of virtual prototype assembly, simulation, and FPL evaluation. This software represents a leap forward, as it introduces a biological vision into the architectural design process through the construction of a biological model of the collection, storage, retrieval, and transcription of genetic information from FPLs for the generation of genetically enhanced FPLs. This is illustrated by the coding of the FPLs that make up Family 7 of the explored design space, as shown in Table 6.
Table 6. FPL genetic coding for Family 7.
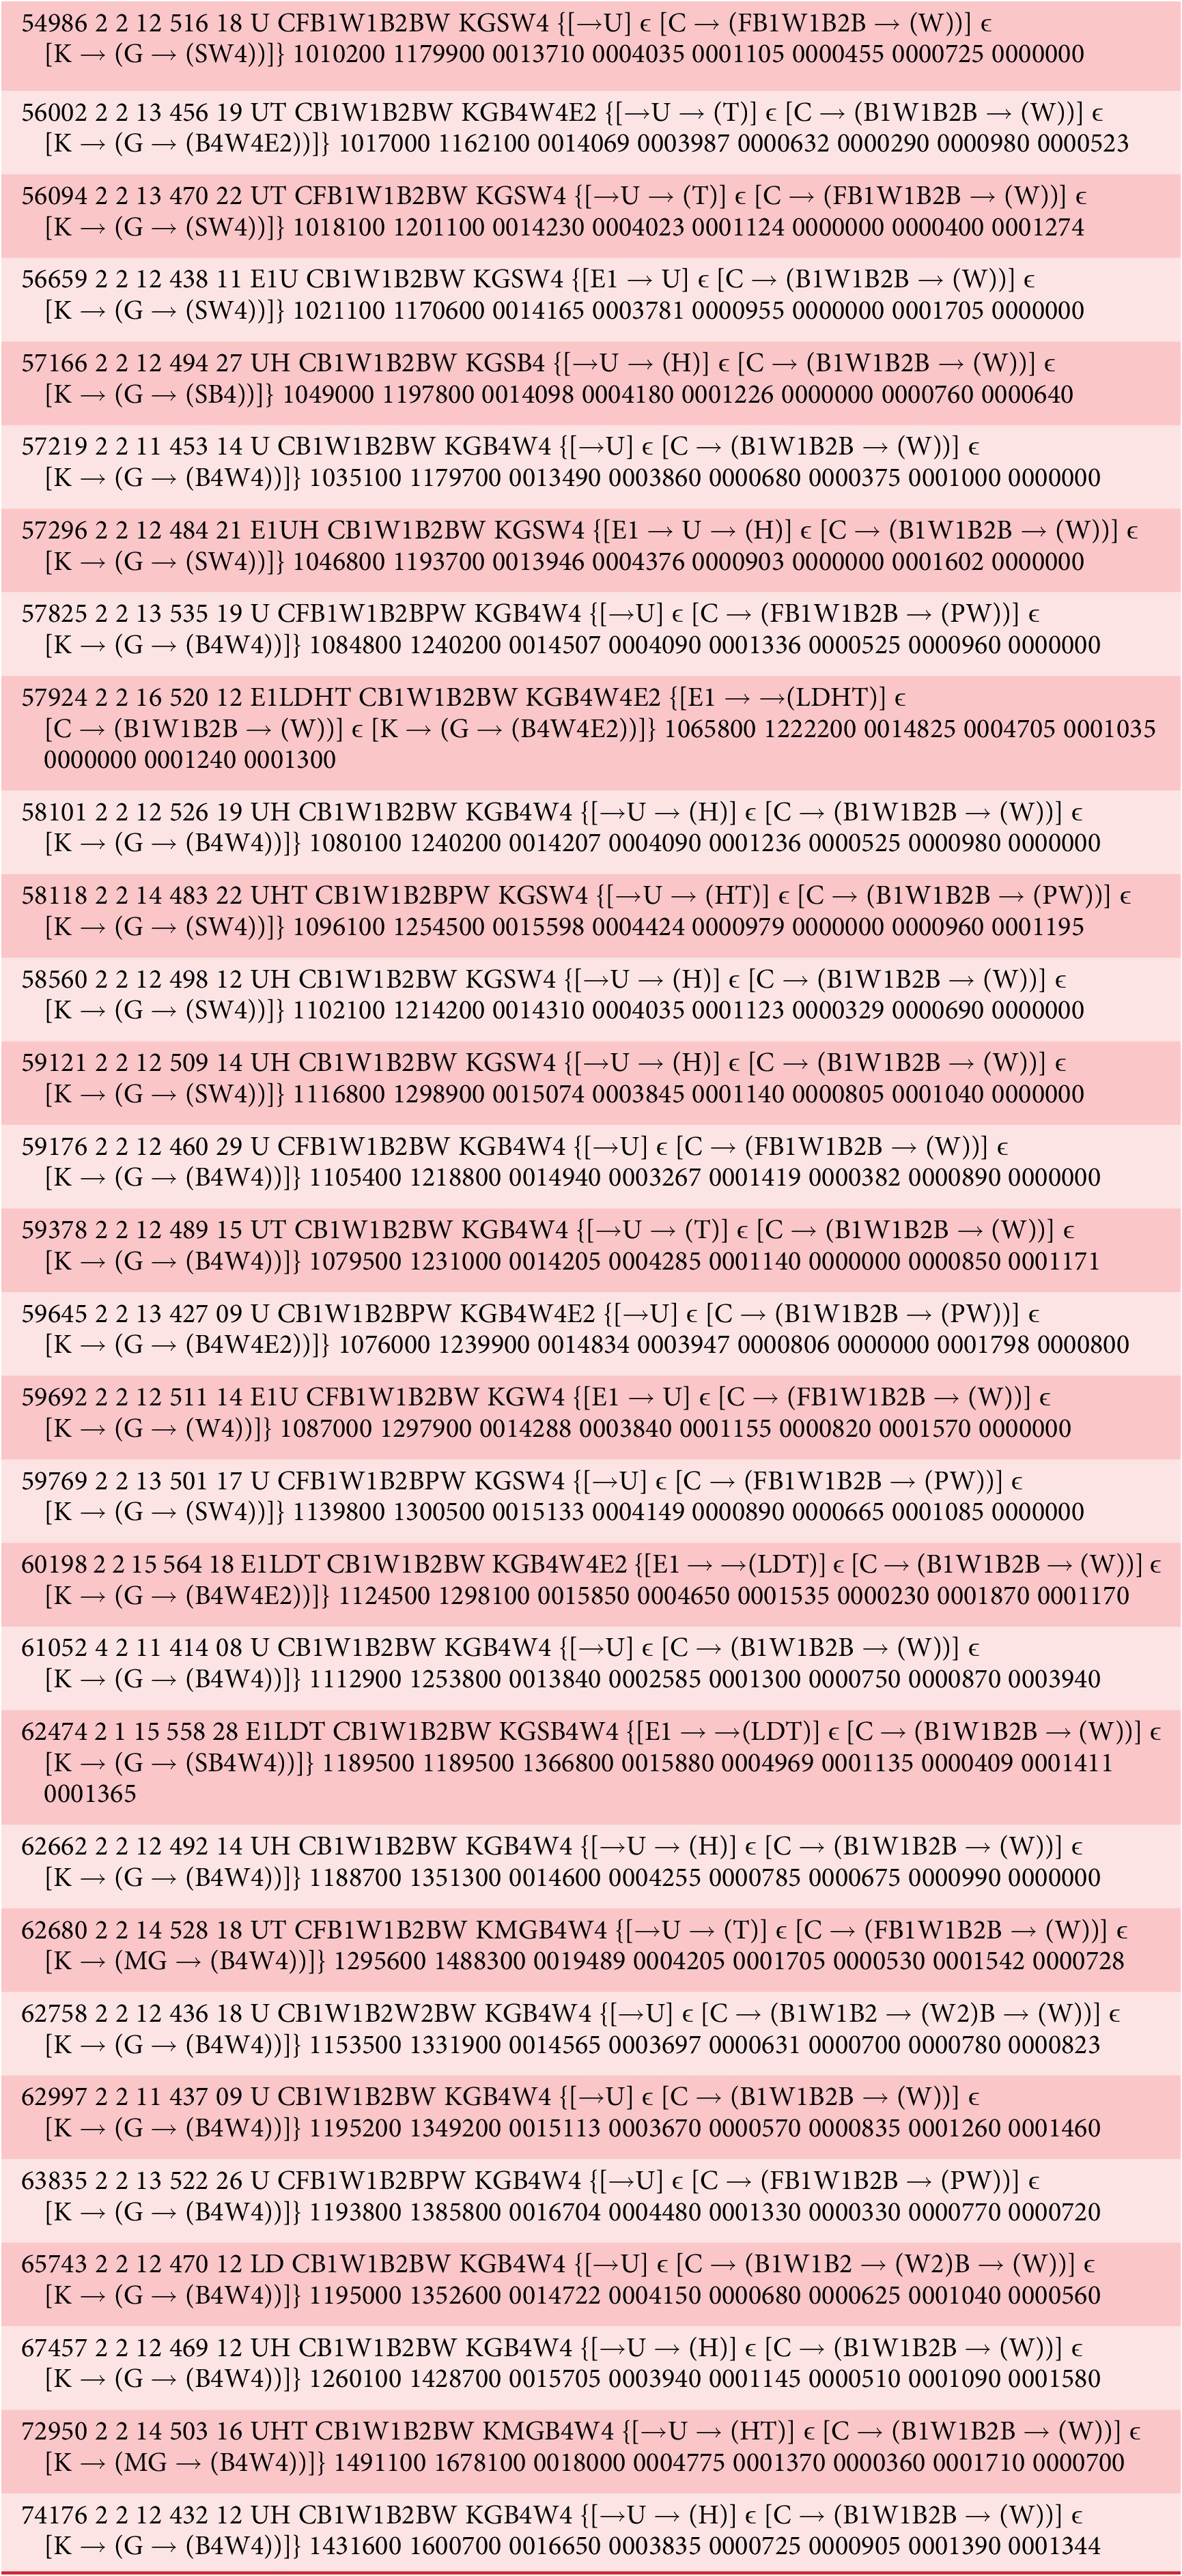
Another important objective for the construction of a design space is to establish the value space of the design solutions of the design space. The value space is established by statistically processing the assembly and geometric qualification variables of the FPL in the design space. It represents the performance of the FPL in the design space, and defines the limits of this performance. Its function is to help the architect to navigate through and explore the action-decision field of the design process, and to use the indices and data of the value space to optimize the candidate solution for the geometric planning of the FPL. The statistical processing values for the geometric planning of the FPLs from the design space are presented in Tables 7 and 8.
Table 7. FPLs qualification value space – design space.
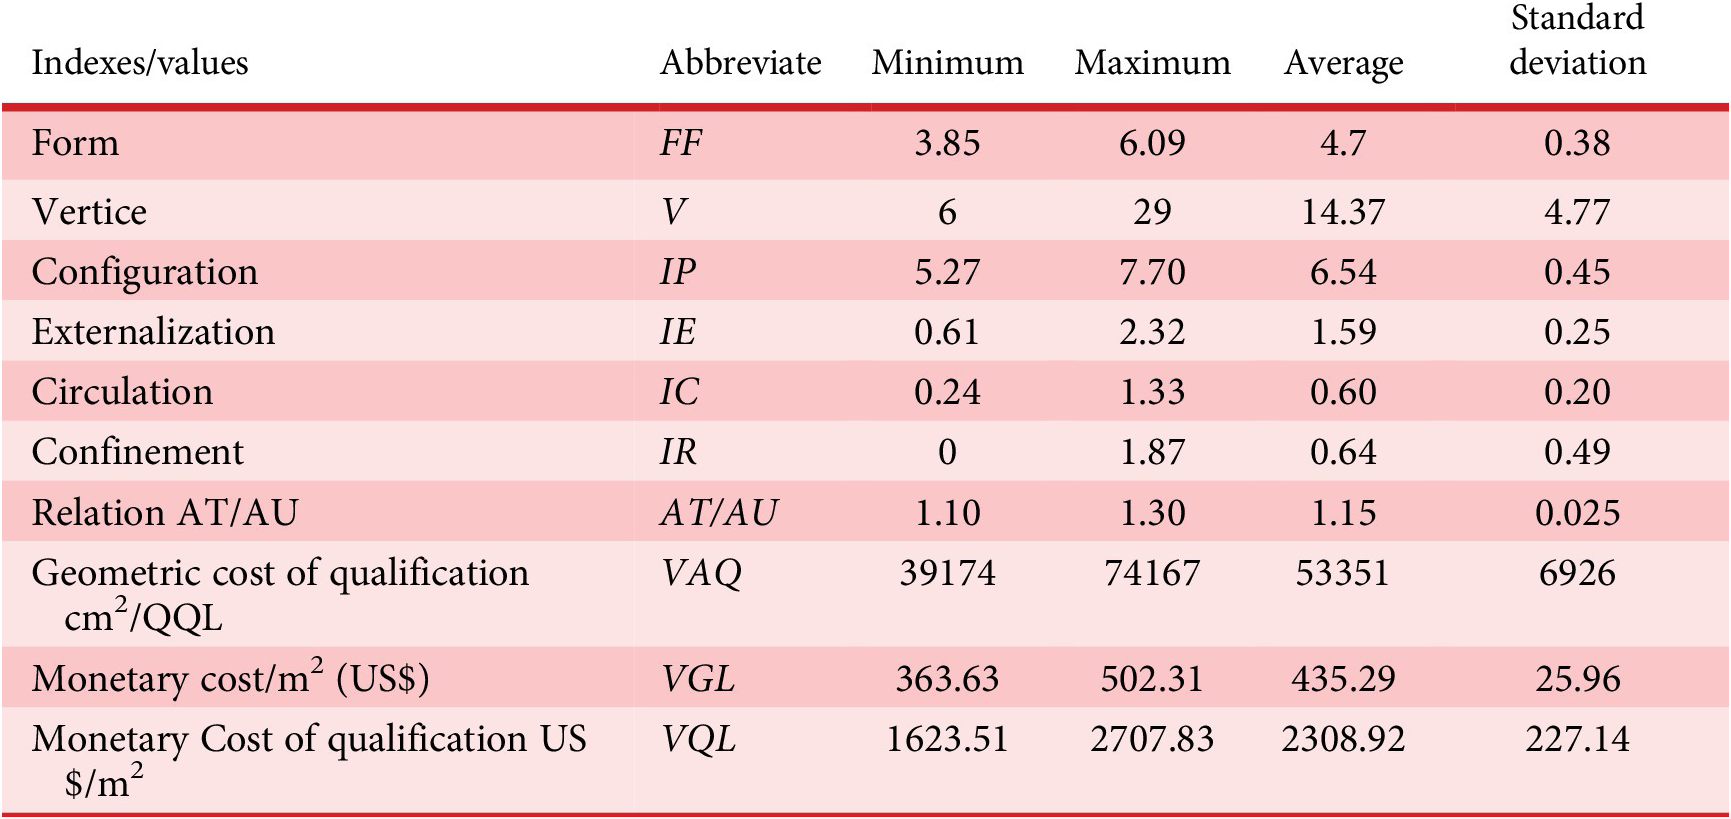
Table 8. Limit values for the FPL – design space.
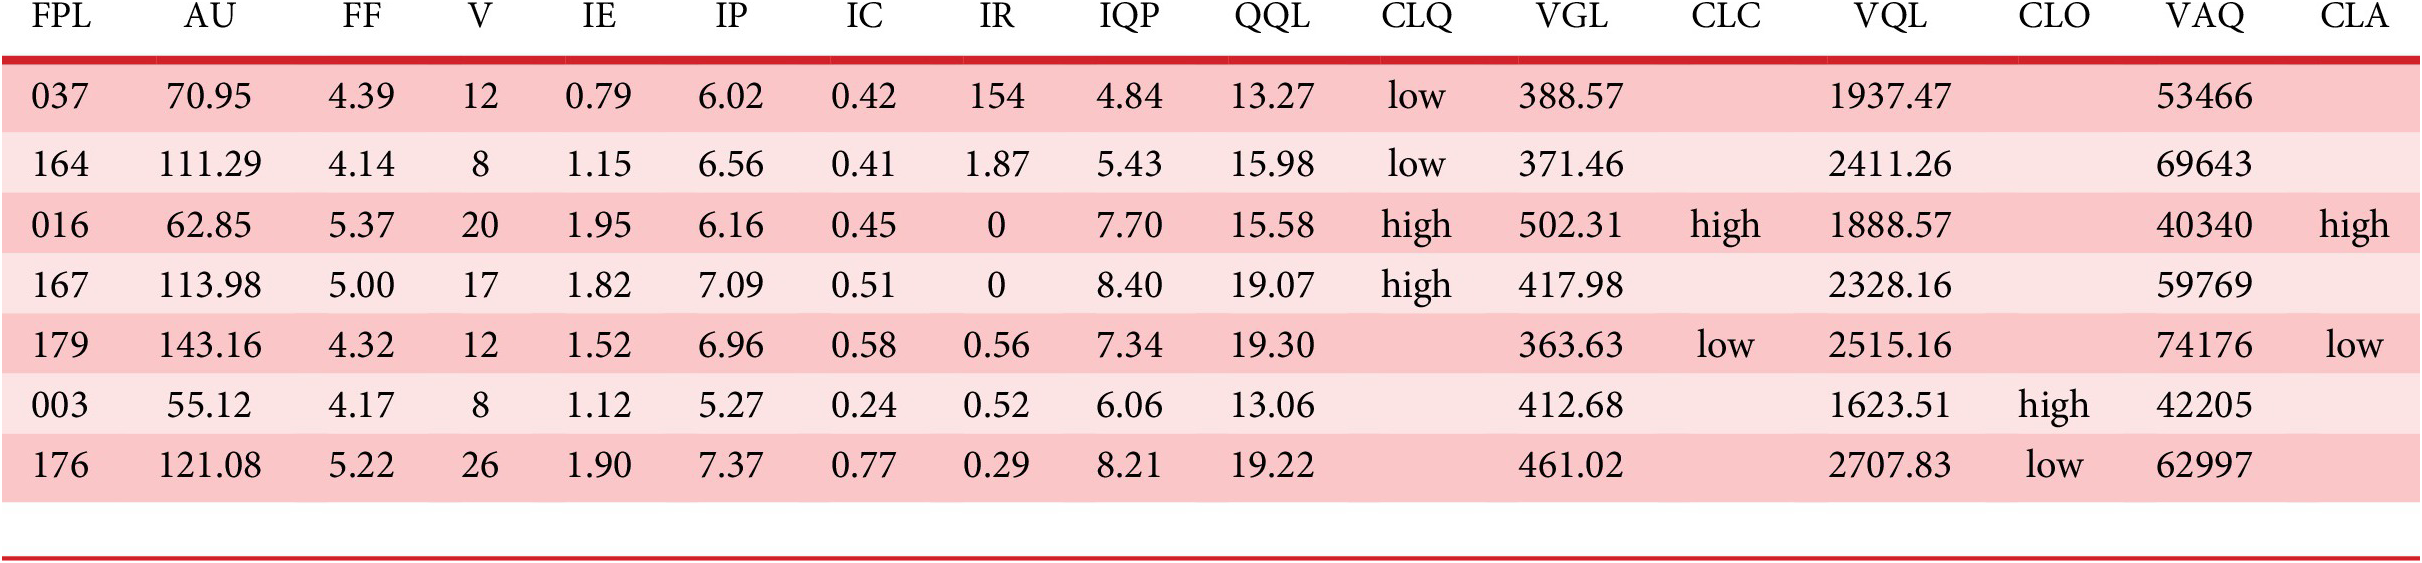
Note: CLQ = QQL rating, CLC = VGL rating, CLO = VQL rating, CLA = VAQ rating.
The value space of the design space is delineated by minimum, maximum, mean and standard deviation values (Bayazit Reference Bayazit2004; Doulgerakis Reference Doulgerakis2007, p. 35; Bradner, Iorio & Davis Reference Bradner, Iorio and Davis2014; Cichocka & Musikhina Reference Cichocka and Musikhina2014; Nagy et al. Reference Nagy, Lau, Locke, Stoddart, Villaggi, Wang, Zhao and Benjamin2017). However, the referential value space of the house performance can also be defined by an FPL that meets the performance requirements demanded by the architect. The value space that is explored includes a variable that defines the monetary cost of converting the geometric variables into a house, and a variable that defines the monetary cost of the house performance. Statistical processing of the geometric data of the FPLs obtained from the design space also makes it possible to establish the value spaces for a series of variables of the FPL, such as the geometric dimensioning of the rooms of the house, as shown in Table 9. The value space for the geometric dimensioning of the rooms is calculated by statistical processing of the values of the areas and perimeters of the rooms in relation to the demarcation of their boundaries, i.e., the minimum and maximum values, the average values, and the form factors of the polygons representing the rooms. The form factor makes it possible to establish a relationship between the width (W) and length (L) of the room. Once the room dimensions are defined and the width/length ratio is known, the equation W = √(AU/L) defines the width and length of the room. This space of geometric values for the rooms can help architects, and students in particular, to establish an initial geometric dimensioning for the FPL. Figure 12 shows an example of the use of the ARLE GPS tool (Martins Reference Martins2022b) to assist students in the process of designing an apartment (FPL), and demonstrates the potential of this tool to help students to generate designs with equal or better performance than the family of designs in the high-performance region of the explored design space (Figure 3).
Table 9. Value space for the room dimensions in the FPL – design space.
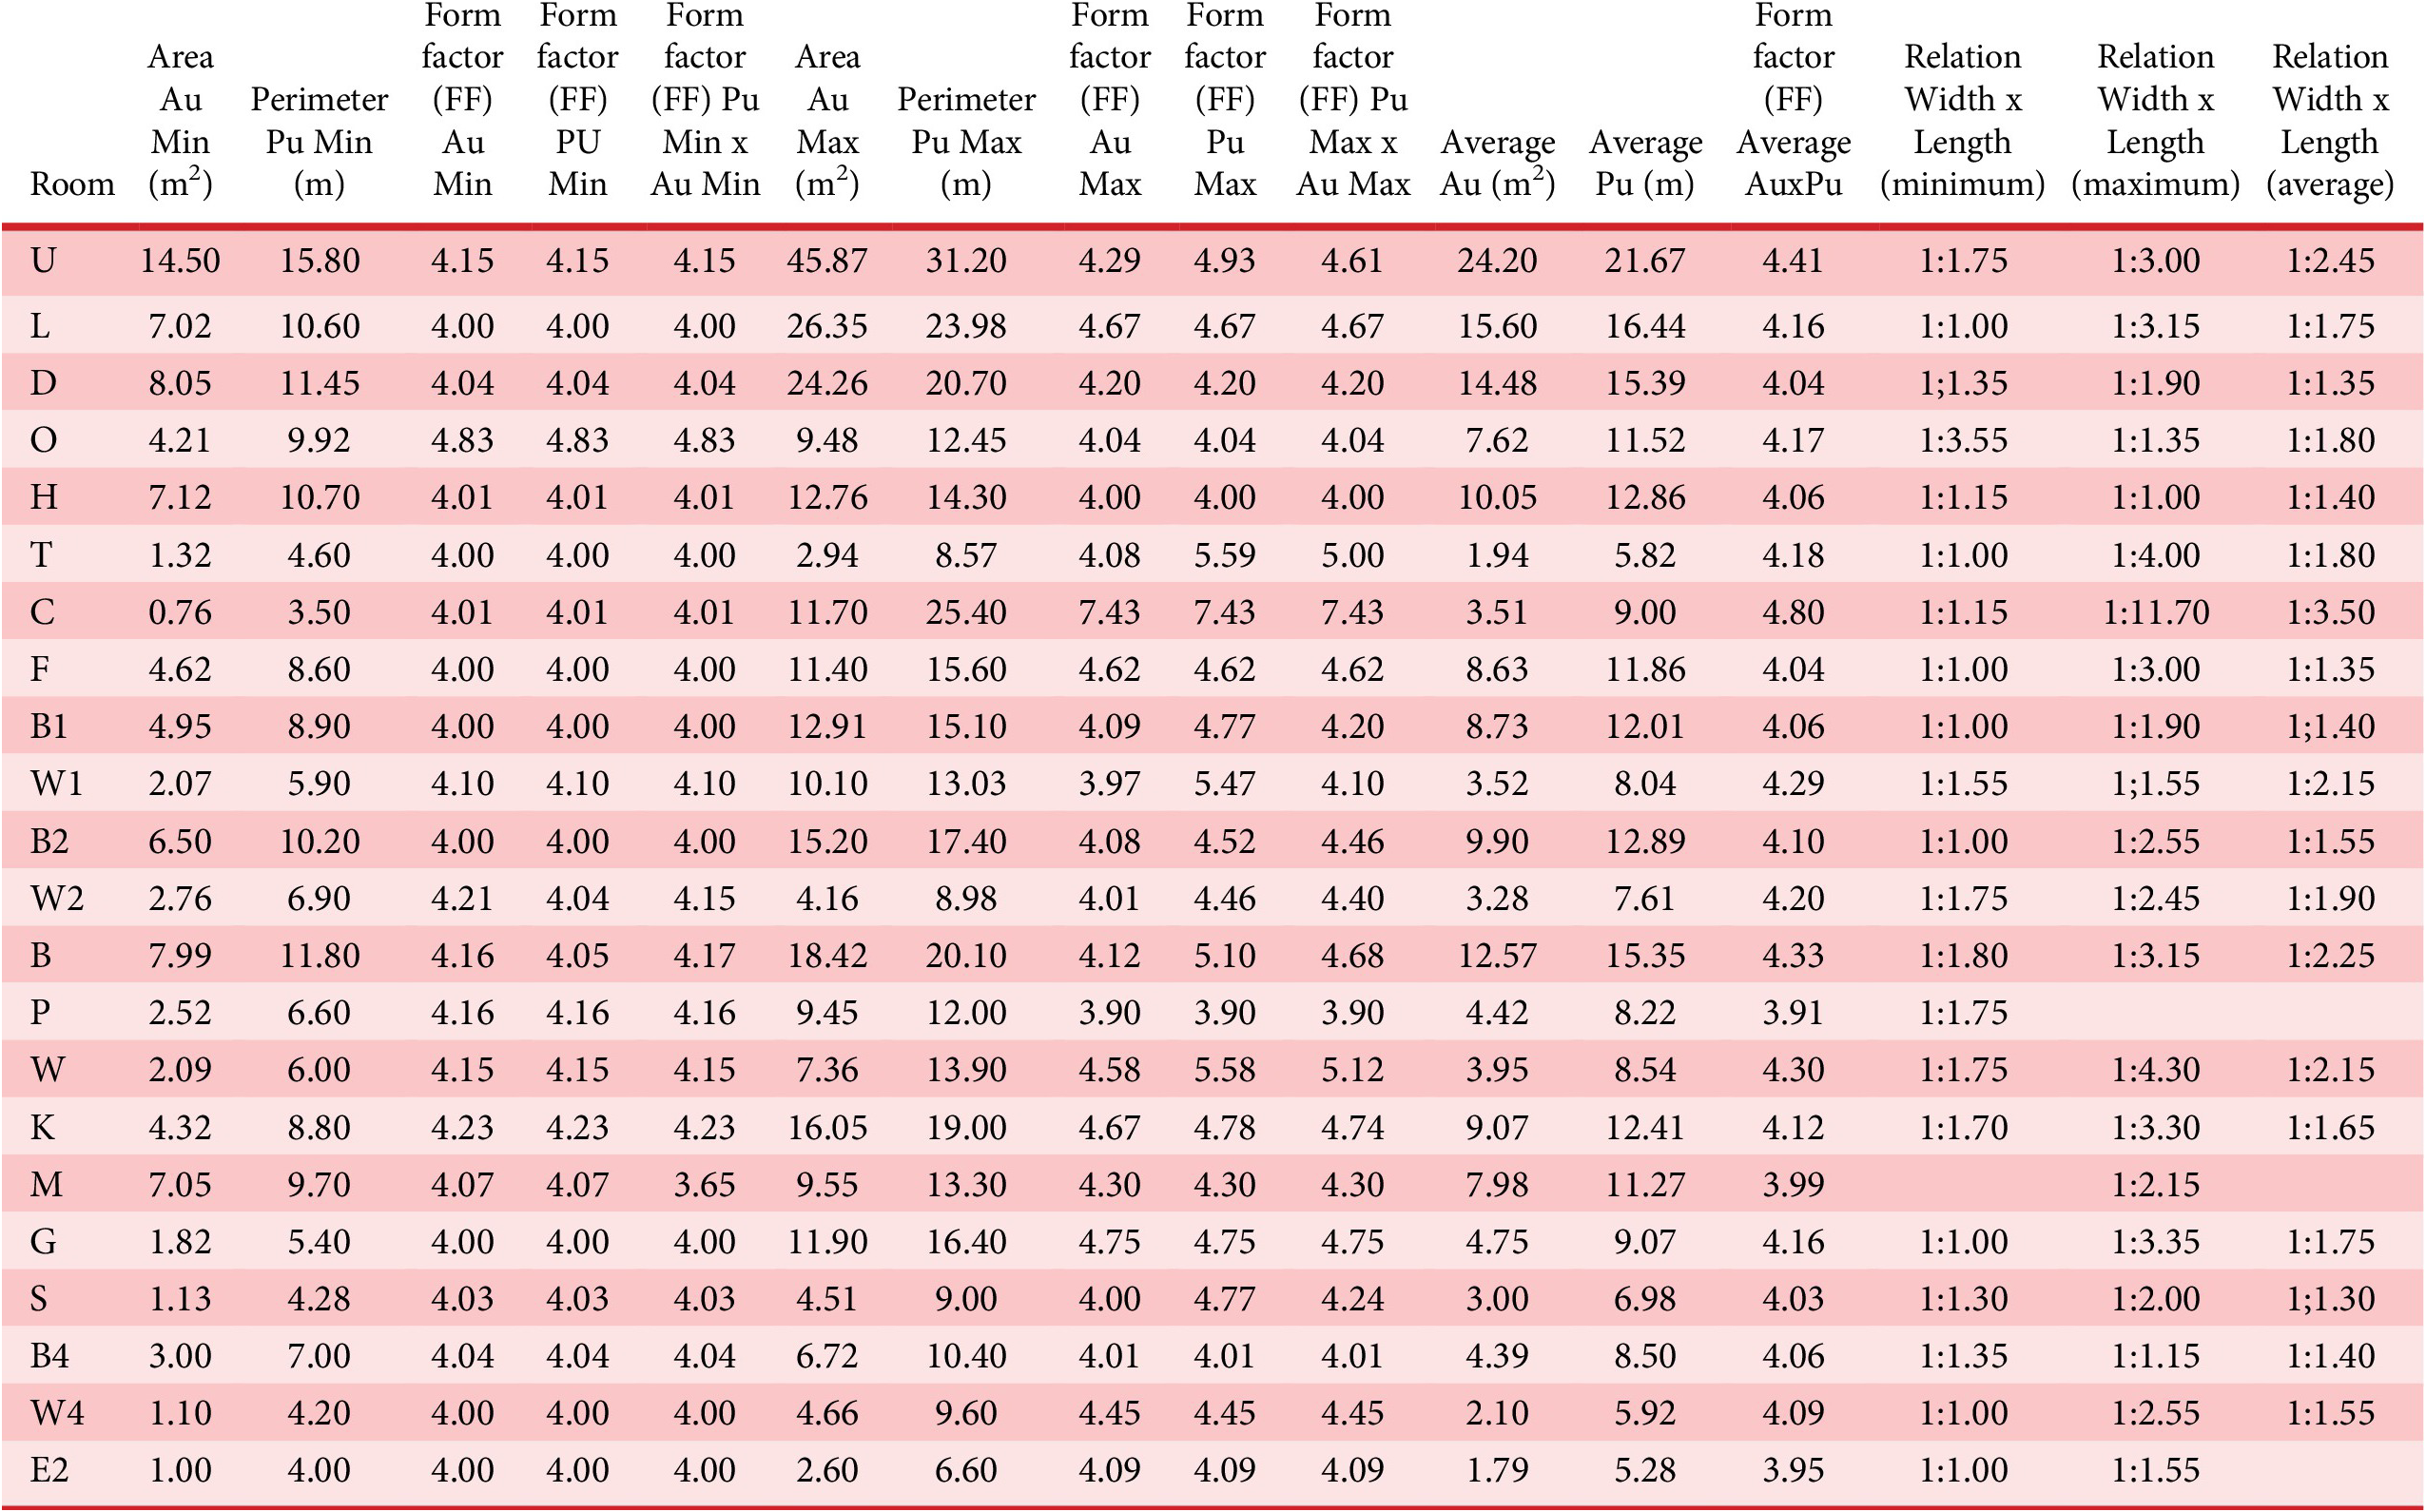
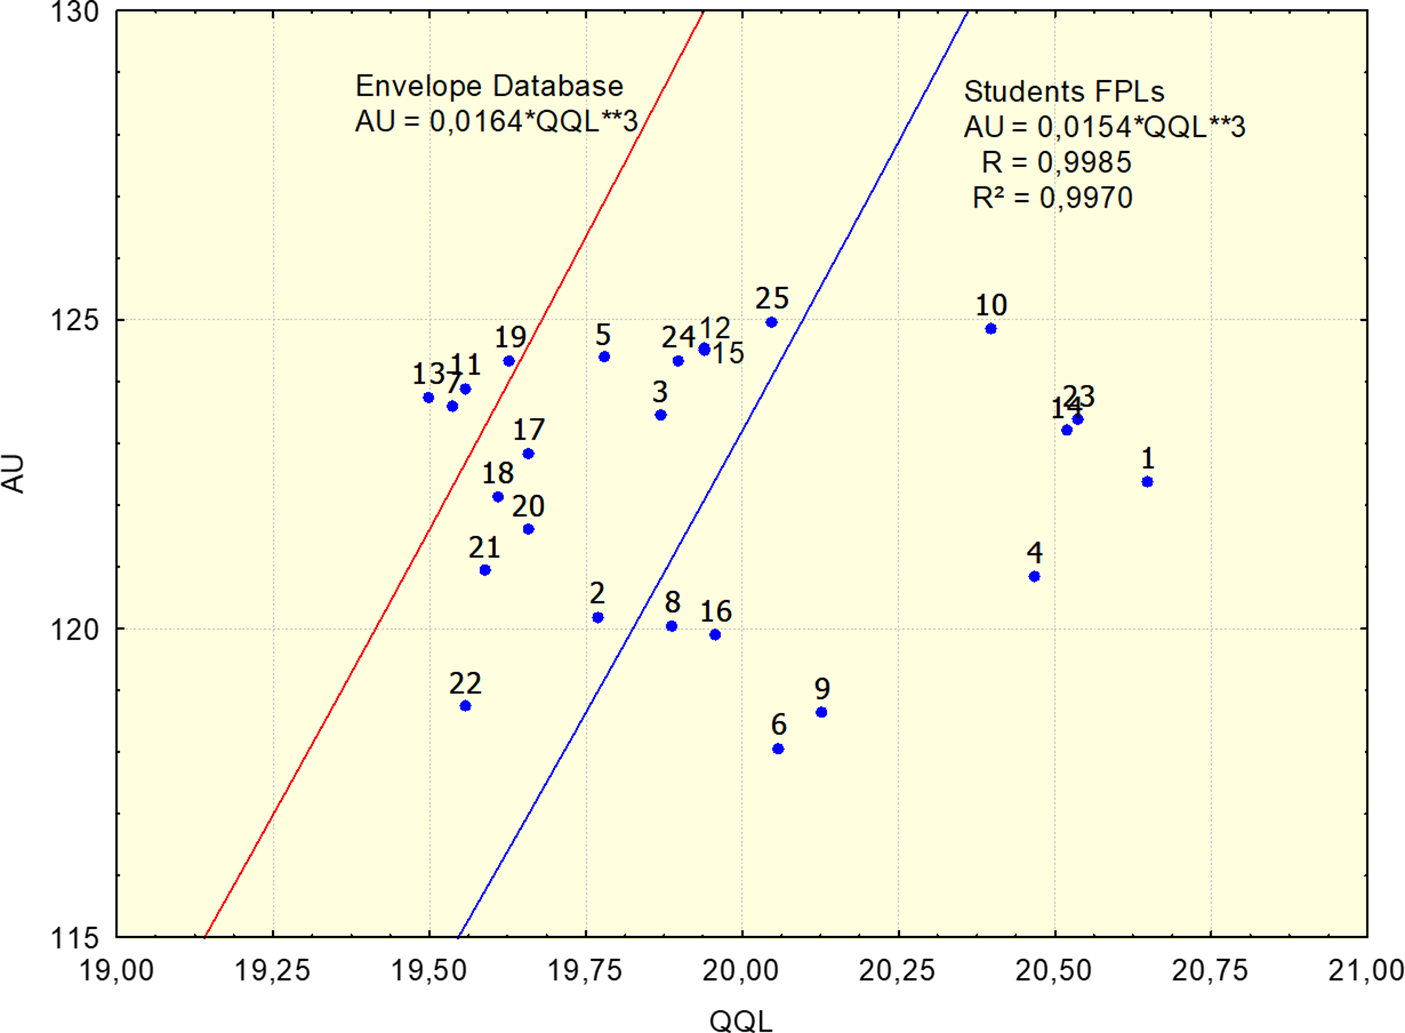
Figure 12. Performance of student-generated designs.
13. Example of the use of the ARLE GPS tool: Spatial planning and design of an apartment
13.1. Data made available by the problem
We consider the spatial planning and design of an apartment in a vertical tower with a centralized circulation core, two units per floor (Nf = 2), and two connections to the external environment (Ne = 2). The target required useful area is AA = AU = 85.0 ± 4.0 m2 (variation 5%), and the target required geometric qualification is QQA = QQL ≥ 16.94 in relation to the target required useful area AA = AU (85.0 m2); this is calculated by the equation AU = 0.0175*QQL**3, which defines the geometric qualification of FPLs belonging to Family 7 of the explored design space, as shown in Figure 3. This condition states that the required functional physical performance of the candidate dwelling must be equal to or better than the performance of the dwellings belonging to Family 7 of the explored design space.
The functional program is as follows:
-
• Conjugated living/dining room (U)
-
• Office home (O)
-
• Gourmet balcony with barbecue (R)
-
• Circulation (C)
-
• Dormitory (B1)
-
• Shared bathroom (W1)
-
• Bedroom/suite (B)
-
• Private bathroom (W)
-
• Kitchen (K)
-
• Laundry/service area (G)
However, this set of data does not allow the architect to clearly define the problem and solve it as a rational, well-defined problem, as the dataset is incomplete. The ARLE GPS tool can be applied as an assistant to help structure and solve the problem.
13.2. Geometric data
The basic data required to assemble the virtual geometric prototype are mined from the value space of the explored design space and processed in statistical mode. These data are explored and captured in the format of the useful area (Au), perimeter (Pu) and shape of each of the functional rooms of the house. These are defined by the form factor (FF) variable and the (width/length) (W/L) ratio of the rooms, which are calculated in relation to their minimum, average and maximum values, as presented in Table 9. They are intended to help the architect to explore the geometric dimensioning of rooms, to collect the data necessary to dimension the rooms of the candidate FPL, and, from these data, to proceed with the construction of a geometric prototype graphic. Additional important functions of the value space involve representing the performance behavior of the candidate FPLs in the explored design space and establishing relationships between design variables and performance attributes through the use of the FPL performance indicators provided by ARLE GPS (the form factor FF, the number of FPL vertices LV, the FPL qualification indices of spaciousness IE, configuration IP, circulation IC, confinement IR, exteriorization IE, the ratio of the total area to useful area (AT/AU), the geometric cost of geometric qualification VAQ, and the monetary cost of geometric qualification VQL). It is also used to define the limits of this performance, as shown in Tables 7 and 8. These indicators define the control parameters of the geometric solution. Mining of the room dimensioning data is achieved by processing the value space as shown in Table 9. Based on the assumption that the area AU of the candidate FPL (AA = 85.00 ± 4.00 m2) is closer to the average AU area of the FPLs of the design space value space (100.90 m2) than the minimum AU area value (52.70 m2) or maximum AU area value (149.11 m2), the average values of the rooms are adopted to establish the geometric dimensioning of the virtual prototype of the candidate FPL, as shown in Table 10. The dimensional values of the area and perimeter of the rooms, and hence the form factor (FF), are shown in Table 9 to provide the ratio (width/length) of the rooms, and the equation W = √(Au/L) makes it possible to establish the individual values of the width (W) and length (L) of the rooms. In this case, the architect was responsible for the dimensioning of the gourmet balcony (R), since this functional room does not exist in the FPLs of the explored design space.
Table 10. Dimensions of the geometric prototype rooms.
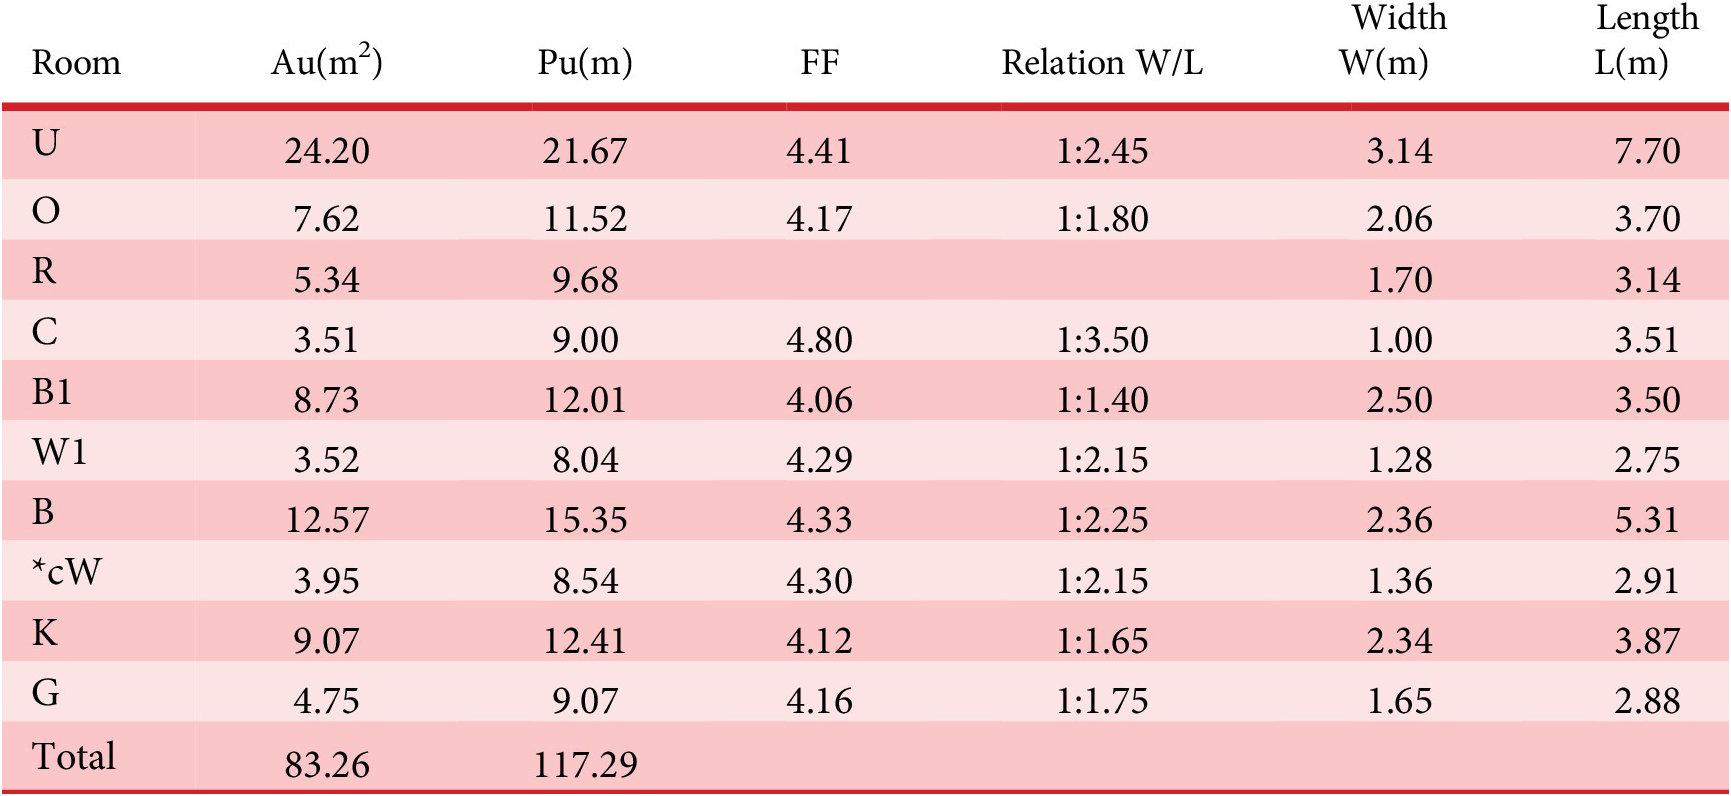
When the geometric dimensions of the rooms have been determined, these values represent the data extracted and transferred to the assembly of the candidate virtual geometric prototype using the ARLE GPS tool, in the form of an Excel spreadsheet. The spreadsheet calculates the value of the useful area AU, which in this case is equal to 83.21 m2, meaning that this meets the dimensional requirement of the problem in relation to the required target area (AA), as shown in Table 11.
Table 11. Data and evaluation of virtual prototype 01.
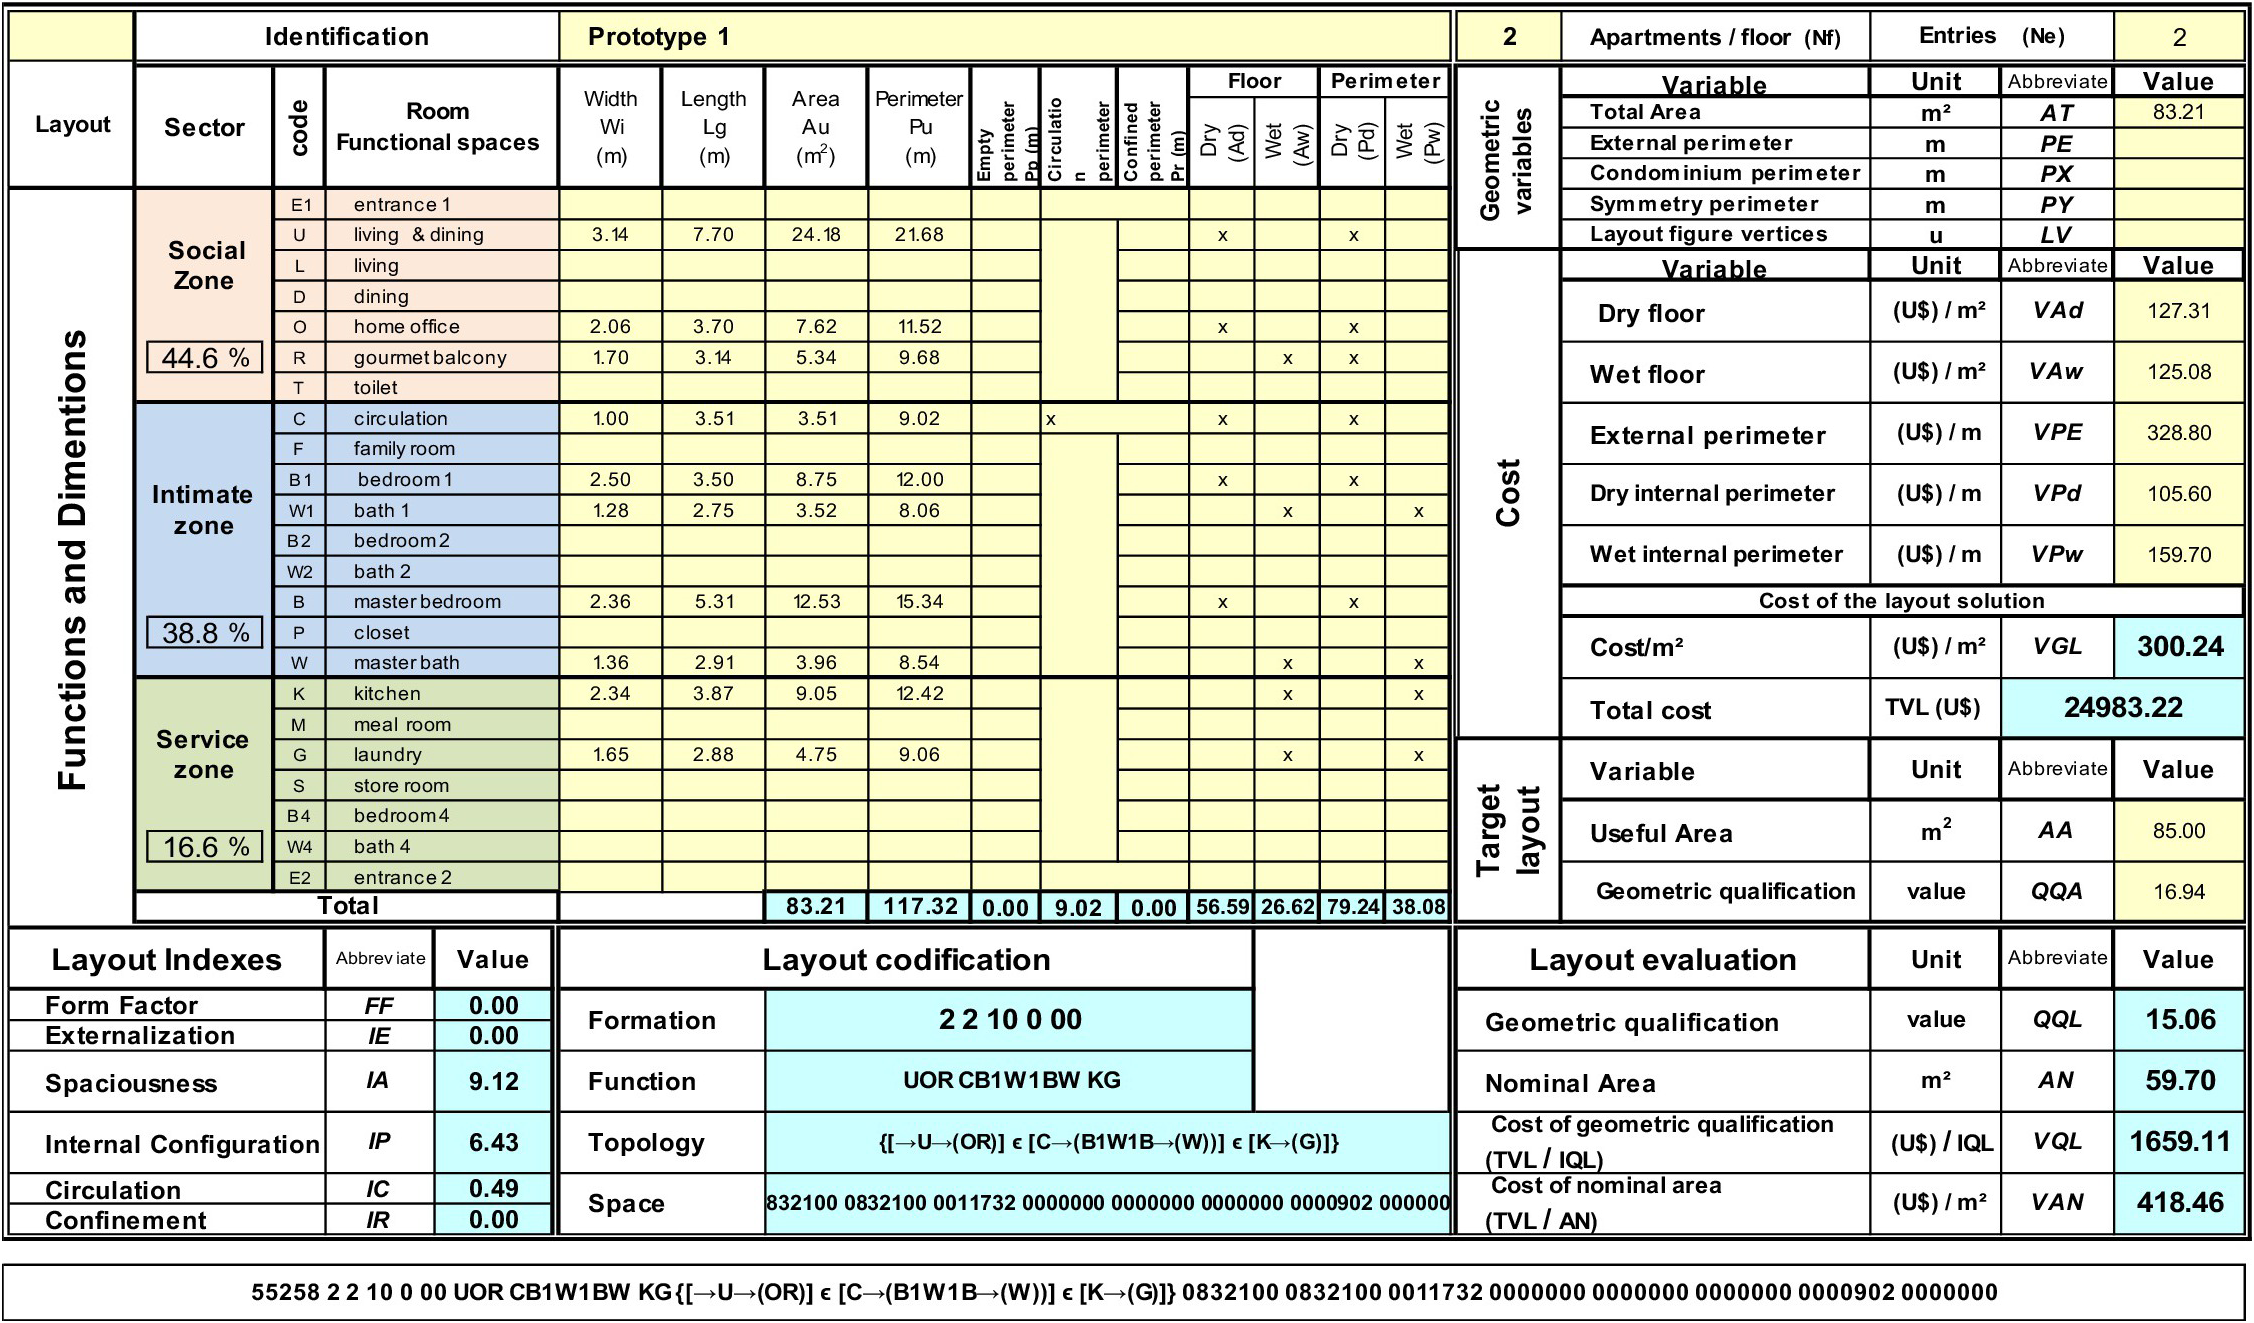
However, the geometric data of the dimensional value of the outline of the figure of the FPL are still needed, as these are required by ARLE GPS to complete the evaluation of this virtual candidate prototype, and thus by the architect in order to certify that it meets the requirements of the problem. However, using the processed data, the spreadsheet can provide topological information of the assembly order of the rooms and their connections through the genetic coding (Gtopology gene) of the processed data, as shown in Table 11.
13.3. Topological data
The information on the connections between rooms, as provided by the Gtopology genetic code of the ARLE GPS spreadsheet, is presented in item 8. The combination of the data provided, the geometric data mined from the value space and the topological data provided by ARLE GPS allows the architect to assemble a puzzle-like graphical prototype, representative of the FPL candidate, using the bottom-up approach.
13.4. Assembling the candidate prototype using the bottom-up approach
The bottom-up assembly process requires the architect to position the rooms in the topological structure of the FPL, in the same way as in a jigsaw puzzle (Cademartiri & Bishop Reference Cademartiri and Bishop2015). In this approach, the search for design solutions is carried out as a process of exploring the positioning of the rooms, such as the solar orientation and the external view of the rooms in the house, which are adjusted in the puzzle to solve the FPL. This requires the architect to apply rational reasoning skills to solve the problem, in the same way as the assembly activities performed by the player to win the game (Smithers Reference Smithers1992; Nico Lo, Lai & Chang Reference Nico Lo, Lai and Chang2014). The assembled FPL prototype is shown in Figure 13.
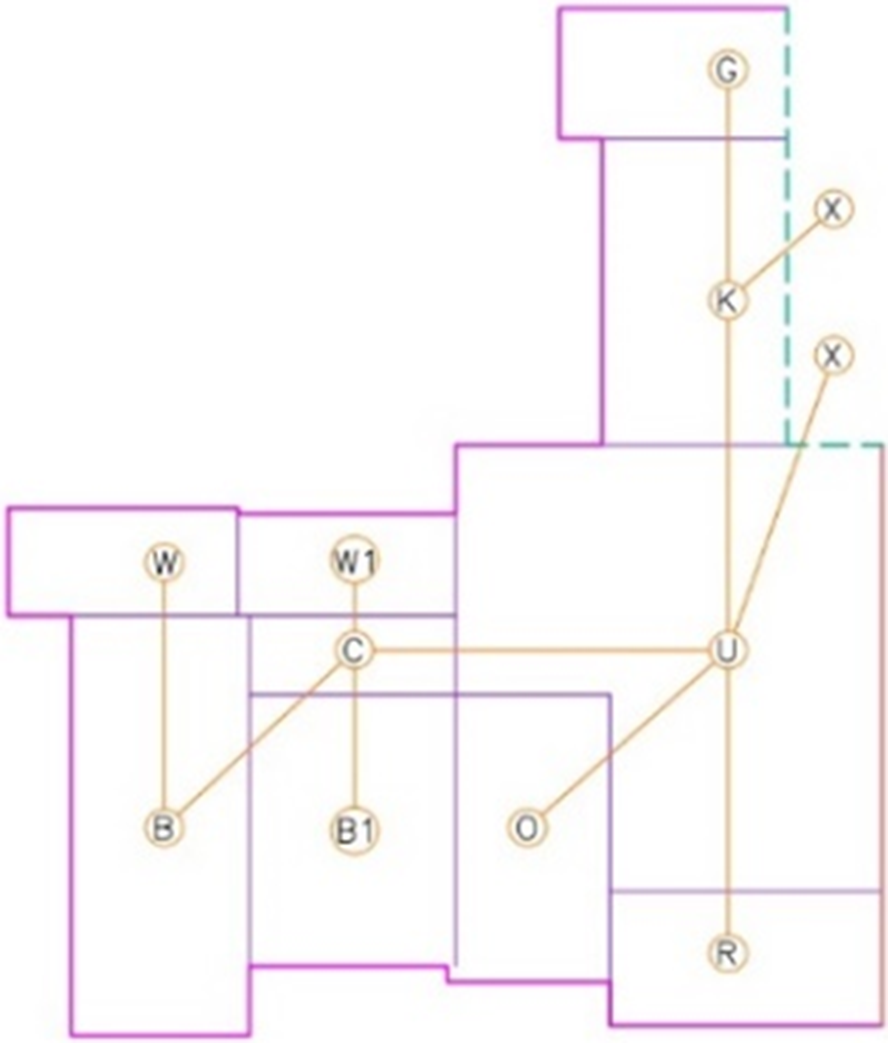
Figure 13. Prototype 2.
A guiding factor for the assembly of the jigsaw puzzle is the positioning of the pieces in such a way that all of them (except for the circulation) have at least one free side in contact with the surface representing the external area of the building, so that the architect can verify the non-confinement of the rooms. The puzzle has undergone two modifications in relation to the first candidate: the first relates to the format of the figure of the living/dining room (O), which is changed from rectangular to “L” format, and the second relates to a reduction in the length of the circulation room from 3.51 m to 2.50 m, due to the adjustment of the piece in the puzzle. A graphical prototype of the FPL candidate is evaluated by ARLE GPS, and gives a value for the useful area of AU = 82.20 m2, which meets the requirement of the target area AA. The assembly of this puzzle, as shown in Figure 13, allows the architect to collect geometric data to complement the FPL prototype data, such as the external perimeter (PE), symmetry perimeter (PX), condominium perimeter (PY) and number of vertices (LV), thus providing the data needed by the architect to build the problem and by ARLE GPS to evaluate it. These data are then loaded into the ARLE GPS spreadsheet, which provides an objective evaluation of the graphical prototype, as shown in Table 12. It calculates the geometric qualification value as QQL = 17.07 and the nominal area as AN = 86.90 m2 > AU = 82.20 m2, meaning that the candidate proposal meets and even exceeds the required geometric qualification QQA, since it presents a nominal area gain according to the loss model processed by the ARLE GPS tool (Martins, Jungles & Oliveira Reference Martins, Jungles and Oliveira2023). This graphical candidate prototype is then modelled and refined by the architect using the top-down approach.
Table 12. Data for graphical prototype 2 and evaluation.
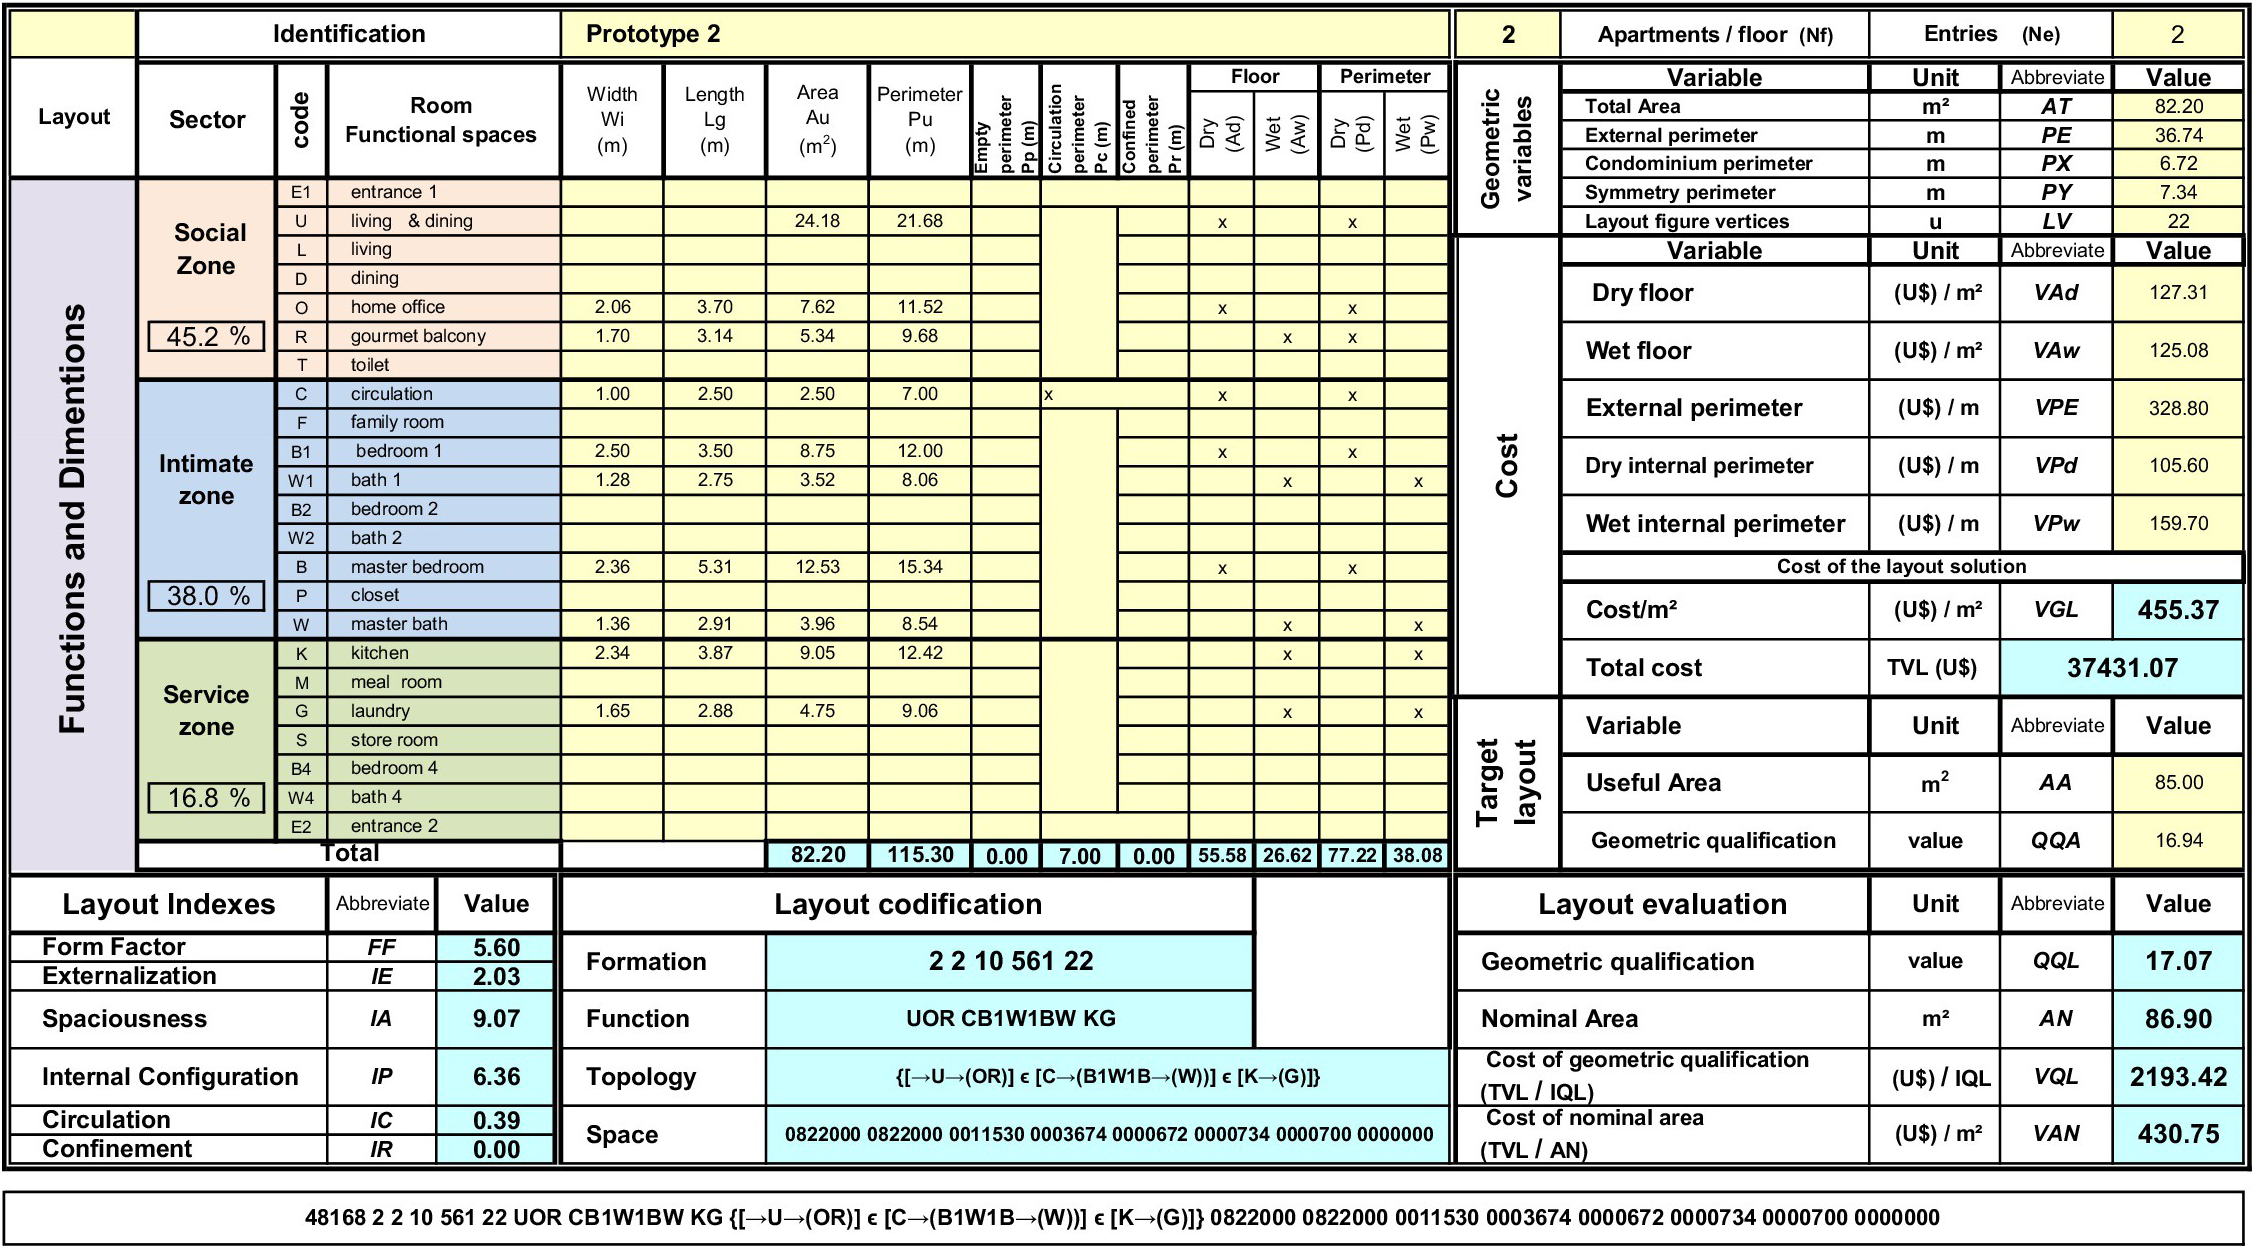
13.5. Modeling and step-by-step refinement of the prototype, using the top-down approach
The top-down approach allows the design process to proceed in stages, from the conceptual and preliminary level of a prototype defined by a sketch to the detailed level of a design. This allows the architect to refine the prototype in a step-by-step manner, adjusting and optimizing the position, shape and dimensions of the candidate rooms, according to their functional purposes, to meet the requirements of the problem. However, according to Zhaa et al. (Reference Zhaa, Dua and Qiub2001), a design process using this approach requires support from a computational tool that can assist the architect in handling the problem data, implementing actions, and making rational decisions throughout the design process. The ARLE GPS tool can play this role in the design process and can assist the architect with these requirements; it successfully fulfils this task in a straightforward way, and there is no alternative, similar tool that fulfils this function. The graphical prototype is assembled in a computational environment, as shown in Figure 13, and reveals the rooms and the FPL format, defined by a schematic sketch of lines, thereby establishing a skeleton for the candidate FPL. This FPL prototype is modeled by the architect, who introduces the walls, door and window connections and other geometric modeling elements of the candidate FPL to build a full-bodied and structured FPL prototype. This refinement process involves adaptations due to various requirements, such as functional dimensioning, implantation of the building in the terrain, optimization of the building structure, orientation of the walls to create constructive and aesthetic improvements to the building, reduction of the construction costs, composition of the building façade, and satisfaction of the client’s requirements that were not met by the candidate prototype. This procedure implies a continuous refinement of the FPL prototype, which is also evaluated by ARLE GPS in a continuous loop process, until the architect captures an FPL that solves the problem (Mitchell, Liggett & Tan Reference Mitchell, Liggett and Tan1989; Fedder Reference Fedder2000). The design captured in this case is shown in Figure 14, and its evaluation is shown in Table 13.
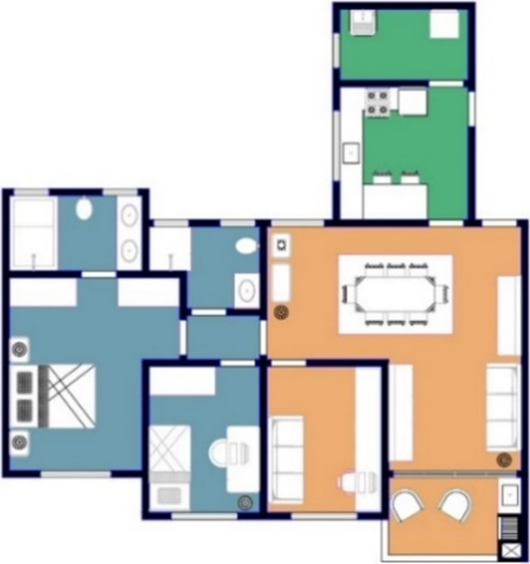
Figure 14. FPL of the apartment.
Table 13. FPL design of the apartment – data and evaluation.

The process of refining the prototype in this case allowed for optimization of the circulation area, with a reduction in the useful area Au and the distribution of this residual area gain in the spatial expansion of other living rooms, as well as the modification and expansion of the area of other living rooms, within the limits of the required target area AA, thus increasing the usability of the apartment. It was also possible to meet the client’s requirements that were not met by the candidate prototype, such as the spatial enlargement of the bedroom/suite and the private bathroom, with the installation of a Jacuzzi bath.
13.6. Geometric optimization of the FPL
The approach used by the ARLE GPS tool to find a good candidate and to optimize the FPL solution is based on a numerical model that relates the cost to the quality of the design (FPL). The quality is captured and evaluated by an analogy model that relates the geometric variables of the FPL to the functional physical performance of the house. The tool works with two costs: geometric and monetary. The geometric cost is determined by the useful area AU, which structures the mathematical model (cost/quality) (Figure 3). This cost allows the architect to solve the problem of FPL optimization through the ratio of geometric cost to geometric quality (AU/QQL), independently of the monetary cost. In other words, it allows the FPL solution to be optimized via the geometric variables controlled by the architect, regardless of the construction system and the materials used in the home. Two rational approaches emerge in this process: reducing costs while maintaining quality or increasing quality while maintaining costs. Reducing costs involves optimizing the functional dimensions of the house and minimizing the geometric costs by optimizing (minimizing) the useful area AU. This condition can be exemplified by the case described above, considering the data on the solution of the problem, as follows: geometric cost AU = 85.59 m2, geometric qualification indices of the FPL IE = 1.78, IA = 9.25, IP = 6.28, IC = 0.29, IR = 0.00, geometric qualification QQL = 17.02; and cost of geometric qualification VAQ = 50,270 cm2/QQL = (5.03 m2/QQL). To create a mathematical simulation of the optimization of the FPL design solution using the geometric cost reduction approach, it is assumed here that the amount of floor area used in the FPL design extrapolates the floor area required for the optimized functional dimensioning of the rooms of the house. Hypothetically, a reduction of 10% in the usable floor area, a value similar to the scale of reduction of the FPL drawing, results in a geometric cost of AU = 77.03 m2. In this case, with the dimensional reduction of the floor area and the maintenance of the room format, the geometric qualification indices of the FPL remain constant, except for the index of spaciousness IE = 8.78, due to the reduction in the floor area. When this new configuration is adopted, ARLE GPS calculates values for the geometric qualification QQL = 16.55, nominal area AN = 79.26 m2 > AU = 77.03 m2, and geometric qualification cost (VAQ = 4.65 m2/QQL) < (VAQ = 5.03 m2/QQL), thus demonstrating that this option represents a rational approach to the process of optimizing FPL by reducing the useful areas of houses/apartments. A comparison between the sizes (floor areas) of apartments designed over the last 50 years, considering typologies and similar uses, shows that the apartments designed today have an area that is reduced by about 50% compared to those designed 50 years ago (Papanek Reference Papanek1985, Queiroz Reference Queiroz2008), indicating that this approach is currently applied in the actual practice of optimization of apartment design. When optimizing the FPL by maintaining the cost and increasing the quality, the cost established by the useful area is maintained, which in the case of apartments 50 years ago was substantially higher than for current ones, and the areas of the rooms are resized until their functional dimensioning is optimized. In the case of rooms with dimensions greater than those required by the functional dimensioning, this implies a need for a reduction in the areas of these rooms; the sum of these surplus areas is then transferred to the creation of one or more living rooms, which in turn makes it possible to increase the utility of the house and, consequently, to improve its performance. This process is captured by the ARLE GPS tool by increasing the geometric qualification QQL, thus establishing a reduction in the cost of quality. This approach is used for today’s homes/apartments, which have surface areas similar to apartments designed 50 years ago. At a local level, there are changes in their use, particularly in relation to reductions in the functional zone of services and enlargements of the intimate zone through an increase in the numbers of private bathrooms and bedrooms that can be converted into study or work rooms. This has also involved the enlargement of the social zone through the availability of more social rooms, the availability of a toilet, the integration of the kitchen with the social area, the establishment of gourmet kitchens, and the incorporation of social balconies, particularly a gourmet balcony with a charcoal grill. In this way, a second rational approach, traditionally applied in the FPL optimization process, is established.
14. Evaluation of FPLs using ARLE GPS
A value space analysis of the design space shows that the performance of the house is independent of its surface area. The FPLs located at the boundaries of the low- and high-qualification FPLs make comparatively explicit, by analogy, the main defining attributes of the house performance as evaluated by the LEQC metamodel. The low-qualification region includes FPL 037 with AU = 70.95 m2 and FPL 164 with AU = 111.30 m2, as shown in Figures 15 and 16.
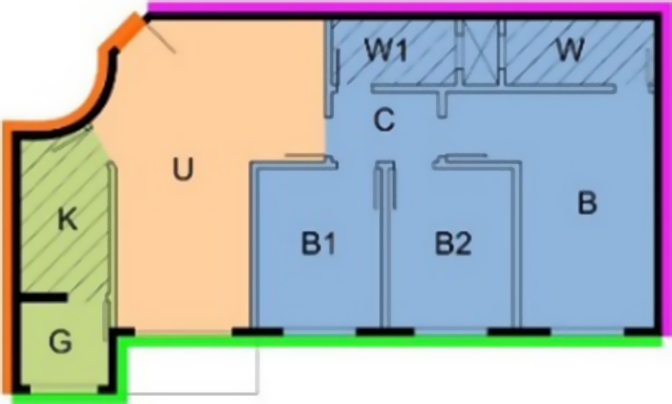
Figure 15. FPL 037.
Genetic code for FPL 037.
53466 8 1 09 439 12 U CB1W1B2BW KG {[→U] ϵ [C → (B1W1B2B → (W))] ϵ [K → (G)]}.
0709500 0829100 0010145 0001425 0000920 0001655 0000710 0002595.
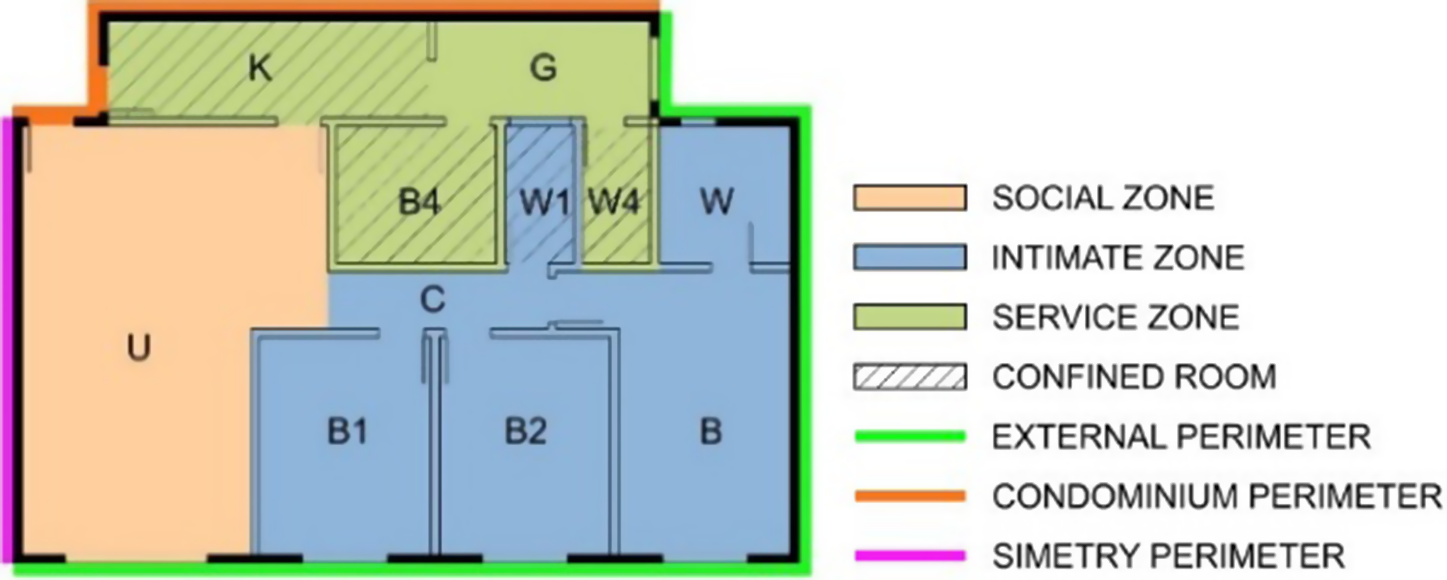
Figure 16. FPL 164.
Genetic code for FPL 164.
69632 4 2 11 414 08 U CB1W1B2BW KGB4W4 {[→U] ϵ [C → (B1W1B2B → (W))] ϵ [K → (G → (B4W4))]}.
1113000 1253800 0013840 0002585 0001300 0000750 0000870 0003940.
FPL 037 is modelled with eight living rooms, three of which are enclosed, and is configured by FF = 4.39, IP = 6.02, IE = 0.78, IC = 0.42, and IR = 1.54. FPL 164 is modelled with 10 living rooms, four of which are enclosed, and is configured by FF = 4.14, IP = 6.56, IE = 1.15, IC = 0.41 and IR = 1.87. FPLs 037 and 164 define the values of the exteriorization and confinement indices, which are at the lower limit of the FPL geometric qualification value space. By analogy, we can transpose this evaluation of the geometric qualification of the FPL in relation to the functional physical performance of the dwellings and deduce that the confinement of kitchens and bathrooms leads to significant losses of performance in the use of the house. This is due to an excessive use of artificial lighting (Leslie Reference Leslie2003), a lack of natural ventilation (Kao et al. Reference Kao, Chang, Hsieh, Wang and Hsieh2009) and a lack of visual contact with the outside environment (Kacel & Yener Reference Kacel and Yener2008). Kitchen users are also exposed to harmful levels of ultrafine particles (Lai & Chen Reference Lai and Chen2007). The kitchen is often designed as a functional room, with less importance placed on it in the process of house design modelling (Lau et al. Reference Lau, Lee, Leung, Ye, Amato, Chau and Wong2006). These losses are calculated by the LEQC metamodel according to a robust design model that uses the quality approach advocated by Taguchi (Kackar Reference Kackar1986; Murphy, Tsui & Allen Reference Murphy, Tsui and Allen2005) through the ARLE GPS loss model (Martins, Jungles & Oliveira Reference Martins, Jungles and Oliveira2023). This makes it possible to assess the effect of changing the sizes and location parameters of the house’s rooms on the social impact of the house, from the initial phase of the design process involving its spatial planning, through a metric that makes it possible to measure this impact. The social impact of the house is established in the model of losses through the influence of the losses reported above on the daily lives of the residents in relation to the use of the house over its useful life. The spatial planning of the FPL, on the other hand, characterizes a still flexible phase of possibilities for modifying the product (house) with the aim of eliminating negative impacts and generating positive ones (Mabey et al. Reference Mabey, Armstrong, Mattson, Salmon, Hatch and Dahlin2021). This approach emphasizes the need to set a target value for the required quality and establishes several levels or regions of artifact quality as a function of the magnitude of the presence of the qualifying variables in the product (Archer Reference Archer1968; Kapur & Cho Reference Kapur and Cho1996; Papalambros & Wild Reference Papalambros and Wild2000, p. 47; Gane & Haymaker Reference Gane and Haymaker2012; Machairas, Tsangrassoulis & Axarli Reference Machairas, Tsangrassoulis and Axarli2014; Yi & Yi Reference Yi and Yi2014; Sönmez Reference Sönmez2015; Sönmez Reference Sönmez2018) (Figure 3). We take FPL 167 as an example in terms of the required quality, and apply the ARLE GPS loss model to the evaluation of FPLs 037 and 164 (Table 1) to calculate the geometric losses using the variable of nominal area. The calculated values of the nominal area (AN) for the FPLs are 38.41 m2 (AU = 70.95 m2) for FPL 037, and 67.12 m2 (AU = 111.30 m2) for FPL 164. In these cases, the loss model calculates significant geometric losses compared to FPL 167, representing large losses in the performance of the house.
The high qualification region is demonstrated by FPL 016 with AU = 62.85 m2 and FPL 167 with AU = 113.98 m2, as shown in Figures 17 and 18.
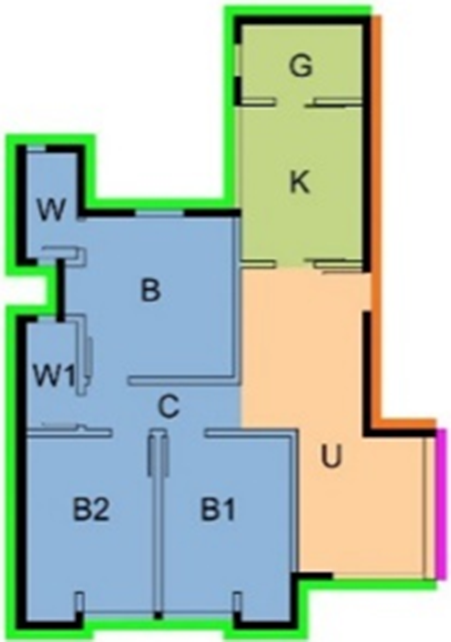
Figure 17. FPL 016.
Genetic code of FPL 016.
40328 4 1 09 537 20 U CB1W1B2BW KG {[→U] ϵ [C → (B1W1B2B → (W))] ϵ [K → (G)]}.
0628500 0747500 0009760 0003370 0000980 0000290 0000710 0000000.
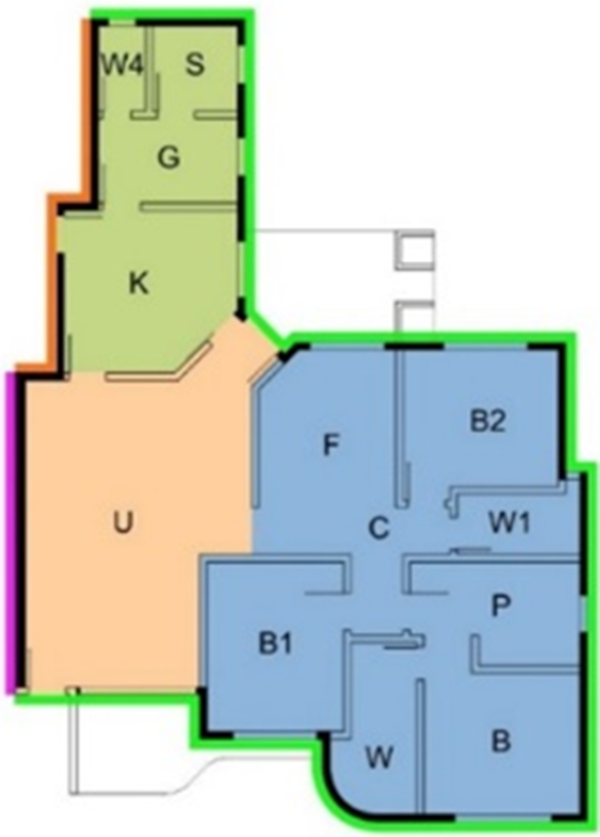
Figure 18. FPL 167.
Genetic code of FPL 167.
59755 2 2 13 501 17 U CFB1W1B2BPW KGSW4 {[→U] ϵ [C → (FB1W1B2B → (PW))] ϵ [K → (G → (SW4))]}.
1139800 1300500 0015133 0004149 0000890 0000665 0001085 0000000.
If we take FPL 167 as the target for the required quality, we see that the nominal area (AN) of FPL 016 is equal to 62.21 m2 (AU = 62.85 m2), which practically defines the absence of loss of house performance in relation to the required quality. FPL 167 is modelled with 12 living rooms, configured as FF = 5.00, IP = 7.09, IE = 1.82, IC = 0.51 and IR = 0.0. A comparison between FPL 164 (low qualification) and FPL 167 (high qualification) shows apartments with similar areas and geometric qualifications positioned on opposite sides of the design space. This difference is explained by the performance of the house in relation to the usability attributes, defined by the differentiation of the housing functionality and the inequality in relation to the confinement of the rooms.
The effectiveness of the ARLE GPS tool in evaluating FPLs from the design space leads to the conclusion that it can capture the performance requirements of the house and transfer them to the planning and design of the house.
15. Discussion
The LEQC meta-model is structured based on data collected from FPLs about apartments located in buildings with basic typologies: isolated towers, centralized vertical circulation, a reinforced concrete structure, and buildings constructed with façade walls and internal walls of ceramic bricks with holes. The global optimization parameters of the FPL geometric solution are used to define and evaluate the functional physical performance of the apartment/house, and are established by maximizing the capture of sunlight, minimizing the geometric cost (Au) of circulation, optimizing the functional dimensioning, and maximizing the use/functionality. Under these conditions, the LEQC meta-model acts as a global optimization model. The use of the GPS-ARLE tool in spatial planning and the evaluation of FPLs in buildings with different constructive typologies (such as closed high-density urbanization, consisting of contiguous sets and blocks, and low-density open urbanization, consisting of isolated towers), as presented here, can be carried out in the same way. However, the solution space for this typology tends to establish different limits in its value space in relation to the value space of the typology studied here, with displacement of the high-performance regions of the FPLs. In this case, the target should be positioned according to this value space.
An important issue in the spatial planning of apartments is the positioning of the rooms in relation to the solar orientation and the exterior view/landscape. However, in the case of isolated towers with centralized vertical circulation and a configuration with several apartments per floor, it is not possible for the architect to totally solve this problem. Thus, the architect will position the rooms of the apartment according to their functionalities, the orientation and position of the building’s main façade (access to circulation routes), the connections between the rooms, and the axes of symmetry between the apartments, which make it possible to reproduce the other units symmetrically. This tool works in the same way as the one presented here for the planning and design of detached houses; the only difference between these two uses is that in the case of a house, the values of the symmetry and condominium perimeters are equal to zero. The tool is structured by assuming the functionality, the order of assembly, and the connections between the rooms of the apartments of the design space, although these parameters can be modified in the Excel spreadsheet according to the different functionalities of the rooms of the candidate apartments. The Gfunction gene captures and transfers this information from the positioning and naming of the rooms in the Excel spreadsheet. A change to the use of the rooms, if they are topologically compatible, i.e., belonging to the same functional zone, does not imply a change in the coding of the spreadsheet; this is illustrated in the example presented in item 13, with the replacement of the home theater room and its nomenclature (H) by the gourmet balcony (R). The spreadsheet is built using open-source code, which allows for modifications to suit specific local situations. Data are input into the Excel spreadsheet by filling in the yellow cells, and the output data is represented by the blue cells.
15.1. Future work
The design space studied here consists of 180 FPLs of apartments, which were designed and built in large and midsize cities in the late 1990s and early 2000s. It represents a sample of dwellings whose functionalities are arranged in 23 functional rooms that structure the Excel spreadsheet of the tool. The current designs of apartments with similar characteristics (three bedrooms) to the apartments of the design space studied here show changes in the functional zoning, particularly in relation to the contraction of the service area, with the elimination of the laundry room (through integration with the kitchen), pantry, service dormitory, and service bathroom, and the expansion of the social area, with the integration of the kitchen and gourmet balcony (with barbecue) with the living/dining room. These and other changes in the functionality of the dwellings will require future work, particularly in terms of updating the design space of the apartments to reflect these new configurations. Segmentation of the design space based on the structuring of family groups with greater affinities, both in terms of the group (formation/number of apartments per floor) and the family (use/functionality), constitutes another avenue for future work. Similarly, at the global level, there is a need for future work to create the respective local design spaces.
16. Conclusion
The ARLE GPS tool offers architects and students a user-friendly form of computational support, with a focus on the designer’s behavior rather than on the project, which can help them to solve spatial planning problems and generate computer-aided designs. This is done using the physical-biological and cost model provided by the tool to structure and solve the problem in a simple way and with low costs for simulation and computational processing, using Excel spreadsheet software, which is already routinely used by architects. A scientific method is applied that facilitates the mathematical modelling of the decision problem and can help users to build and find a solution to the problem using computational thinking to make decisions and implement actions. ARLE GPS acts in an unprecedented way to carry out an objective (mathematical) evaluation of the geometric solution of the FPL (that is, the functional physical performance of the house) and to define the monetary cost of the conversion of the FPL into a house artifact through the geometric variables that structure the FPL. This enables the designer to manage the cost of design decisions. The support provided by the tool to the designer, in regard to the solution to the spatial planning problem and the generation of the design of the house, differs from the traditional process of solving this type of problem through an inversion of the architectural design process. The traditional process begins with the drawing of a topological sketch, without the dimensions of the rooms, whereas ARLE GPS begins with the assembly of a virtual geometric prototype, structured/dimensioned and created by ARLE GPS, which is used to evaluate the prototype in relation to the assumptions of the problem and the required performance of the house. This prototype provides dimensional data on the rooms of the house (width and length) and the topological information of the FPL assembly, defined by the connections and the order of assembly of the rooms into the FPL structure. The transformation of this virtual prototype into a graphical prototype is then processed by the designer in a computer environment. The graphical prototype is modeled and refined by the designer and evaluated by ARLE GPS in a continuous process until the designer has generated an FPL that meets the requirements, constraints, and goal of the problem. In this way, the ARLE GPS model removes the main obstacles to the rejection of the systematic model proposed by Archer. A computer-aided design tool is created that provides a robust design model based on physical-biological and cost approaches, which is capable of dealing with the complexity of the interrelationships of the structuring variables of the FPL, through:
-
• Helping the designer to find and use good physical and genetic data and information to solve the problem;
-
• Enabling a review of the design program and changes to the structure of the FPL throughout the design process;
-
• Transforming the poorly structured problem of spatial planning into a well-structured problem by removing the perversity of the problem;
-
• Making available bottom-up, top-down and case study strategies for assembling the FPL structure;
-
• Exploring the state of the FPL solution, modeling it, and progressively refining the result of this exploration.
ARLE GPS also offers the prospect of applying Archer’s systematic model in other areas of design besides the architectural domain. Support for ARLE GPS as a simulation, evaluation and optimization system over a long period of time in the field of architectural design education has led, according to feedback from students, to the extension of their domains in the architectural design process, as well as to the establishment of a level of knowledge, skills, creativity and computational practice that has enabled them to successfully solve the problem of spatial planning and design generation with a level of performance of the houses that matches or exceeds that required for the prescribed problems, as well as in relation to the houses located in the high-performance region of the explored design space. The students highlighted the role played by the tool as an assistant, the attitude adopted by the user as a decision maker and implementer of actions, and the exercise of self-evaluation as important aspects of achieving this relevant position in the architectural design process.
Financial support
This survey has not received any financial support from any public, private sector, or non-profit funding agency.
Competing interest
There are no conflicts of interest to be reported.


 Open access