


1. Introduction
Design is an inherently recursive, complex, nonlinear process that changes environments (Zeng and Cheng Reference Zeng and Cheng1991; Zeng Reference Zeng2001, Reference Zeng2015) and is focused on transforming current situations into preferred outcomes (Simon Reference Simon1996). On the other hand, creativity is defined as the process of generating original, effective and unexpected solutions (Runco & Jaeger Reference Runco and Jaeger2012). Design is central to the concept of creativity (Ralph Reference Ralph, Winter, Zhao and Aier2010) and design research is shifting from routine processes toward exploring creativity as a key to enhancing designers’ capabilities (Nagai & Gero Reference Nagai and Gero2012).
Design creativity is typically defined as the condition in which the resulting product itself exhibits creativity. Practicality and contextual relevance are fundamental criteria of creativity (Runco & Jaeger Reference Runco and Jaeger2012). Design creativity outcomes are commonly evaluated through three standard criteria: originality (or novelty), effectiveness (or utility and usefulness) and surprise (Sternberg & Lubart Reference Sternberg and Lubart1999; Boden Reference Boden2004; Runco & Jaeger Reference Runco and Jaeger2012).
The creative process is closely tied to the designer’s capacity to continuously reinterpret and refine ideas, often prompted by unexpected elements that require reframing and adaptation (Dorst & Cross Reference Dorst and Cross2001; Cross Reference Cross2006). This recursive interaction between ideation and evaluation distinguishes design creativity from general forms of creativity, as it requires navigating multi-constraint trade-offs and addressing issues of embodiment and manufacturability, while producing original, feasible and contextually appropriate solutions (Jia and Zeng, Reference Jia and Zeng2021; Yang, Quan, & Zeng Reference Yang, Quan and Zeng2022).
Creativity involves higher-order cognitive mechanisms and multiple cognitive phases (Cropley Reference Cropley and Cropley2015). Foundational models of creativity, such as Wallas’s linear four-stage cycle of preparation, incubation, illumination and verification (Wallas Reference Wallas1926), provided an influential narrative structure; however, their linear progression does not adequately reflect the dynamic and interactive nature of real-world problem solving (Eindhoven & Vinacke Reference Eindhoven and Vinacke1952). The linear models oversimplify creativity as ideas evolve dynamically through cycles of problem understanding, solution generation, evolution and evaluation (Eindhoven & Vinacke Reference Eindhoven and Vinacke1952).
Similarly, this shortcoming is particularly evident in design creativity, where originality arises through recursive processes rather than from a single moment of insight (Nguyen and Zeng, Reference Nguyen and Zeng2012). Design creativity is a purposeful and exploratory decision-making process, requires several cognitive processes happening in a complex pattern, enabling designers to define and redefine problem spaces, decide on variable values through searching and restructuring knowledge while interacting with evolving contexts (Gero Reference Gero1996). Designers engage with ill-defined problems by continually framing and reframing them, exploring multiple partial solutions in parallel and integrating feasibility checks into the ideation process. Understanding design creativity requires theories that capture the dynamic feedback between the designer, the problem and the environment, highlighting that creativity in design is a complex, nonlinear and recursive process that cannot be adequately represented through linear models (Zeng & Cheng Reference Zeng and Cheng1991; Simon Reference Simon1996; Zeng Reference Zeng2001; Boden Reference Boden2004; Nguyen & Zeng Reference Nguyen and Zeng2012; Yang et al. Reference Yang, Quan and Zeng2022).
1.1. Recursive and co-evolutionary models of design cognition
Various logical, psychological and neurocognitive frameworks describe design creativity as a nonlinear, dynamic, recursive and co-evolutionary process. Collectively, they form a multi-level theoretical foundation linking design reasoning, cognition and neural activity within a unified nonlinear and recursive perspective. The following section provides a brief overview of these perspectives.
1.2. Logical models
Zeng and Cheng’s recursive logic of design formalizes the design processes’ dynamic interdependencies by demonstrating that problem statements, domain knowledge and tentative solutions evolve recursively through mutual dependence (Zeng & Cheng Reference Zeng and Cheng1991). They introduced the concept of recursive logic of design, which asserts that valid design reasoning involves a recursive relationship among the minor premise (design problem), major premise (design knowledge) and the conclusion (design solution) (Zeng & Cheng Reference Zeng and Cheng1991). Extending that logic, a nonlinear design-dynamics model describes the designer–product–environment triad as a chaotic system, highly sensitive to initial conditions and susceptible to abrupt qualitative transitions (Zeng & Jing Reference Zeng, Jing, Yang, Zhou and Li1996; Zeng & Gu Reference Zeng and Gu1999; Zeng Reference Zeng2001, Reference Zeng2015).
Complementary approaches – such as concept–knowledge (C–K) theory (Hatchuel & Weil Reference Hatchuel and Weil2002, Reference Hatchuel and Weil2003), cyclical and co-evolutionary models (Roozenburg & Cross Reference Roozenburg and Cross1991; Roozenburg Reference Roozenburg1993; Maher & Kundu Reference Maher and Kundu1994; Maher & Poon Reference Maher and Poon1996) and complex adaptive system perspectives (Lambert Reference Lambert2020) – collectively argue that design creativity unfolds recursively and metastably, rather than as a fixed linear pipeline, involving continual oscillation between structured and unstructured states. These models portray design creativity as an adaptive and continuous interplay between concepts and knowledge, as well as problems and solutions – governed by principles of co-evolution, complexity, chaos and recursion.
1.3. Psychological models
The dynamic creativity and Four-P frameworks (Botella & Lubart Reference Botella, Lubart, Beghetto and Corazza2019; Corazza Reference Corazza, Beghetto and Corazza2019; Rabinovich & Varona Reference Rabinovich and Varona2021; Corazza, Agnoli, & Mastria Reference Corazza, Agnoli and Mastria2022; Richards Reference Richards2022) are psychological models describing creativity as an evolving interaction between the person, process, product and environment. They frame creativity as a dynamic, context-sensitive mental activity shaped by cognitive, emotional and situational factors. These models capture individual-level mechanisms of creative behavior but do not address the systemic or neurocognitive foundations of design reasoning.
1.4. Neurocognitive explorations
Neurocognitive research is a key approach to studying design creativity by linking brain dynamics with theoretical models. As an effective neuroimaging modality, electroencephalography (EEG) has been extensively employed to explore the neural correlates of creativity, design and design creativity processes (Dietrich & Kanso Reference Dietrich and Kanso2010; Nguyen and Zeng, Reference Nguyen and Zeng2014; Fink & Benedek Reference Fink and Benedek2014; Zhao et al. Reference Zhao2020; Balters et al. Reference Balters2023; Soroush & Zeng Reference Soroush and Zeng2024). Recent studies combining EEG and machine learning have advanced the prediction of creative performance, ranging from novelty, quality and elaboration in ideation (Hu, Booth, & Reid Reference Hu, Booth and Reid2017) to comparisons of artistic and engineering mindsets (Yin, Han, & Childs Reference Yin, Han and Childs2024), user-centered design modeling (Wang et al. Reference Wang, Wang, Peng, Chen, Wu, Wei, Childs, Guo and Li2020), divergent and convergent thinking (Li, Becattini, & Cascini Reference Li, Becattini and Cascini2024) and cognitive load detection (Lukačević, Becattini, & Škec Reference Lukačević, Becattini and Škec2025).
In line with the theoretical nonlinear and recursive models, recent neuroscientific perspectives similarly depict creative cognition as transitions among transient brain states governed by the coupled nonlinear dynamics of memory, attention and perception (Andreasen Reference Andreasen2011; Rabinovich, P. Nguyen, A. Nguyen & Zeng, Reference Nguyen, Nguyen and Zeng2019; Zaks, & Varona Reference Rabinovich, Zaks and Varona2020) or through EEG nonlinear features (Zangeneh Soroush & Zeng Reference Zangeneh Soroush and Zeng2025). Rabinovich et al. (Reference Rabinovich, Zaks and Varona2020) modeled creativity through nonlinear interactions, revealing how coupled nonlinear dynamics drive creative thought. The creative ideation framework (Benedek et al. Reference Benedek2023) describes memory-driven ideation as a dynamic sequence of search, construction and evaluation. Likewise, Andreasen (Reference Andreasen2011) highlighted the brain’s chaotic, self-organizing nature, viewing creativity as an emergent property of this system. Together, these explorations portray creative cognition as shifts between dynamic brain states driven by interacting nonlinear dynamics.
Despite valuable insights from frequency-based EEG studies focusing on spectral power (alpha, beta, gamma), task-related power (TRP) and event-related synchronization/desynchronization, most research still relies on linear, stationary methods that overlook the brain’s inherently nonlinear and complex dynamics. Consequently, these approaches remain limited in capturing the chaotic and recursive neural patterns proposed by design-theoretic models (Soroush & Zeng Reference Soroush and Zeng2024; Zangeneh Soroush & Zeng Reference Zangeneh Soroush and Zeng2025). There are also several inconsistencies among the findings of EEG spectrum-based studies (Mazza et al. Reference Mazza, Dal Monte, Schintu, Colombo, Michielli, Sarasso, Törlind, Cantamessa, Montagna and Ricci2023). Additionally, findings vary across design and creativity task type, expertise and gender, revealing a complex neural pattern (Fink & Benedek Reference Fink and Benedek2014; Raymond Reference Raymond2017; Balters et al. Reference Balters2023; Jia and Zeng, Reference Jia and Zeng2021; Jia et al, Reference Jia2021; Soroush & Zeng Reference Soroush and Zeng2024). Moreover, neurocognitive research on design creativity is still in its early stages, constrained by the open-ended, ill-defined nature of design tasks and their dynamic evaluation criteria. The absence of clear stimulus–response relationships in design further implies the presence of nonlinear EEG dynamics during creative processes (Zhao et al. Reference Zhao2020).
Consequently, a key theoretical prediction remains untested: if design creativity is inherently nonlinear and recursive, its neural activity should exhibit corresponding nonlinear and recursive dynamics. Integrating insights from recursive and nonlinear models with EEG and machine learning studies underscores the need for recurrence-based approaches that move beyond traditional deterministic EEG analyses. Accordingly, the present study examines recursive brain dynamics across different phases of design creativity to uncover its underlying neurocognitive foundations.
1.5. Recursion and recurrence quantification analysis (RQA)
Beyond design and design creativity processes, recurrence is a fundamental concept in dynamic systems, first introduced by Henri Poincaré (Poincaré Reference Poincaré1892) to characterize a system’s dynamical behavior (Eckmann, Kamphorst, & Ruelle Reference Eckmann, Kamphorst and Ruelle1987; Marwan et al., Reference Marwan and Carmen Romano2007). Recurrence forms the basis of a mechanism that facilitates the emergence of complex behaviors, adaptability and evolution in systems. This property is particularly pronounced in complex systems, where interdependent components interact nonlinearly, giving rise to emergent phenomena (Mitchell Reference Mitchell2009; Lopes et al. Reference Lopes2021).
Recurrence can be measured and quantified. In the late 1980s, Eckmann et al. introduced the recurrence plot (RP) as a method to visualize recurrences in dynamical systems (Eckmann et al. Reference Eckmann, Kamphorst and Ruelle1987). Building on this, Recurrence Quantification Analysis (RQA) was developed to quantify recurrence patterns mathematically (Marwan et al. Reference Marwan2002, Reference Marwan and Carmen Romano2007). RQA analyzes a signal’s trajectory in its phase space to reveal the system’s dynamic behavior. Its quantitative measures, ideal for nonlinear and nonstationary time series, detect critical transitions and disruptions in complex systems, often outperforming linear methods and proving highly effective across fields such as physics, ecology, finance, engineering and neuroscience (Webber & Zbilut Reference Webber and Zbilut1994; Marwan et al., Reference Marwan and Carmen Romano2007).
In neuroscience, RQA has been extensively used to analyze EEG signals, including applications such as seizure prediction, cognitive impairment classification, sleep stage classification, monitoring anesthesia depth, neurodegenerative disorders and identifying brain dynamics in different cognitive conditions (Song, Lee, & Kim Reference Song, Lee and Kim2004; Becker et al. Reference Becker2010; Heunis et al. Reference Heunis2018; Ledesma-Ramírez et al. Reference Ledesma-Ramírez, Hernández-Gloria, Bojorges-Valdez, Yanez-Suarez and Piña-Ramírez2023; Chandrasekharan et al. Reference Chandrasekharan2024; Goel, Agrawal, & Bharti Reference Goel, Agrawal and Bharti2024). It shows the strengths of RQA to reveal complex, nonlinear and recursive brain dynamics.
1.6. The present study
Figure 1 illustrates the overall workflow of the study. This study applies RQA to preprocessed high-density EEG signals, recorded in loosely controlled design creativity experiments (Nguyen & Zeng, Reference Nguyen and Zeng2014), to investigate the nonlinear and recursive neural dynamics underlying design creativity. While RQA has been widely used in other domains, this represents its first application in design creativity research. EEG signals were recorded during four cognitive phases of a modified Figural Torrance Test of Creative Thinking (TTCT-F) – idea generation (IDG), idea evolution (IDE), idea rating (IDR) and rest (RST).

Figure 1. Block diagram of the proposed framework for exploring recursive neural dynamics and validating theoretical models of design creativity.
RQA metrics were extracted across cortical regions to characterize diverse forms of recursion and nonlinearity, revealing the dynamic structure of brain activity across cognitive states. The analysis identified significant neural markers (features) of recursive dynamics for each cognitive state. The suggested feature selection effectively enabled the classification of cognitive states.
This study investigates the recursive and nonlinear brain dynamics underlying design creativity, bridging theoretical models with empirical evidence. By identifying key EEG features, classifying cognitive states and mapping neural activations, it introduces a novel neurocognitive framework consistent with recursive and co-evolutionary theories, offering new insights into creative design cognition and advancing theoretical, computational and neurocognitive understanding of design creativity.
1.7. Contributions of the present study
The present study provides novel insights distinct from and complementary to previous research. The contributions of the present study can be summarized as follows:
-
- Bridging research gaps. By applying RQA, this study overcomes limitations of linear, deterministic approaches. RQA captures complex, nonlinear and recursive brain dynamics, offering empirical exploration and deepening our understanding of recursive neural activity during creative design tasks.
-
- Feature selection and high-performance classification. An effective feature selection pipeline is suggested for distinguishing between cognitive states, which can be employed in future studies. The significant features (neural markers) enabled reliable and high-performing classification using multiple models and validation strategies.
-
- Neuroscientific and topographic insights. Statistical and topographic analyses revealed distinct neural correlates across the brain regions. These findings empirically support the recursive theoretical models and provide a novel and deeper understanding of design creativity neurocognitive processes.
-
- Foundation for future research. By introducing a novel methodology and validated feature set, this work lays a strong foundation for future studies exploring the cognitive and neural basis of design creativity.
1.8. Hypotheses
Here, we briefly outline the hypotheses:
H1: The brain dynamics associated with the design creativity cognitive states (idea generation, idea evolution and idea evaluation) have recursive characteristics.
H2: EEG recurrence quantification analysis reveals distinctive recursive brain dynamics that differentiate the cognitive states underlying design creativity.
H3: Classifiers using RQA-based features achieve high performance in categorizing EEG signals into cognitive states of design creativity.
The hypotheses ensure consistency between the study’s goals and its empirical approach.
The structure of the paper is as follows: Section 1 provides the introduction. Section 2 details the materials and methods. The results are presented in Section 3, followed by a discussion in Section 4. Finally, Section 5 concludes the paper.
2. Materials and methods
2.1. Design creativity EEG dataset
In this study, we used preprocessed and segmented EEG data (Jia & Zeng, Reference Jia and Zeng2021; Soroush et al. Reference Soroush2023). This dataset comprised 28 right-handed graduate engineering students (4 women), aged 22–35. All participants had normal or corrected vision, reported good general health and mental well-being, and had no history of psychiatric conditions or treatments (Nguyen & Zeng Reference Nguyen and Zeng2014). The experimental protocol was approved by the Concordia Human Research Ethics Committee. All sections of the experiment were performed in accordance with relevant guidelines and regulations. Informed consent was obtained from all participants.
Prior to the experiments, participants provided written informed consent. The procedure of the experiments was adapted from the modified figural Torrance Test of Creative Thinking (TTCT-F) (Torrance Reference Torrance1966). Each participant was presented with three creativity stimuli (trials) in the form of three incomplete sketches, and two 3-minute rest periods were provided between each sketch. Participants used a drawing tablet to complete the sketches. During each trial, they completed three tasks, including idea generation (IDG), where participants intuitively completed the given sketch based on their initial impression of it. In idea evolution (IDE), participants produced a second drawing that was substantially different from their initial one. Finally, in idea rating (IDR), participants evaluated the complexity and difficulty of both the idea generation and evolution phases using the NASA-TLX questionnaire (Hart & Staveland Reference Hart, Staveland, Hancock and Meshkati1988). Instructions for each stage were displayed via a graphical user interface, guiding participants through task execution and subsequent evaluations.
The tasks followed a loosely controlled, open-ended and self-paced framework, allowing participants up to 3 minutes per phase to complete the design process while maintaining their natural sketch–refine–evaluate rhythm. This approach, regulating only the sequence of design steps, preserved authentic behavior and minimized constraints that could distort cognitive dynamics. Intentionally adopted to balance structure and ecological validity, it reflects recursive theories of design creativity by allowing natural variation that captures the dynamic, feedback-driven nature of real-world design cognition – yielding more reliable and ecologically valid EEG data than traditional rigid paradigms (Jia & Zeng Reference Jia and Zeng2021).
Each participant completed a modified TTCT-F designed to simulate a full design micro-cycle of generation–evolution–evaluation. Unlike the classical TTCT-F, which focuses only on divergent sketch generation, our version incorporated two additional stages to capture iterative design dynamics. Each trial included these phases: First Rest (RST, 3 min), Idea Generation (IDG, ≤3 min), Idea Evolution (IDE, ≤3 min), Idea Rating (IDR, ≤3 min) and a Second Rest (3 min). Participants completed three such trials, each using a different visual prompt. This structure allowed us to emulate a compact yet complete cycle of creative ideation, development and evaluation within a controlled experimental setting.
EEG data were recorded using a 64-channel BrainVision actiCHamp system, following the 10–10 international system, with a sampling rate of 500 Hz. Preprocessing and artifact removal were performed using the Harvard Automated Processing Pipeline for Electroencephalography (HAPPE) and EEGLAB (Delorme & Makeig Reference Delorme and Makeig2004; Gabard-Durnam et al. Reference Gabard-Durnam2018). The EEG data were then segmented according to the creativity tasks – IDG, IDE, IDR – and the rest mode (RST). We used the preprocessed and segmented EEG signals in this study. Further details regarding the dataset, as well as the experiment protocol, can be found in (Nguyen & Zeng, Reference Nguyen and Zeng2014; Jia and Zeng, Reference Jia and Zeng2021; Soroush et al. Reference Soroush and Zeng2024).
In this study, the terms “cognitive states,” “cognitive classes,” “cognitive phases,” and “thinking modes” are used interchangeably to refer to the four phases of design creativity – idea generation (IDG), idea evolution (IDE), idea rating (IDR) and rest (RST) – as defined above in the experiment.
2.2. Recurrence quantification analysis (RQA)
Recurrence Quantification Analysis (RQA) provides detailed and quantitative information about the recurrence of states in the phase space (Eckmann et al. Reference Eckmann, Kamphorst and Ruelle1987; Zbilut & Webber Reference Zbilut and Webber1992; Marwan et al., Reference Marwan and Carmen Romano2007). Recurrence Plot (RP) represents a two-dimensional visualization of a time series at which a state of the dynamical system recurs. It is constructed from the time series data by embedding it into a phase space.
Given the signal $ x(t) $
, the
$ x(t) $
, the $ m $
-vector phase space
$ m $
-vector phase space $ \boldsymbol{X} $
is defined as
$ \boldsymbol{X} $
is defined as
 $$ \boldsymbol{X}(i)=\left[x(i),x\left(i+\tau \right),x\left(i+2\tau \right),\dots, x\left(i+\Big(m-1\right)\tau \right]\hskip0.6em ,\hskip0.72em i=1,2,\dots, N-\left(m-1\right)\tau $$
where $ N $
is the length of the signal,
$ N $
is the length of the signal, $ \tau $
is the time lag and
$ \tau $
is the time lag and $ m $
is the embedding dimension. These parameters are typically estimated through the mutual information and false nearest neighbor methods, respectively. Then, we can reconstruct RP, represented by the matrix
$ m $
is the embedding dimension. These parameters are typically estimated through the mutual information and false nearest neighbor methods, respectively. Then, we can reconstruct RP, represented by the matrix $ R $
defined as:
$ R $
defined as:
 $$ {R}_{ij}=\varTheta\;\left(\varepsilon -\left|\left|{\boldsymbol{X}}_i-{\boldsymbol{X}}_j\right|\right|\right) $$
where $ {\boldsymbol{X}}_i $
and
$ {\boldsymbol{X}}_i $
and $ {\boldsymbol{X}}_j $
are points in the phase space,
$ {\boldsymbol{X}}_j $
are points in the phase space, $ \varepsilon $
is the threshold distance and
$ \varepsilon $
is the threshold distance and $ \varTheta $
is the Heaviside step function. We can explore the signal’s recursive characteristics through the quantitative features extracted from its RP (Marwan et al., Reference Marwan and Carmen Romano2007). The features can be computed and extracted through a widely used toolbox (Marwan & Krämer Reference Marwan and Krämer2022). We used this well-established toolbox in the present study.
$ \varTheta $
is the Heaviside step function. We can explore the signal’s recursive characteristics through the quantitative features extracted from its RP (Marwan et al., Reference Marwan and Carmen Romano2007). The features can be computed and extracted through a widely used toolbox (Marwan & Krämer Reference Marwan and Krämer2022). We used this well-established toolbox in the present study.
RQA-based features, derived from recurrence patterns in recurrence plots (RPs), quantify the transient and stationary properties of EEG signals through measures of point density and the geometry of diagonal and vertical structures. We employed a set of well-established and widely used RQA metrics – Recurrence Rate (RR), Determinism (DET), Average and Longest Diagonal Line (L, Lmax), Entropy (ENTR), Laminarity (LAM), Trapping Time (TT), Longest Vertical Line (Vmax), Recurrence Times (T1, T2), Recurrence Time Entropy (RTENT), Clustering Coefficient (CLCO) and Transitivity (TRS) – as described in (Marwan et al., Reference Marwan and Carmen Romano2007; Marwan & Krämer Reference Marwan and Krämer2022).
Each measure quantifies a distinct aspect of recursive neural dynamics: RR reflects overall recurrence density, DET and L/Lmax capture temporal predictability, ENTR measures structural complexity, LAM, TT and Vmax represent stability and persistence, T1/T2 and RTENT describe recurrence timing and irregularity, and CLCO/TRS assess local and global recurrence organization. More details and the corresponding formulas for these features are provided in the Supplementary Materials.
Together, these features provide a comprehensive quantitative characterization of the brain’s complex recursive dynamics. Together, these features offer a detailed, multi-level characterization of brain dynamics, allowing precise discrimination between cognitive states based on their neural correlates.
2.3. Feature preprocessing
In this study, we implemented a rigorous feature preprocessing and selection pipeline to identify the most significant RQA features for classifying cognitive states. These selected features serve as significant neural markers of the cognitive states, further validated through statistical analyses and illustrated using brain topography maps.
2.3.1. Feature selection procedure
Given the high dimensionality of the dataset, our approach focused on reducing redundancy, improving class discrimination with acceptable computational efficiency.
The preprocessing pipeline began with outlier handling to ensure data quality and maintain class balance. Outliers were identified within each class as samples falling outside the range defined by the intersection of the z-score and interquartile criteria. These identified outliers were replaced using class-based interpolation. Next, z-score normalization was applied to standardize feature scales. Additionally, correlation analysis was conducted to identify and remove redundant features, reducing multicollinearity and simplifying the feature set. To enhance the relevance and discriminatory power of the feature set, mutual information analysis was performed to quantify the dependency between features and cognitive states’ labels. It ensures that only features with meaningful relationships to the target labels were included.
Sequential forward and backward feature selection (SFS and SBS) were then applied iteratively to further refine the feature set. These methods evaluated individual and combined contributions of features to classification performance. This comprehensive approach retained the most significant features while reducing dimensionality and improving classification performance and computational efficiency (Guyon & Elisseeff Reference Guyon and Elisseeff2003; Theodoridis & Koutroumbas Reference Theodoridis, Koutroumbas, Theodoridis and Koutroumbas2009c; Kalita, Bhattacharyya, & Roy Reference Kalita, Bhattacharyya, Roy, Kalita, Bhattacharyya and Roy2024).
2.3.2. Statistical analyses
To evaluate the effectiveness of our data preprocessing and feature selection pipeline, we validated the selected features using statistical tests, including t-tests and ANOVA. Class-wise t-tests (one-vs-all) were conducted to assess whether each feature exhibited significant differences across individual classes. Additionally, repeated measures ANOVA was employed to examine the effects of brain lobes, hemispheres and cognitive states while accounting for within-subject variability. Greenhouse–Geisser correction was applied to address violations of sphericity, and Bonferroni correction was used to control for multiple comparisons. Post hoc analyses were conducted using the Tukey–Kramer test, an extension of Tukey’s Honestly Significant Difference (HSD). For further details on statistical procedures, readers can refer to (King & Eckersley Reference King, Eckersley, King and Eckersley2019; Faizi & Alvi Reference Faizi, Alvi, Faizi and Alvi2023; MacKenzie Reference MacKenzie and MacKenzie2024). These analyses confirmed that the features were not only relevant for classification but also statistically significant in distinguishing cognitive states.
2.4. Classification models and evaluation
For the classification models, we employed a diverse set of algorithms, including k-nearest neighbor (KNN), multi-layer perceptron (MLP), support vector machine (SVM), Linear Discriminant Analysis (LDA), Naïve Bayes (NB) and random forest (RF). The selected features were fed into these models, and their performance was evaluated using multiple cross-validation approaches, including Hold-Out (HO), 10-Fold Cross-Validation (10F) and One-Subject-Out (OSO), to ensure robustness and generalizability. To comprehensively assess the performance of the classifiers, we utilized a range of evaluation metrics, including accuracy (ACC), recall (REC), specificity (SPC), kappa (KPA), precision (PRC) and F1-score (F1SC). These metrics provided a holistic understanding of the classification models’ effectiveness across various performance dimensions. For further methodological details about the classifiers and evaluation methods, readers are referred to (Theodoridis & Koutroumbas Reference Theodoridis, Koutroumbas, Theodoridis and Koutroumbas2009a,b; Kotu & Deshpande Reference Kotu, Deshpande, Kotu and Deshpande2019).
3. Results
We extracted recurrence plots (RPs) for all EEG channels using RQA. Figure 2 shows representative RPs from channel F3 (as an example) across the four cognitive states (IDG, IDE, IDR, RST), illustrating distinct visual recurrence patterns and neural dynamics of each state.

Figure 2. Recurrence plots (RPs) of the channel F3 across the four cognitive states of design creativity: (a) idea generation (IDG), (b) idea evolution (IDE), (c) idea rating (IDR) and (d) rest (RST).
As mentioned before, we computed the 13 proposed RQA features of the RPs from the preprocessed and clean EEG data using the RQA Toolbox (Marwan & Krämer Reference Marwan and Krämer2022). RQA was conducted using the following parameters (as suggested by the previous EEG-based studies) determined in our study as: time delay ( $ \tau $
) = 10 samples, embedding dimension (
$ \tau $
) = 10 samples, embedding dimension ( $ m $
) = 6, recurrence threshold (
$ m $
) = 6, recurrence threshold ( $ \varepsilon $
) adjusted to a constant value of 10% of the phase space diameter, with Euclidean distance norm. The Theiler window was set to 10 samples, corresponding approximately to the embedding delay, to avoid counting trivially correlated neighbors (Theiler Reference Theiler1986; Marwan et al., Reference Marwan and Carmen Romano2007). This setting ensures exclusion of temporally adjacent, autocorrelated points from recurrence detection. All RQA computations followed the default and recommended configurations of the MATLAB CRP Toolbox (Marwan & Krämer Reference Marwan and Krämer2022).
$ \varepsilon $
) adjusted to a constant value of 10% of the phase space diameter, with Euclidean distance norm. The Theiler window was set to 10 samples, corresponding approximately to the embedding delay, to avoid counting trivially correlated neighbors (Theiler Reference Theiler1986; Marwan et al., Reference Marwan and Carmen Romano2007). This setting ensures exclusion of temporally adjacent, autocorrelated points from recurrence detection. All RQA computations followed the default and recommended configurations of the MATLAB CRP Toolbox (Marwan & Krämer Reference Marwan and Krämer2022).
Because RQA is sensitive to its parameter settings, we conducted a sensitivity analysis for the main RQA parameters – embedding dimension, time delay and recurrence threshold. The results of this analysis are provided in Appendix A.
The features were extracted over overlapping time windows and averaged across each EEG segment to form a stable temporal profile for each cognitive state. These parameter values are consistent with standard practices in nonlinear time-series analysis (Marwan et al. Reference Marwan2002; Marwan et al., Reference Marwan and Carmen Romano2007; Marwan & Webber Reference Marwan, Webber and Marwan2015). The window length was 1000 time samples with 50% overlap between the windows. This aggregation approach, common in nonlinear signal analysis, reduces nonstationarity and enhances robustness, providing a reliable representation of the underlying brain dynamics.
To provide a deeper and clearer understanding of how the recursive neural patterns unfold during the design session – not only at the level of discrete task averages but also within each task over time – we included an illustrative figure in Appendix B. This example shows the temporal evolution of Determinism (DET) at channel F3 across the four cognitive states (IDG, IDE, IDR and RST) within a single trial.
After RQA features extraction, the proposed data preprocessing pipeline identified eight significant features. These features, ranked in Table 1 by their significance for cognitive state discrimination, are detailed with their corresponding EEG channels, brain lobes and hemispheres. Abbreviations in Table 1 include: Ch (EEG channels); A (Area or the brain lobes: Frontal [F], Temporal [T], Central [C], Parietal [P] and Occipital [O]); and H (hemispheres: Right [R] and Left [L]).
Table 1. Significant features identified by the suggested feature selection approach

Among the 13 types of extracted RQA features, six types were identified as significant: Determinism (DET), Recurrence Time Entropy (RTENT), Recurrence Rate (RR), Laminarity (LAM), Transitivity (TRS) and Trapping Time (TT). RTENT was identified in both P2 and CP1, while RR appeared in PO8 and AF4, indicating their repeated significance across channels. Other types of features appeared once.
RR (PO8 and AF4) reflects how often the system returns to similar states in its phase space, indicating repeated neural patterns at these channels. It captures recurrence density in right-hemisphere regions, highlighting differences in their recursion rates. RTENT (P2 and CP1) captures the irregularity of recurrence intervals, indicating how unpredictably neural states reoccur over time. It reflects recurrent patterns across hemispheres, linking right and left parietal dynamics.
DET (F3) reflects deterministic neural patterns distinguishing cognitive states. Higher DET means that the recursion pattern is more deterministic and predictable. LAM (C4) denotes laminar neural behavior, marking stable states. TRS (AF7) highlights recurrence transitions in the left frontal area, and TT (CP5) indicates sustained intra-state recursion, differentiating cognitive states.
The results demonstrate bilateral and regional contributions to cognitive state dynamics, indicating distinct recursive processes across creativity states. This supports the view that brain dynamics are inherently complex and recursive, making recursion a key neural marker of design creativity. These dominant features reveal distinct recursive dynamics across brain lobes and cognitive states, supporting our first and second hypotheses and highlighting the brain’s complex, state-dependent recursive behavior during design creativity.
Figure 3 displays box plots of the eight selected features across the four cognitive states (IDG, IDE, IDR and RST). The plots reveal clear differences in feature distributions and variability, confirming that these features effectively distinguish cognitive states and reflect their underlying neural dynamics. Medians are generally centered, indicating near-symmetric distributions, with slight skewness in IDG and IDR. Overall, the features separate IDG and IDE (divergent thinking) from IDR (evaluative thinking), where medians are consistently lower, and also distinguish RST from the active design states, highlighting distinct neural characteristics.

Figure 3. Box plots of the features derived from the proposed feature selection procedure, ranked as follows: (a) first (DET at F3), (b) second (RTENT at P2), (c) third (RR at PO8), (d) fourth (LAM at C4), (e) fifth (TRS at AF7), (f) sixth (RR at AF4), (g) seventh (TT at CP5) and (h) eighth (RTENT at CP1) most significant feature.
In the IDG state, most features show symmetric whiskers, while IDE exhibits narrower boxes and more symmetric distributions, except for LAM (C4) and RTENT (CP1). IDG and IDE share similar medians across most features, reflecting comparable neural dynamics typical of divergent thinking. Specifically, RTENT (P2) and RR (PO8, AF4) show nearly identical medians, reinforcing this similarity. In contrast, other features display distinct medians, indicating varying levels of recursive activity across channels. Overall, IDE shows narrower variability and greater stability than IDG, indicating a more organized stage of recursive brain activity.
The IDR state shows the widest box plots and whiskers, indicating the greatest variability in recursive dynamics during evaluation, with lower medians than IDG and IDE, reflecting distinct neural activity. In contrast, the RST state displays the shortest whiskers and narrowest IQRs, showing stable, uniform brain dynamics across participants and confirming that the resting condition was well controlled.
These results confirm that design creativity involves recursive, nonlinear brain dynamics (H1), that these dynamics differ across cognitive states and are distinguishable through RQA features (H2) and that these features effectively classify them (H3). The box plot analysis validates the recursive framework, supporting theoretical models that define design creativity as a fundamentally nonlinear and recursive cognitive process.
3.1. Statistical analysis
The selected features from the proposed pipeline were statistically validated, confirming their significance and effectiveness in distinguishing cognitive states and enhancing the interpretability of classification results.
3.1.1. Pair-wise comparisons
Pairwise comparisons between cognitive states were conducted using multiple t-tests. The statistically significant features identified through these comparisons are summarized in Table 2, along with their corresponding EEG channels, brain lobes and hemispheres. The table highlights key features that effectively differentiate cognitive states and includes detailed statistical metrics such as p-values, t-statistics and effect sizes (partial $ \eta 2 $
) to assess their significance.
$ \eta 2 $
) to assess their significance.
Table 2. Statistical analyses of the selected features using the pair-wise comparison

In this table, p-values are reported with four-digit precision and are mostly near zero, while consistently large effect sizes confirm the practical significance of the selected features. As the proposed feature selection procedure was designed to extract highly significant and discriminative features, the statistical analyses were expected to validate their relevance. For each pairwise comparison, significant features are ranked and presented accordingly.
The selected features effectively and significantly distinguish divergent (IDG, IDE) from evaluative (IDR) thinking modes. In both IDG versus IDR and IDE versus IDR comparisons, all eight features show very small p-values and large effect sizes across multiple brain lobes. IDR displays distinct brain dynamics from IDG and IDE, confirming that recursive neural activity differs across thinking modes and supporting the proposed hypotheses and theoretical models.
The features also distinguish active states (IDG, IDE, IDR) from rest (RST). Trapping Time (TT) in CP5 is significant across all comparisons (IDG versus RST, IDE versus RST, IDR versus RST), indicating it as a key marker of how long brain dynamics remain stable. Recurrence Time Entropy (RTENT) in P2 is significant in IDG versus RST and IDE versus RST, marking divergent thinking, while RTENT in P2 and CP1 is significant in IDE versus RST, confirming recurrence entropy as a critical marker distinguishing IDE from rest.
Recurrence Rate (RR) in AF4 and PO8 is significant in IDR versus RST, indicating that the frequency of recurrence patterns effectively differentiates the IDR state from the RST state. TT in CP5 also appears in both IDG versus RST and IDR versus RST comparisons, further supporting its effectiveness in distinguishing both idea generation and idea evaluation (rating) states from the rest state.
Across the three pairwise comparisons, significant features are distributed across both hemispheres. In IDG versus RST, frontal, parietal and central regions show significance. In IDE versus RST, significant features are located in the central and parietal regions. In IDR versus RST, significant features are found in frontal, centro-parietal and parieto-occipital regions.
In the IDG versus IDE comparison – both divergent thinking states – only TRS (AF7) and DET (F3), both in the left frontal lobe, were significant, underscoring the left hemisphere’s key role in differentiating these states. Changes in determinism (linear brain dynamics) and transitivity (recurrence network organization) serve as critical indicators distinguishing IDG from IDE.
TT (CP5) is significant in all pairwise comparisons except IDG versus IDE, marking it as a key feature for differentiating nondivergent states and highlighting recursive dynamics in the left central-parietal region. DET (F3) is significant in all comparisons except IDE versus RST and IDR versus RST, confirming its effectiveness in distinguishing most states. Together, these features show promise for efficient EEG-based classification of cognitive states.
RTENT (P2) is significant in nearly all comparisons except IDG versus IDE and IDR versus RST, making it another key neural marker. Across comparisons, TT (CP5), DET (F3) and RTENT (P2) emerge as the most significant discriminative features, representing recursive duration, determinism and entropy across brain regions. Their combination provides an effective representation of cognitive states in EEG-based analysis.
In all IDG comparisons, DET (F3) consistently distinguishes IDG, identifying left frontal determinism as a marker of idea generation. For IDR, RR (PO8), TT (CP5) and RR (AF4) are significant, linking recurrence rate and stable-state duration to evaluative thinking. In all RST comparisons, TT (CP5) remains significant, confirming its reliability in representing the rest state.
Table 2 confirms that all eight RQA-based features significantly differentiate cognitive states, effectively representing the neural correlates of design creativity. Recursive dynamics vary across divergent, evaluative and resting states, with TT (CP5), DET (F3) and RTENT (P2) emerging as key markers of stability, determinism and entropy. These findings validate the proposed RQA-based approach and support theoretical models describing design creativity as a complex, nonlinear and recursive cognitive process.
3.1.2. ANOVA
The ANOVA results (Table 3) confirmed that all eight RQA features were statistically significant across cognitive states (p ≤ 0.0000) with large effect sizes, reinforcing their reliability in distinguishing states. Bold-marked pairwise comparisons highlight key results, consistent with the t-test findings in Table 2. Together, Tables 2 and 3 provide a comprehensive view of the features’ statistical significance.
Table 3. Significant features were extracted through ANOVA for all the cognitive states

Determinism (DET) in F3 was highly significant in distinguishing IDG from IDE, IDR and RST, with consistently higher values in IDG, making it a strong biomarker for idea generation. Its elevated levels in both IDG and IDE compared to IDR reflect more dominant deterministic dynamics, effectively differentiating divergent (IDG, IDE) from the IDR thinking mode.
Recurrence Time Entropy (RTENT) in P2 was the most significant feature, strongly differentiating divergent (IDG, IDE) from IDR and RST, though it did not distinguish IDG from IDE or IDR from RST. Higher RTENT values in IDG and IDE suggest greater variability in recurrence dynamics, establishing it as a key marker of divergent thinking.
Recurrence Rate (RR) in PO8 was significantly lower in IDG and IDE compared to IDR, indicating more recursive dynamics in the IDR state. IDR also showed lower RR than RST, suggesting stronger recurrence patterns in evaluation thinking compared to rest. RR thus effectively distinguishes IDR from IDG, IDE and RST, reinforcing its role as a neural marker of evaluation thinking.
Laminarity (LAM) in C4 was significantly lower in IDR than in IDG and IDE, suggesting more stable recurrence patterns in divergent thinking compared to IDR.
Transitivity (TRS) in AF7 distinguished IDG from IDE and IDR, with higher TRS in IDG than in IDE, indicating more structured recurrence behavior during idea generation. TRS was also higher in IDR compared to IDG and IDE, reflecting reduced neural variability and more deterministic dynamics.
Recurrence Rate (RR) in AF4 effectively differentiated IDG and IDE from IDR, confirming its relevance in distinguishing divergent from IDR. The higher RR in IDR compared to RST suggests stronger and more dominant recursion.
Trapping Time (TT) in CP5 was significant in all comparisons except IDG versus IDE, indicating its strength as a marker for general cognitive state classification but not for differentiating between divergent thinking phases. Higher TT reflects prolonged periods where brain dynamics remain in the same state.
Recurrence Time Entropy (RTENT) in CP1 significantly distinguished IDG and IDE from IDR, reinforcing its value in differentiating divergent from IDR. Higher RTENT indicates greater variability in recursive neural activity.
These findings confirm that RQA features effectively classify cognitive states by capturing differences in recursion patterns between divergent thinking and IDR. The selected features serve as key neural markers, supporting EEG-based classification of design creativity cognitive states.
3.1.3. Repeated measures ANOVA
A 4 (Cognitive States: IDG, IDE, IDR, RST) × 5 (Brain Lobes: Frontal, Temporal, Central, Parietal, Occipital) × 2 (Hemispheres: Right, Left) repeated measures ANOVA revealed the following results:
For TT, a significant main effect of cognitive states was observed (p = 0.0039), indicating a medium effect size and meaningful differences across states. TT values were significantly lower during IDG compared to IDR (p = 0.0022) and RST (p = 0.0085).
The main effect of brain lobes was also significant (p = 0.009), suggesting modest variations among lobes. TT values in the parietal lobe were significantly higher than those in the occipital (p = 0.046) and temporal lobes (p = 0.073). A significant but weak Cognitive States × Brain Lobes interaction (p = 0.0036) indicated subtle dependencies between cognitive states and specific brain regions. Additionally, a significant main effect of hemisphere was observed (p = 0.0291), indicating medium-to-large hemispheric differences in TT values, with the left hemisphere showing significantly higher TT values (p = 0.037).
For DET, a significant main effect of brain lobes was identified (p = 0.0013), indicating a medium effect size and notable regional differences. DET values in the occipital lobe were significantly higher than those in the central lobe (p = 0.0093). Moreover, significant main effects of cognitive states were observed (p = 0.0023), indicating a medium effect size. DET values were significantly higher during IDG compared to IDR (p = 0.0002) and RST (p = 0.0013). DET values were significantly higher during IDE compared to IDR (p = 0.0179) and RST (p = 0.0065).
For RR, significant main effects of cognitive states (p = 0.002) were observed, reflecting medium-to-large task-related and modest regional variations in RR values. RR values were significantly higher during IDG compared to IDE (p = 0.0147) and RST (p = 0.0003). DET values were significantly lower during IDR compared to IDE (p = 0.0069) and RST (p = 0.0011).
For RTENT, a significant main effect of cognitive states was found (p = 0.0068), indicating a medium effect size. RTENT values were significantly higher during IDG compared to IDE (p = 0.0134), IDR (p = 0.0101) and RST (p = 0.0026). The main effect of brain lobes was also significant (p = 0.0011), reflecting moderate anatomical variability. RTENT values in the frontal lobe were significantly higher than those in the parietal (p = 0.0218) and temporal (p = 0.0096) lobes. A significant but relatively weak Cognitive States × Brain Lobes interaction was observed (p = 0.0062), pointing to subtle region-specific task effects.
The repeated measures ANOVA confirmed that key RQA features (TT, DET, RR and RTENT) reliably distinguish cognitive states, varying across brain regions and hemispheres with clear lateralization. These results validate the analysis pipeline, support recursive models of design cognition, validate our hypotheses and demonstrate the effectiveness of RQA-based EEG features for classifying design creativity states.
3.2. Classification
After validating the selected features statistically, we used the eight selected features to classify the EEG signals into the cognitive states (IDG, IDE, IDR, RST) using six models (MLP, KNN, SVM, LDA, NB and RF). Three cross-validation methods – hold-out (60% training, 40% testing), 10-fold and one-subject-out – were applied, and performance was evaluated using accuracy (ACC), recall (REC), specificity (SPC), kappa (KPA), precision (PRC) and F1-score (F1SC).
The SVM used a polynomial kernel (degree = 3, C = 1.0, γ = ‘scale’). The MLP included one hidden layer with six neurons and was trained using the Levenberg–Marquardt algorithm. The RF comprised 50 trees (max depth = 10). The NB used Gaussian probability functions, LDA assumed equal class priors and KNN employed K = 11 with Euclidean distance. The results across all classifiers are summarized in Tables 4–6.
Table 4. Classification performance (%) of cognitive states across the classifiers using hold-out cross-validation

Table 5. Classification performance (%) of cognitive states across the classifiers using 10-fold cross-validation

Table 6. Classification performance (%) of cognitive states across the classifiers in one-subject-out cross-validation

Under the hold-out cross-validation setting (Table 4), all classifiers achieved strong performance, with LDA achieving the highest accuracy (93.54%), F1-score (93.83%) and specificity (98.02%). NB and MLP also performed comparably, with accuracies of 92.98% and 92.77%, respectively. Across all classifiers, kappa scores remained consistently high, indicating that all classifiers performed reliably and their predictions were well-aligned with the true cognitive states.
In the 10-fold cross-validation setting (Table 5), overall performance improved slightly, suggesting enhanced stability across folds. LDA again yielded the highest accuracy (94.17%), followed closely by RF (93.82%) and MLP (93.52%). NB and LDA achieved the highest F1-scores (94.32% and 94.70%), with RF reporting the highest precision (97.21%) and specificity (98.09%). Standard deviations across metrics remained relatively low, indicating consistent classifier behavior across folds.
The most challenging setting, one-subject-out cross-validation (Table 6), introduced inter-subject variability but still showed robust performance. MLP and LDA achieved the highest accuracy (93.83%), with MLP also leading in F1-score (94.33%) and precision (98.44%). Despite high mean performance, increased standard deviations in the one-subject-out setting reflect inter-subject variability. Despite increased standard deviations, especially in recall and kappa, the overall classification performance remained high, underscoring the generalizability of the selected features.
The classification results showed consistently high performance across all models and validation methods, confirming that the selected RQA features are robust, generalizable markers for distinguishing cognitive states within and between participants. These findings validate the RQA-based approach and support the hypothesis that EEG recurrence patterns reliably reflect cognitive state transitions.
4. Discussion
The brain, as a complex system, on the edge of chaos (Bilder & Knudsen Reference Bilder and Knudsen2014), composed of interacting sub-components, exhibits key characteristics such as evolution and nonlinearity. These emerge from dynamic shifts in inter-component interactions and degrees of freedom, reflected in significant changes in recurrence metrics. The brain navigates through a complex set of attractors, dynamically altering its state by transitioning between basins of attraction and reshaping the attractors themselves. These attractors evolve over time, and the brain intermittently moves through different states defined by them. Each brain region may follow multiple attractors, giving rise to diverse recursive patterns across regions: some channels show more deterministic and periodic recurrence, while others display fast-paced, chaotic behavior. Information flow between components is complex, nonlinear and dynamically changing (Tononi, Edelman, & Sporns Reference Tononi, Edelman and Sporns1998; Sporns, Tononi, & Edelman Reference Sporns, Tononi and Edelman2000; Bullmore & Sporns Reference Bullmore and Sporns2009; Sporns Reference Sporns2022; Scharfen & Memmert Reference Scharfen and Memmert2024; Vignesh, He, & Banerjee Reference Vignesh, He and Banerjee2024).
These emergent and self-organized interactions enable higher-order cognitive abilities such as design and creativity. This underscores the rationale for neurocognitive studies grounded in nonlinear complex systems theory, seeking holistic and generalizable methods to uncover fundamental neural correlates and brain dynamics – beyond linear deterministic approaches that cannot represent the brain’s inherently complex nature.
This study provides empirical neurocognitive evidence consistent with recursive and nonlinear models of design creativity. Grounded in recursive and co-evolutionary design theory, we analyzed EEG signals across four phases of design cognition – idea generation, evolution, evaluation and rest – using Recurrence Quantification Analysis (RQA) and its comprehensive recurrence metrics. These metrics characterize how the brain transitions between states. We extracted the features that significantly differentiated cognitive states, supporting the hypothesized recursive nature of design cognition. The refined feature-selection pipeline yielded compact, discriminative neural markers that achieved strong classification performance, demonstrating RQA’s effectiveness in modeling and validating recursive neural mechanisms underlying design creativity.
4.1. Concepts and implications of the suggested features
In this study, we extracted 13 RQA features that capture key characteristics of brain activity – such as complexity, recurrence, irregularity and predictability – that are often missed by linear methods. Because RQA features are derived directly from the EEG phase space, they provide a fundamental representation of complex neural dynamics. By quantifying the geometry and temporal structure of trajectories within this reconstructed space, RQA effectively characterizes the nonlinear, recursive and self-organizing neural processes underlying design creativity. Using our proposed feature-selection pipeline, we identified the most significant recursion features. Table 7 summarizes these significant features (Determinism (DET), Recurrence Time Entropy (RTENT), Recurrence Rate (RR), Laminarity (LAM), Transitivity (TRS) and Trapping Time (TT)), their signal-level properties and their corresponding interpretations in relation to design cognition.
Table 7. Significant RQA features, their conceptual signal properties and corresponding design-cognition interpretations reflecting nonlinear recursive neural dynamics during creative design tasks

Our approach identified significant features across brain regions that effectively represent the neural characteristics of design creativity. The eight selected features showed strong statistical significance and high effect sizes, confirming that RQA can capture the recursive and chaotic dynamics of brain activity during creative processes. These feature-selection and statistical analysis results support Hypotheses 1 and 2.
Feature stability was evaluated using the Jaccard similarity coefficient across 10-fold cross-validation. A high mean Jaccard index demonstrated strong consistency in feature selection, confirming the robustness and reproducibility of the RQA-based feature subset and reinforcing the reliability of the proposed classification framework.
The selected features validate the ability of RQA-based measures to capture core aspects of design-related cognitive functioning. They represent six of the original 13 RQA metrics, reflecting the multidimensional nature of neural dynamics across cognitive states. The reduced subset indicates that these features retain the most discriminative and biologically meaningful information. Their statistical significance supports the hypothesis that transitions between creative and evaluative modes involve measurable changes in the brain’s temporal and structural recurrence properties.
Regarding the eight significant selected features associated with eight different channels (F3, P2, PO8, C4, AF7, AF4, CP5 and CP1), it is worth noting that each channel can be linked to established large-scale brain networks involved in creative and design cognition. The left frontal sites (F3, AF7) correspond to the Executive Control Network (ECN), supporting goal-directed reasoning, planning and evaluative processing during idea evolution and rating (Niendam et al. Reference Niendam2012). The right frontal site (AF4) reflects dynamic coupling between the ECN and the Default Mode Network (DMN), facilitating cognitive flexibility and switching between divergent and convergent modes of thinking (Beaty & Jung Reference Beaty, Jung, Christoff and Kieran2018; Marron et al. Reference Marron2018; Beaty, Seli, & Schacter Reference Beaty, Seli and Schacter2019; Lloyd-Cox, Chen, & Beaty Reference Lloyd-Cox, Chen and Beaty2022). The channels (P2, PO8, CP1 and CP5) are linked to the Dorsal Attention Network (DAN) and Frontoparietal Control Network (FPCN), integrating visuospatial processing, associative thinking and visual imagination – key mechanisms during idea generation and evolution (Corbetta & Shulman Reference Corbetta and Shulman2002; Benedek et al. Reference Benedek2014; Fink & Benedek Reference Fink and Benedek2014; Beaty et al. Reference Beaty2016; Rominger et al. Reference Rominger2018, Reference Rominger2022). The channel (C4) lies over the right sensorimotor cortex and is part of the Sensorimotor Network, which supports embodied cognition and mental sketching during idea generation and evolution, as well as the evaluation phase (Jeannerod Reference Jeannerod2001; Fink & Neubauer Reference Fink and Neubauer2008; Li, Zhang, & Wang Reference Li, Zhang and Wang2017). Collectively, these distributed activations demonstrate recursive coordination among executive, attentional and sensorimotor systems underlying the distinct cognitive states of design creativity approved by the previous studies (Beaty et al. Reference Beaty2014; Fink & Benedek Reference Fink and Benedek2014; Beaty et al. Reference Beaty, Seli and Schacter2019; Rominger et al. Reference Rominger2020; Patil et al. Reference Patil2021).
Although these features are not easily interpreted from a neurophysiological perspective, they can be effectively described using concepts from complex systems theory. The selected features represent key aspects of brain dynamics: DET captures the degree of structure and predictability in recurrence dynamics; RTENT reflects the complexity and irregularity of recurrence patterns; RR indicates the density of recurrent brain states; LAM characterizes the duration of stable, unchanging states; TRS describes the global structural organization of recurrence; and TT represents the average time the system remains in a specific state. These features were significant across different brain regions and EEG channels, reflecting the brain’s highly complex dynamics. As mentioned, the brain can be characterized by interactions among its subcomponents and degrees of freedom. Greater complexity is associated with increased interactions between neural elements, leading to chaotic responses, reflected in higher entropy and lower determinism. A larger number of interacting neural components increases both the system’s degrees of freedom and recurrence between states, captured by higher RR. Laminarity reflects dominant, steady-state dynamics persisting over time.
4.2. RQA features as neural markers of design creativity states
To further interpret brain dynamics across cognitive states, we performed topographic analysis of all 13 RQA features. As shown in Figure 4, scalp maps generated in EEGLAB (Delorme & Makeig Reference Delorme and Makeig2004) illustrate the spatial distribution of each feature across brain regions for all cognitive tasks, enabling deeper insight into feature characteristics. All topographic maps were plotted using a fixed color scale ranging from 0 (blue) to 1 (red) for direct comparison across cognitive states. These maps provide complementary insights beyond previous analyses, revealing how neural activity patterns vary across states. This section validates hypotheses H1 and H2.

Figure 4. Topography maps of the 13 proposed RQA features (represented in the rows) of the cognitive states, including (a) IDG, (b) IDE, (c) IDR and (d) RST (represented in the columns).
While some features, such as L, Lmax, T1 and T2, exhibited approximately consistent patterns across brain lobes and cognitive states, others demonstrated distinct spatial variations. In particular, TT, RTENT and DET revealed meaningful differences in brain activity, offering valuable information about the state-dependent and region-specific nature of neural dynamics. Further interpretation of these patterns is provided in the following sections.
As indicated in the statistical analysis, Trapping Time (TT) showed a significant main effect of brain lobes, with higher TT in the parietal than temporal regions, and a significant hemispheric effect with greater TT in the left hemisphere. Determinism (DET) was significantly higher in the occipital than the central lobe, while Recurrence Time Entropy (RTENT) exhibited higher values in the frontal lobe compared to parietal and temporal lobes. These findings further validate the significance and regional sensitivity of the selected features.
Eight significant features were identified from six RQA-based metrics: DET, RTENT, RR, LAM, TRS and TT. Features like TT, DET and RTENT exhibit significant variations in specific brain regions, confirming their relevance in capturing state-dependent dynamics. However, closer inspection of topography maps reveals that not all features show discriminative spatial patterns across cognitive states. Features such as L, Lmax, T1 and T2 exhibit similar topographic distributions across brain lobes in all cognitive states, suggesting limited sensitivity to task-related dynamics.
The RR topography shows distinct differences across all lobes except the central region, likely due to sensorimotor stability. Notably, the left frontal region displays elevated RR in IDG and IDE, compared to lower values in IDR and especially RST. This elevated recurrence may reflect higher complexity and interaction among neural processes, consistent with greater freedom and variability in cognitive processing during ideation phases.
Transitivity (TRS), another significant feature, shows discriminative topographic patterns across cognitive states. As an indicator of geometric regularity and dimensionality in phase space, TRS reflects whether neural dynamics are structured and low-dimensional or complex and high-dimensional. The topographies reveal clear variations in the parietal, left parieto-occipital, left frontal and central regions across tasks. Lower TRS values in frontal and parietal regions during ideation (IDG, IDE) suggest more chaotic dynamics, with IDE showing more uniform patterns, while IDG and IDR display greater spatial complexity. In contrast, RST shows higher TRS in the frontal lobe, indicating more deterministic neural activity.
T1, T2 and TT quantify vertical line structures in recurrence plots, indexing periods of laminar or stable brain states. Although related, they differ in scope, sensitivity and interpretation. T1 reflects the time to the next recurrence, including adjacent points, making it highly sensitive to short, noise-driven fluctuations. T2 excludes adjacent recurrences, yielding a less biased estimate of true recurrence intervals. TT provides a more global and robust measure by averaging longer stable-state durations and excluding very short lines, capturing sustained recursive neural dynamics and the overall rhythm of neural state transitions.
This contrast suggests that cognitive modulation occurs more at the network level than within local recurrence structures. While individual regions maintain stable timing patterns (T1, T2), TT reflects their dynamic interactions across states. This distinction underscores the importance of including global RQA features in EEG analysis. TT emerges as a functionally and spatially informative measure, capable of detecting large-scale, cognitive state-dependent variations in brain dynamics that local features cannot, making it a valuable marker for understanding temporal brain organization during cognitive transitions. This finding provides a detailed and deeper understanding of the brain’s recursive dynamics across the cognitive states.
The distinct behavior of TT relative to T1 and T2 provides empirical support for the brain’s complex, nonlinear and nonstationary nature. While T1 and T2 remained stable across tasks – reflecting local, low-dimensional dynamics – TT captured task-specific, regionally distributed reconfigurations, demonstrating that cognitive engagement involves global, context-dependent changes. These findings emphasize that brain function cannot be fully explained by localized, static measures alone.
This dissociation highlights the limitations of reductionist, linear models that isolate individual regions and ignore system-level dynamics. Instead, it supports a holistic perspective, where cognition emerges from dynamic, context-sensitive interactions across distributed neural systems. Ultimately, our results demonstrate the importance of global, nonlinear metrics like TT for capturing the brain’s full functional complexity.
Our results revealed that LAM and TT are two significant features that effectively distinguish cognitive states, each capturing complementary aspects of recursive brain dynamics. Both metrics quantify vertical structures in recurrence plots, reflecting laminar brain activity. LAM indicates how frequently the system enters similar stable states, while TT measures how long it remains in them and captures the duration. Our results validate these two features and indicate that both frequency and duration of recursion in similar stable states are important.
In addition, regarding the determinism measures, it should be noted that, unlike L and Lmax, DET was reported to be a significant feature. DET measures the proportion of recurrence points forming diagonal lines, indicating the frequency of deterministic patterns. L measures the average length of diagonal lines, reflecting how long predictable sequences last on average. Lmax, the maximum length of diagonal lines, represents the longest single sequence of deterministic behavior. It shows that the frequency of the occurrence of deterministic dynamics in a recursive behavior is more significant than the length of deterministic dynamics.
In summary, the results validate our hypotheses and support models describing design creativity as a complex, recursive and nonlinear neurocognitive process. The selected features capture distinct dynamical patterns across brain regions. These findings provide novel insights into the neural mechanisms of design cognition and demonstrate the effectiveness of RQA for modeling recursive brain dynamics during creative tasks.
4.3. RQA feature-based cognitive state recognition
The classification results demonstrate the strong discriminative power and robustness of the RQA-based EEG features in identifying cognitive states associated with design creativity. Across all three validation strategies – hold-out, 10-fold cross-validation and one-subject-out – the classifiers achieved consistently high performance, confirming the generalizability of the proposed features. Each cognitive state (IDG, IDE and IDR) included 84 samples, and the rest mode 56 samples, representing a mild imbalance addressed through stratified cross-validation and balanced performance metrics.
We employed a diverse set of classifiers to capture the varying patterns and complexities within the EEG data, ensuring a robust and comprehensive evaluation of class discrimination. KNN and LDA address simple, distance-based and linear modeling, respectively, while MLP and SVM capture complex, nonlinear relationships – MLP through neural networks and SVM via optimal decision boundaries in multi-dimensional spaces. Naïve Bayes offers a probabilistic, interpretable framework and Random Forest handles nonlinearity through ensemble learning and feature importance assessment. This combination covers a spectrum of modeling strategies.
Our cross-validation strategy integrates hold-out, k-fold and one-subject-out methods to ensure precise and reliable evaluation of classifier performance. Hold-out validation provides a quick performance estimate but may overlook variability in smaller datasets. K-fold cross-validation mitigates this by balancing bias and variance through repeated training and testing on multiple data splits. One-subject-out validation tests model generalizability across individuals, addressing inter-subject variability. This multi-method approach enhances the robustness and real-world applicability of our findings, effectively handling dataset variability and subject-specific challenges inherent in EEG classification.
We employed a comprehensive set of evaluation metrics – accuracy, recall, specificity, precision, kappa and F1-score – to ensure a holistic and precise assessment of classifier performance. Accuracy provides an overall measure of correctness but can be biased in imbalanced datasets. Recall evaluates the model’s ability to correctly identify positive instances, critical for minimizing false negatives, while specificity complements this by assessing correct classification of negative instances. Precision focuses on the reliability of positive predictions, and the F1-score balances precision and recall to offer a unified metric for imbalanced datasets. Kappa further strengthens our evaluation by accounting for random agreement, providing a robust measure of performance. This multi-metric approach allows us to capture diverse aspects of model performance, from sensitivity and specificity to overall reliability, ensuring a comprehensive evaluation. By integrating these metrics, our methodology offers a precise and logical framework for evaluating classifiers, addressing both class-specific performance and overall robustness.
Among the models, Linear Discriminant Analysis (LDA) consistently achieved the highest accuracy and kappa scores across all schemes, including 94.17% accuracy and 92.27% kappa in 10-fold cross-validation and 93.83% accuracy in the one-subject-out approach. This performance highlights LDA’s effectiveness in handling linearly separable, low-dimensional feature spaces. Naïve Bayes (NB) also performed well due to its simplicity and speed, though its assumption of feature independence may have limited its performance in the presence of moderately correlated features. Multilayer Perceptron (MLP) demonstrated strong results by capturing nonlinear interdependencies. K-Nearest Neighbors (KNN) and Random Forest (RF) also showed competitive accuracy, benefiting from their capacity to model local structures and nonlinear relationships, respectively. Support Vector Machine (SVM) performed slightly lower, likely due to overfitting risks or kernel sensitivity, as the moderately linear nature of the feature space did not require complex decision boundaries.
Across all classifiers, the consistent performance of LDA, MLP and NB underscores the value of combining interpretable and nonlinear models to leverage both linear separability and feature interactions. The superior performance of LDA highlights the linear separability of the selected RQA-based features and emphasizes the practicality of using efficient, interpretable models for cognitive state classification. These features not only show strong discriminative power but also exhibit structured distributions across classes, enabling simple classifiers like LDA to achieve high accuracy with low computational cost. Compared to complex models, linear classifiers require less tuning, train faster, reduce overfitting risk and offer greater transparency, which is critical for understanding neural mechanisms.
The structured nature of the proposed features thus supports their use in scalable, real-world EEG-based systems, validating Hypothesis 3 (H3) on the effectiveness of the approach for cognitive state recognition. These results also validate Hypothesis 2 (H2), confirming that significant RQA features can effectively distinguish between cognitive states of design creativity. Furthermore, they highlight the utility of integrating diverse RQA metrics to model the nonlinear, dynamic nature of cognitive processing.
We employed a simple yet effective classifier fusion method based on majority voting to enhance classification performance and assess the effectiveness of combining multiple models. This combination also highlights the capability of the proposed classifiers. The results of this approach are presented in Table 8.
Table 8. Classification performance (%) of cognitive states using majority voting fusion across classifiers

Note: The first column indicates the cross-validation (CV) methods: HO (Hold-Out), 10F (10-Fold Cross-Validation) and OSO (One-Subject-Out).
The classification results obtained through majority voting fusion demonstrate an improvement in performance across all validation methods, confirming the advantage of combining multiple classifiers to enhance decision robustness. However, our statistical analysis shows that these performance metrics in majority voting fusion are not significantly different from the LDA’s results, which showed the highest classification performances.
In the hold-out validation, the fused model achieved an accuracy of 94.12%, outperforming individual classifiers, with a high F1-score (94.81%) and precision (98.38%), indicating a strong balance between sensitivity and specificity. The fusion approach was particularly effective under 10-fold cross-validation, where it reached 96.23% accuracy and a kappa score of 93.56%, the highest among all tested conditions. This improvement suggests that the integration of diverse decision boundaries from multiple classifiers helps to generalize better across data subsets, reducing the impact of individual model biases and variance.
In the one-subject-out validation – known for its difficulty due to inter-subject variability – the fused model still maintained strong performance (93.19% accuracy and 91.20% kappa), demonstrating its robust generalizability across participants. These results validate the effectiveness of classifier fusion for EEG-based cognitive state classification, as it leverages the strengths of both linear and nonlinear models, combining the interpretability of models like LDA and NB with the adaptability of MLP, RF and SVM.
Overall, the ensemble approach enhances the stability, accuracy and reliability of the classification system, making it more suitable for real-world and subject-independent applications. The performance gains across all metrics further support the value of RQA-based features when used within a multi-classifier fusion framework, offering a practical path toward robust and scalable EEG-based cognitive state recognition.
Table 9 presents the classification performance of EEG power spectrum features across major frequency sub-bands (delta, theta, alpha, beta and gamma) using multiple cross-validation strategies. The results show that spectral features achieve high classification accuracy, with the best performance obtained under the 10-Fold CV scheme. The results demonstrate that frequency-domain features are highly capable and effective in distinguishing cognitive states of design creativity. However, when compared with the RQA-based nonlinear features, their overall performance is slightly lower, indicating that while spectral features capture important oscillatory information, the RQA features provide a richer and more discriminative representation of the brain’s recursive and nonlinear dynamics.
Table 9. Classification performance (%) of cognitive states based on EEG power spectrum features across frequency sub-bands (delta, theta, alpha, beta and gamma)

Note: The first column indicates the cross-validation (CV) methods: HO (Hold-Out), 10F (10-Fold Cross-Validation) and OSO (One-Subject-Out).
This study does not include a direct comparison with traditional linear EEG analyses, as the goal was to introduce and evaluate a reliable, theoretically grounded RQA-based framework consistent with recursive and nonlinear models of design creativity. While linear spectrum methods effectively represent brain dynamics, they are deterministic and not conceptually aligned with the recursive and self-organizing nature of design cognition. The proposed RQA-based approach offers a novel, theory-driven method capturing the nonlinear and dynamic properties of creative brain activity, validated through statistical, machine learning and theoretical analyses.
4.4. Computational complexity
All analyses were conducted on a desktop with a 12th Gen Intel® Core™ i7-12700K (3.6 GHz, 12 cores) and 32 GB RAM, using MATLAB R2023a. Feature calculation and selection for each trial were completed in 50.38 ± 3.64 seconds per EEG trial, while classification inference took 97.47 ± 8.99 milliseconds per sample. As reported, eight features were identified as significant. When using only these features, the process required 1.46 ± 0.19 seconds per EEG trial, EEG data from 28 participants (three trials each and 64 channels at 500 Hz) covered idea generation, evolution, rating and two rest phases. Due to the self-paced nature of the task, signal lengths varied across participants. To assess computational efficiency, we compared the processing time for feature extraction, selection and classification. Of the 13 types of RQA features, six types of features (DET, RTENT, RR, LAM, TT and TRS) were reported as important, resulting finally to 8 significant features extracted from 8 EEG channels.
These eight significant features were retained, improving computational efficiency while preserving their discriminative and representative power. Although feature selection reduced the processing time per trial effectively, this remains computationally demanding for real-time, transient neural dynamics analysis, EEG processing and in brain–computer interface or neurofeedback applications. Real-time design-creativity monitoring requires minimal latency, so further optimization would be necessary to adapt and enhance the proposed framework.
The entire process of feature calculation, selection, model training and cross-validation was completed in under 3 hours, indicating that the proposed features are computationally intensive. While the features effectively capture brain dynamics in design creativity, future studies could focus on developing more computationally efficient yet equally effective features to enhance the feasibility of large-scale EEG analysis. Future studies can also work on sampling and windowing approaches to address the computation cost.
Figure 5a–c present classification performance metrics, including Accuracy, Kappa, F1 Score, Precision, Recall and Specificity, across three validation strategies: a) Hold-Out (HO), b) 10-Fold Cross-Validation and c) One-Subject-Out (OSO). The plots show that performance generally improves with the number of included features, highlighting the impact of feature subset size on classification outcomes and demonstrating the robustness of the fusion approach.

Figure 5. Classification performance of the majority voting fusion model across increasing numbers of included RQA features (1–8), evaluated using (a) Hold-Out, (b) 10-Fold Cross-Validation, (c) One-Subject-Out validation methods and (d) the associated processing times (mean $ \pm $
std).
$ \pm $
std).
10-Fold Cross-Validation (Figure 5b) consistently yields the highest and most stable performance, indicating strong generalization across data splits. Hold-Out validation (Figure 5a) shows slightly lower but still competitive performance, with moderate variability due to its single train-test partition. One-Subject-Out (Figure 5c), the most challenging strategy, results in the lowest and most variable performance due to inter-subject differences but remains valuable for assessing generalization to unseen individuals in EEG-based systems. This comparison underscores the trade-off between validation rigor and classification accuracy, affirming the robustness of 10-Fold CV and the real-world relevance of OSO.
Figure 5d shows the average processing time per trial as a function of the number of included features. The x-axis represents the number of features considered for classification; the y-axis shows mean processing time (seconds). Error bars indicate standard deviation across trials. Processing time increases almost monotonically with feature count, revealing the computational cost of feature expansion. This trade-off informs the selection of an optimal feature set based on the balance between classification performance and computational efficiency.
4.5. Implications for future research
The proposed RQA-based EEG framework provides a quantitatively robust and theoretically grounded method for characterizing brain dynamics in design creativity. By capturing recursive and nonlinear neural processes aligned with design cognition theories, it enables direct recognition of cognitive states through distinctive recurrence patterns associated with divergent and convergent thinking.
This study extends beyond academic relevance by demonstrating practical applications of the proposed framework. The identified dynamic neural markers can enable brain monitoring, support adaptive creativity tools that respond to shifts in cognitive state and inform neurofeedback-based applications in brain–computer interfaces and design education.
The significant recurrence features identified in this study offer strong potential for advancing future design research. Their novelty, effectiveness and demonstrated discriminative power make them well-suited for practical applications, particularly in two concrete domains. First, these features can support adaptive neurofeedback during design sessions: moment-to-moment fluctuations in recurrence-based metrics can reveal shifts in cognitive state, enabling intelligent systems to deliver real-time, state-contingent prompts that help designers reframe problems, regulate cognitive load, sustain exploratory thinking, or transition more effectively between divergent and convergent phases – ultimately improving the quality and efficiency of the design process. Second, these features provide a quantitative basis for differentiating expert and novice designers. Differences in the temporal organization of recurrence features may reflect distinct cognitive strategies, levels of fluency, or patterns of attentional control, offering valuable insights for design education, assessment and skill-development interventions.
This study introduces a novel RQA-based framework for characterizing brain dynamics beyond classical EEG markers. The proposed features provide informative representations of neural correlates underlying the design creativity cognitive states, capturing the nonlinear, recursive and temporally evolving dynamics of creative cognition. Unlike conventional linear or frequency-based methods, RQA quantifies complexity, irregularity and recurrence, offering a quantitative and interpretable link between brain activity and design creativity. These features serve as new EEG-based biomarkers, establishing a foundation for future nonlinear and recurrence-based EEG research.
Beyond improving classification performance, the identified RQA features provide meaningful insights into brain function, with consistent associations observed across specific brain regions. This not only strengthens their interpretability but also suggests promising applications in the study of creative cognition. Additionally, the robustness and adaptability of the proposed analytical pipeline highlight its potential for broader use in other domains.
The results suggest that integrating nonlinear methods like RQA with conventional EEG analyses can provide a more comprehensive view of the brain’s behavior during creative cognition, addressing the limitations of frequency-domain approaches. Further nonlinear techniques – such as EEG phase space reconstruction, entropy measures and the Hurst exponent – may uncover additional facets of brain complexity and irregularity. Exploring these features could open new directions in understanding the neural basis of the aforementioned cognitive states of design and creativity.
Importantly, EEG data were collected in a loosely controlled experimental setting, which reduced constraints and stress commonly imposed by strict experimental designs. This approach led to more ecologically valid and realistic results, offering deeper insights into natural cognitive processing. The potential benefits of such loosely controlled paradigms should be further considered in future research.
4.6. Limitations and future work
This study demonstrates that the proposed RQA-based EEG framework effectively captures the complex, nonlinear and recursive brain dynamics underlying design creativity, achieving strong and statistically significant classification performance. While the approach successfully validated key hypotheses, its generalizability, interpretability and broader applicability remain open for future investigation.
This exploratory study involved 28 right-handed engineering graduate students performing a single task variant, limiting generalizability. The homogeneous sample and narrow design define key boundaries of this work. Future research should examine how RQA-based EEG features generalize across different ages, cultures, expertise levels and creative or cognitive profiles by recruiting larger and more diverse samples. Incorporating psychometric and cognitive style measures could further clarify how neural complexity relates to creative traits, cognitive load and design expertise. The participant sample was gender-imbalanced, which may have influenced neural variability. Future studies should therefore consider gender-related effects.
Potential confounding factors, such as participant fatigue and differences in design expertise, may have influenced the observed neural responses. However, the experimental paradigm used in this study is well established and its validity has been verified in several prior studies from different methodological and cognitive perspectives. Nonetheless, future research should further control or model these variables to strengthen the robustness and generalizability of the findings.
This study employs a modified TTCT-F paradigm that simulates a single cycle of the design process. While it captures essential aspects of design creativity – such as idea generation, evolution and evaluation – it remains a simplified representation rather than a fully longitudinal design process.
While this approach revealed important insights into creative brain dynamics, a limitation remains regarding the direct neurophysiological interpretation of RQA features. Future research should explore the biological mechanisms underlying the recursive properties captured by RQA to enhance the physiological interpretability and theoretical integration of these measures.
Expanding the analytical framework to incorporate additional measures – such as EEG-based complex network metrics or connectivity indices – could enhance the differentiation of cognitive states. Integrating advanced machine learning classifiers would further improve pattern recognition and potentially enable real-time applications. Moreover, combining EEG with complementary biosignals in ecologically valid yet controlled settings could offer a more comprehensive understanding of the neural, behavioral and physiological mechanisms underlying creative design.
The method is computationally intensive (Frilot et al. Reference Frilot, Webber and Marwan2015; Marwan & Webber Reference Marwan, Webber and Marwan2015), so improving efficiency is essential. Exploring alternative approaches – such as EEG phase-space or Poincaré intersection analyses – or optimized computation could better capture recursive neural dynamics at lower cost. Although our framework is relatively time-efficient with strong performance, future work should assess its suitability for real-time brain–computer interface applications, where low latency and interpretability are critical.
The findings are consistent with and supportive of recursive and nonlinear theories of design creativity, rather than serving as direct validation of any specific theoretical model. While the observed neural dynamics align with the recursive principles proposed in the theories, future work should operationalize and test model-specific predictions to enable formal theoretical validation.
Addressing the outlined questions and limitations will help refine the proposed framework, improve generalizability and expand its applicability to real-world settings.
5. Conclusion
This study introduced a robust EEG-based framework employing Recurrence Quantification Analysis (RQA) to investigate the nonlinear and recursive brain dynamics underlying the cognitive states of design creativity. Using a reliable dataset derived from loosely controlled design tasks adapted from the modified Torrance Test of Creative Thinking (TTCT-F), the approach ensured ecological validity while capturing the dynamic transitions across idea generation, evolution, evaluation and rest.
The extracted RQA features effectively reflected complex neural behaviors such as recurrence, determinism and temporal unpredictability, revealing distinct activation patterns across frontal, temporal and parietal regions. Topographic analyses provided novel insights into the neural organization of creative cognition. The results were consistent with recursive and co-evolutionary models of design cognition, offering empirical support rather than direct theoretical validation and bridging the gap between conceptual models and experimental evidence.
Comprehensive statistical validation, EEG topography and high classification performance across multiple cross-validation strategies confirmed the robustness, discriminative power and generalizability of the proposed framework. This work advances understanding of creative brain dynamics and establishes a foundation for future research in cognitive neuroscience, neurodesign, brain–computer interfaces and creativity-support systems.
Supplementary Material
The supplementary material for this article can be found at http://doi.org/10.1017/dsj.2026.10050.
Financial Support
This work was supported by NSERC Discovery Grant (Grant Number RGPIN-2019-07048), NSERC CRD Project (Grant Number CRDPJ514052–17) and NSERC Design Chairs Program (Grant Number CDEPJ 485989–14).
Author Contributions
MZS wrote the draft of the paper, conducted the literature search, performed analyses, reviewed and edited the manuscript. YZ conceptualized, supervised and managed the project and contributed to writing, reviewing and editing the manuscript.
Competing interests
The authors declare none.
Artificial Intelligence (AI) Tools Declaration
AI tools were employed to correct grammatical errors and enhance manuscript readability, but were not utilized in the paper content generation.
Appendix A – Sensitivity analysis
In this study, we examined the recursive neural dynamics underlying four cognitive states of design creativity – Idea Generation (IDG), Idea Evolution (IDE), Idea Rating (IDR) and Rest (RST) – using EEG and Recurrence Quantification Analysis (RQA). We identified eight significant features, including Determinism (DET at F3), Laminarity (LAM at C4) and Trapping Time (TT at CP5), as well as Recurrence Rate (RR at PO8 and AF4), Recurrence Time Entropy (RTENT at P2 and CP1) and Transitivity (TRS at AF7).
RQA is inherently sensitive to parameter selection and it is important to perform sensitivity analysis. The embedding dimension (m), time delay (τ) and recurrence threshold (ε), as the main parameters, shape the geometry and density of recurrence points, which directly influence the diagonal, vertical and network structures used to compute RQA features.
To ensure the robustness of these findings, we performed a parameter-sensitivity analysis on the three key RQA parameters – embedding dimension (m), time delay (τ) and threshold (ε) – using the baseline values. For each parameter, we applied small perturbations (m₀ ± 1, τ₀ ± 10% and ε ± 10%) and quantified the maximum absolute percentage deviation across the four tasks (IDG, IDE, IDR and RST) relative to baseline.
Table A1. Sensitivity (%) of the identified significant recurrence features to embedding dimension, time delay and threshold parameters

Table A1 summarizes the results of the sensitivity analysis across all significant recurrence features and cognitive states. The values indicate that the eight features remain stable under reasonable variations of the embedding dimension, time delay and threshold parameters. Deviations generally fall within the 4–8% range, with slightly higher sensitivity observed for threshold perturbations (ε ± 10%), which aligns with the direct role of ε in controlling recurrence density. Embedding-dimension adjustments (m ± 1) produced moderate fluctuations, particularly for line-based features such as DET, LAM and TT, while time-delay variations (τ ± 10%) resulted in comparatively smaller changes. Importantly, none of the parameter adjustments altered the qualitative distinctions among the four cognitive states, confirming that the nonlinear patterns reported in the main analysis are robust to typical variations in RQA parameterization.
Appendix B – An illustrative example for visual exploration: Temporal evolution of a recursive feature (DET at F3) across cognitive states
Figure B1 illustrates, as an example, the temporal evolution of Determinism (DET) at channel F3 across the four cognitive states (IDG, IDE, IDR and RST) within a single trial. The horizontal axis represents normalized time (0–100% for each task segment), and the vertical axis shows the normalized DET feature value. Normalizing both time and feature values highlights the relative changes, making trajectories across states comparable and visually interpretable. This exploratory visualization is intended to provide a clear and intuitive view of how nonlinear/recursive patterns unfold within and across task segments, complementing the main results based on discrete state averages. This graph aims to provide a deeper and clearer understanding of how the recursive neural patterns unfold during the design session.

Figure B1. Illustrative example of the temporal evolution of Determinism (DET) at channel F3 across the four cognitive states – Idea Generation (IDG), Idea Evolution (IDE), Idea Rating (IDR) and Rest (RST) – within a single trial.
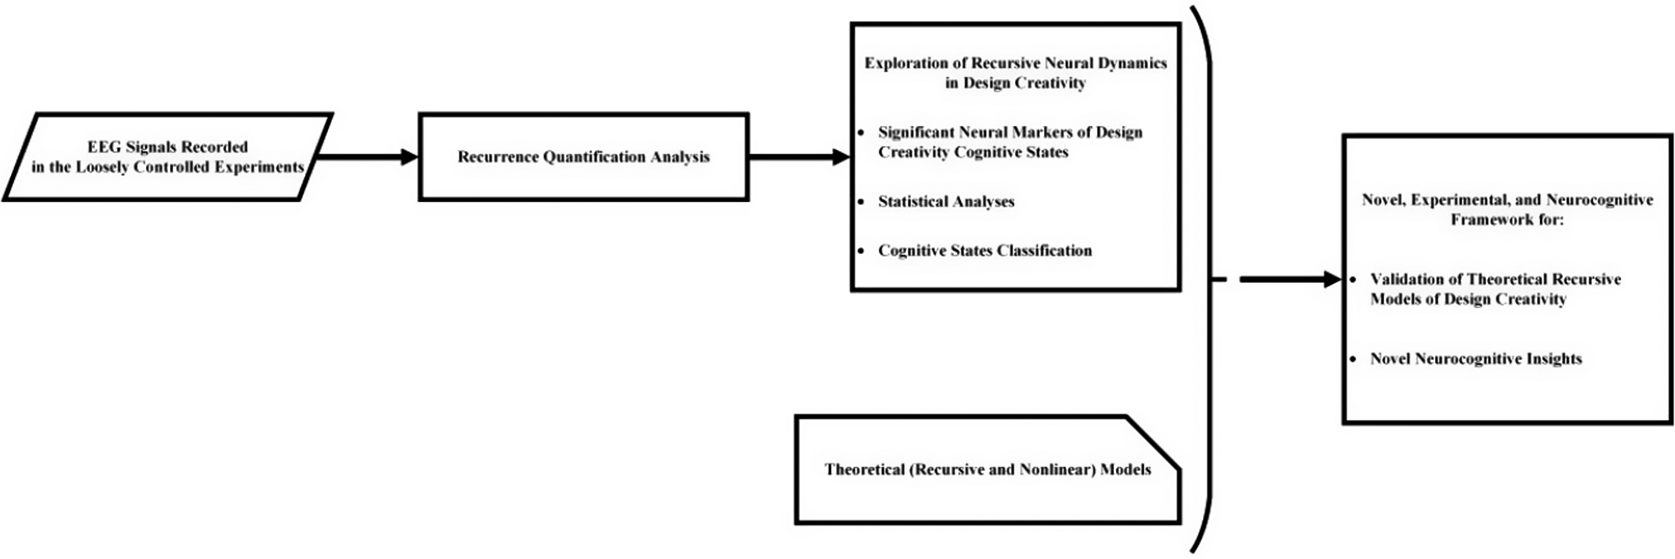


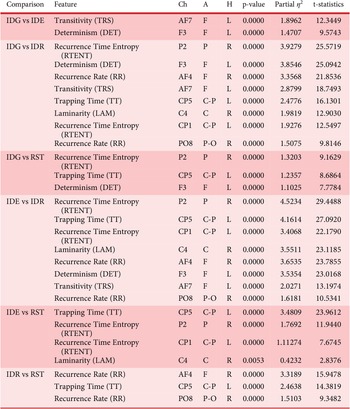

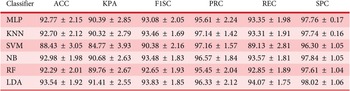


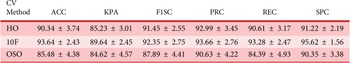


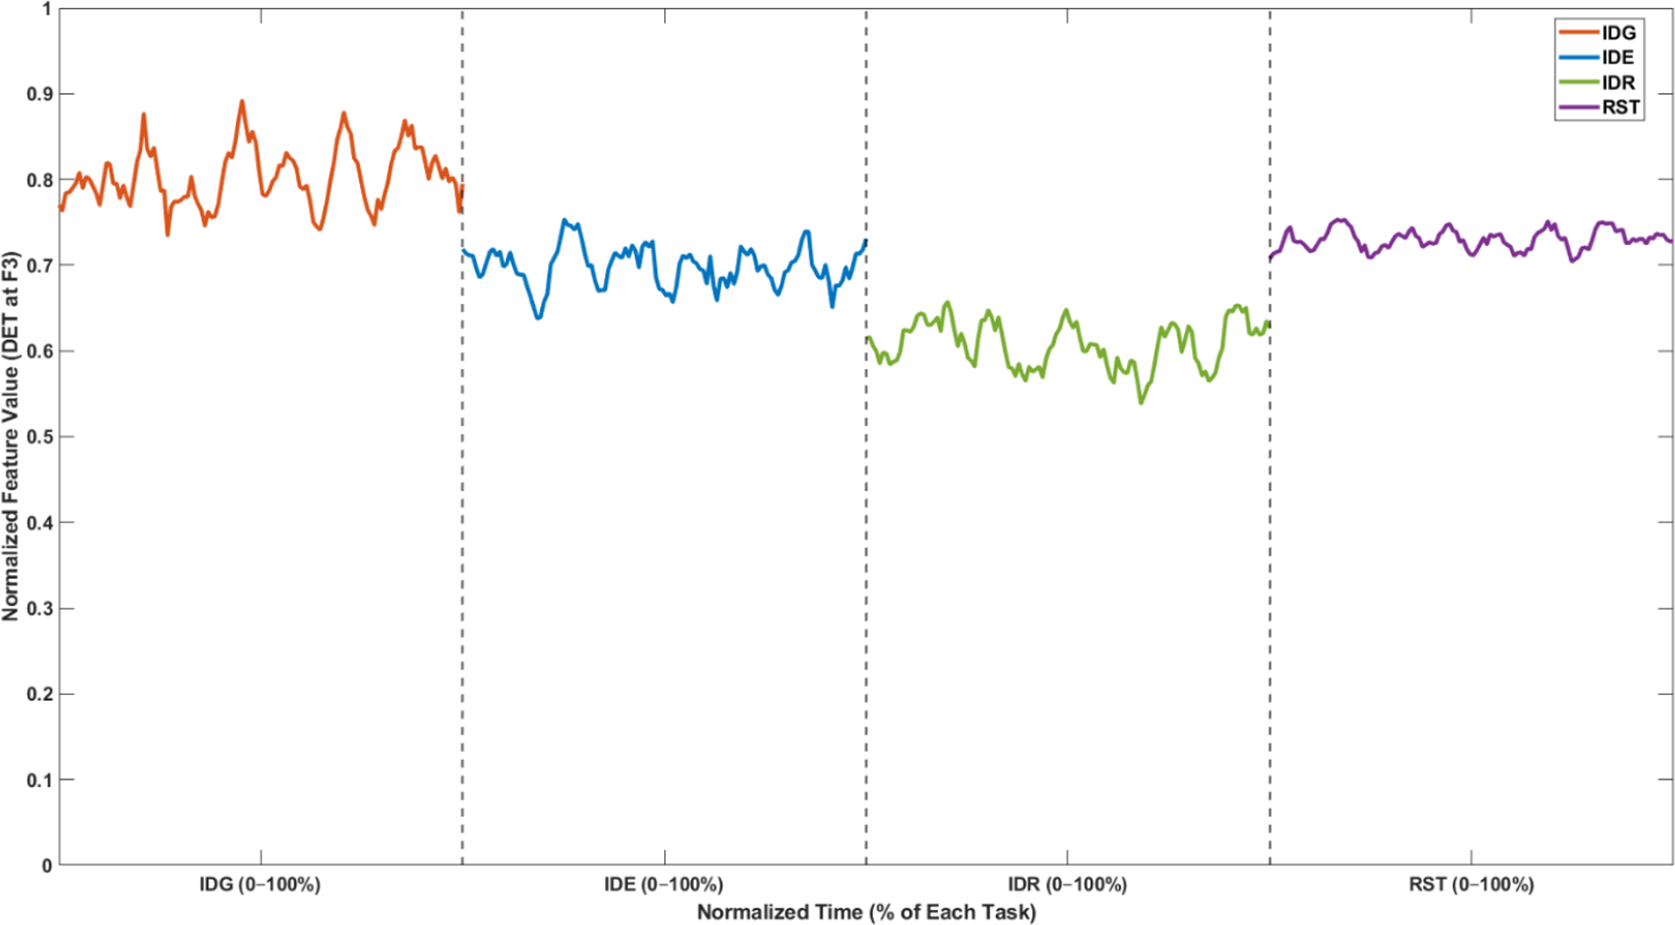


 Open access