


Introduction
The number of English-language research articles on political polarization has increased from fewer than 50 per year before 2006 to over 500 per year in 2022 and 2023Footnote 1, reflecting a growing interest in this phenomenon of researchers, pundits, and the broader public. Scholarship on polarization tends to be dominated by research on its negative ramifications, including the weakening of social cohesion, undermining the potential for inter-group dialog and cooperation, and a feared increase in the willingness to trade democratic norms for partisan goals (Arbatli and Rosenberg, Reference Arbatli and Rosenberg2021; Graham and Svolik, Reference Graham and Svolik2020; McCoy et al., Reference McCoy, Rahman and Somer2018; Svolik, Reference Svolik2019). One line of research on polarization hopes to identify its potential positive consequences: increased political participation. Some studies mention this explicitly and state that a positive effect of affective polarization on public engagement in politics would be a “potential saving grace—or at least a blessing in disguise” (Harteveld and Wagner, Reference Harteveld and Wagner2023, p. 733).
Whether or not higher election turnout and protest activity potentially caused by increases in polarization would indeed be considered a blessing, polarization’s potential for mobilizing or demobilizing citizens is no doubt worthwhile to study. Engagement in politics is a cornerstone of democracy, and a change in the level of participation and the composition of election and protest participants may have profound consequences for future democratic governance. Recognizing its importance, researchers have increasingly taken up this topic in a rigorous way. This systematic literature review and meta-analysis surveys this growing literature, analyzes the heterogeneity of approaches to conceptualizing polarization and examining its effect on different forms of participation, and summarizes its empirical findings.
We searched academic databases and reviewed the returned 1551 results to identify 25 articles that examine participation as the dependent variable and polarization as the main independent variable and extracted 104 coefficients that capture this effect. Among the analyzed effects, we distinguish groups defined by the type of polarization (affective or ideological), level of polarization (individual or system) and type of participation (electoral or non-electoral). Of the eight possible combinations, seven are represented in the literature; missing are analyses of the effects of system-level affective polarization on non-electoral participation. We conduct analyses of heterogeneity of effect sizes accounting for publication bias, and find that the literature provides the strongest evidence in favor of positive effects of individual-level affective polarization on both electoral and non-electoral participation. The same analysis suggests that positive observed effects of system-level ideological polarization on turnout, found in many studies, may be entirely due to publication bias. We conclude by discussing gaps in the literature on the effects of polarization and limitations to this area of research, stemming primarily from data availability.
Political polarization and its effect on participation
The umbrella term “political polarization” encompasses two largely distinct research areas: the first one deals with ideological and the other with affective polarization (cf. Leininger et al., Reference Leininger, Grünewald and Buntfuß2024). Most articles in the present meta-analysis (22 out of 25) analyze the effects of one polarization type and focus on the respective mechanisms. In the case of affective polarization, the mechanism draws from the social identity approach, including social identity theory and self-categorization theory (Tajfel and Turner, Reference Tajfel, Turner, Worchel and Austin1986). Based on this approach, increased salience of party preferences stemming from higher affective polarization will increase the perceived stakes of party competition (the sweetness of victory and bitterness of defeat) and encourage individuals to participate in politics. A counterhypothesis could also be formulated, as increased affective polarization would likely result in higher news negativity, social tensions and conflict. Since most individuals are moderate, conflict- and negativity-averse, they may find an excessively tense and conflicted political climate repulsive and withdraw from politics (Ansolabehere et al., Reference Ansolabehere1994, Reference Ansolabehere, Iyengar and Simon1999; Min, Reference Min2004; Mutz and Reeves, Reference Mutz and Reeves2005).
The theoretical mechanism linking participation and ideological polarization builds on the spatial model of party competition (Downs, Reference Downs1957). In this model, parties and voters are located in the ideological space, and the proximity of individual voters to parties determines turnout and election outcomes. In the spatial model, higher polarization implies a more spread out distribution of parties in the ideological space, which makes it easier for voters to identify their closest party and increases the distance from other parties, which in turn increases turnout (Brockington, Reference Brockington2009). A higher spread also brings parties closer to the more extreme voters, thus increasing the benefit these voters derive from voting. This higher spread may, however, also constitute a mismatch between the positions of parties and the majority-moderate positions of voters (Fowler et al., Reference Fowler2023), and may be perceived by moderate voters as a movement of parties away from them. If they can no longer find a party that represents their moderate views, they may abstain from voting altogether (Muñoz and Meguid, Reference Muñoz and Meguid2021). It is worth noting that the mechanism linking ideological polarization to participation is tailored specifically to election turnout, and correspondingly, studies that link ideological polarization and non-electoral participation are rare. Of the 15 articles in this meta-analysis that study ideological polarization, only four examine forms of engagement other than voting.
The two types of polarization – affective and ideological – are analytically distinct but likely empirically related, as least at the individual level (cf. Lupu, Reference Lupu2015; Simas and Ozer, Reference Simas and Ozer2021; Comellas and Torcal, Reference Comellas and Torcal2023; Gidron et al., Reference Gidron, Adams and Horne2023; Riera and Madariaga, Reference Riera and Madariaga2023), and theoretical arguments about the effects of perceived ideological polarization often refer to affective polarization as a mediator. Affective and ideological polarization are, however, rarely analyzed together (a more detailed discussion of cases where more than one polarization variable is used in models is presented in the section on data, measurement, and models).
The second distinction is less appreciated and deals with the level at which polarization is conceptualized and measured. Traditionally, ideological polarization was considered a system-level property and the early articles on ideological polarization in our selection focus on polarization at the level of the political system (Crepaz, Reference Crepaz1990; Dalton, Reference Dalton2008). How people perceive the party system’s ideological polarization is, however, an individual-level property. Ideological polarization may, hence, be conceptualized at both levels, but the level is related with its objective or subjective character. Both are well represented in the reviewed literature.
Studies of affective polarization also conceptualize this type of polarization at either the system or the individual level; however, this distinction is not related to the objective-subjective character of the measures (see Torcal and Comellas, forthcoming, for a thorough review). The system-level approach to measuring affective polarization in multi-party systems was developed by Reijlan (Reference Reiljan2020) and defined as “the average divergence of partisan affective evaluations between in-party and out-parties, weighted by the electoral size (vote share) of the parties” (p. 380). The polarization index only accounts for partisans, i.e. individuals who identify with some political party; this approach leaves out substantive portions of societies, which has been criticized e.g., by Torcal and Comellas (forthcoming) as a potential source of incomparability in cross-country analyses of multi-party systems. Interestingly, this measure of system-level affective polarization has not been used as predictor of participation in any of the articles included in the present meta-analysis.
Regarding individual-level affective polarization, Wagner (Reference Wagner2021) proposed measures of individual-level affective polarization defined as the mean distance from the most-liked party and the standard deviation of like-dislike scores towards all parties. Both measures can be weighted by party size (vote or seat shares) or unweighted. Occasionally these individual affective polarization scores are aggregated to the system level by calculating simple means (e.g., Garzia et al., Reference Garzia, Ferreira Da Silva and Maye2023; Harteveld and Wagner, Reference Harteveld and Wagner2023, from the collection of studies included in the meta-analysis; Torcal and Comellas, Reference Torcal and Comellas2022).
Despite the importance of the distinction in the levels at which polarization is conceptualized, the theoretical discussions about the effects of polarization on participation typically do not make the level of measurement of polarization explicit and similar arguments are made to formulate hypotheses about effects of polarization as an individual- and system-level property. The study by Rossteutscher and Stövsand (Reference Rossteutscher and Stövsand2024) is an exception in this regard, as their theoretical argument hinges on the individual- and system-level distinction, but at the same time it blurs the lines between mechanisms specific to affective and ideological polarization. The authors argue that system-level polarization is expected to reduce turnout because it would produce a tense political climate where attention would be focused on identity politics rather than addressing pressing social problems. Meanwhile, individual-level polarization is expected to increase turnout due to the mechanism of clarifying party positions.
Systematic review methodology
The goal of the search was to identify articles that study the effects of polarization on participation using quantitative data aimed at representing the entire adult populations of the respective countries. We followed the Preferred Reporting Items for Systematic Reviews and Meta-Analyses (PRISMA, Page et al., Reference Page2021), which provides guidelines for reproducible systematic reviews. Figure A1 in the Online Supplement presents an overview of the search process.
We searched two academic databases, Web of Science and Scopus, between February 1st and 5th, 2024. The query required the presence of “polarization” or “polarisation,” and “participation,” “turnout,” “protest” or “voting” in the title or abstract. We restricted the range of publication dates to end on January 31, 2024, publication type to articles, language to English, and subject area or discipline to the social sciences. The searches returned a total of 1551 records (731 from Scopus, 820 from the Web of Science), with 464 duplicated records identified with DOIs or titles in cases where a DOI was not available. The remaining 1087 records were screened by reviewing their titles and abstracts and 999 were eliminated in this process. Polarization is currently one of the hot topics in the social sciences, and the term is often used in a loose sense, to describe the political or social context in which some phenomenon was examined, even though polarization per se was not an element of the analysis. In older papers, polarization is sometimes used as a synonym of sorting, e.g., class polarization of vote choice, or as a property of a distribution of some characteristic, e.g., polarization of employment. The initial list of publication also included a few articles from outside of the social sciences.
From among the remaining 88 articles, one could not be retrieved due to lack of access to the publication full-text, and the other 87 underwent a full-text review. 63 of these papers did not meet eligibility criteria, which are explained in the Supplement. To the 24 that met the criteria, we added one article, Rogowski (Reference Rogowski2014), which was not among the papers returned in the database search, but which we identified by reviewing references in other articles. Overall we selected 25 articles, which are summarized in Table A1 in the Supplement. Four of them appeared in the journal Electoral Studies, three in the European Journal of Political Research, two each in Comparative Political Studies and West European Politics, and one each in the remaining 14 journals.
The data have a multilevel structure with coefficients nested in models, studies, and articles. The 25 articles include 33 studies, where a study is defined as one or more models based on the same data source. Each model, i.e. a set of coefficients from one statistical analysis, may include one or more coefficients that pertain to the effect of polarization. Overall we extracted 104 coefficients. In most cases, there is just one coefficient of interest per model, but occasionally authors test the effects of one aspect of polarization net of another aspect of polarization. Details of variable coding are provided in the Supplement.
All analyses included in the 25 articles are regression models of different kinds. We standardized the coefficients capturing the effect of polarization on participation by first calculating the t-statistics for all regression coefficients. Then, with information on the degrees of freedom in each analysis, we calculated partial correlation coefficients to compare effect sizes across analyses.
Descriptive analysis
Corresponding to the conceptual overview of the literature in section 2, the main dimensions for the classification of the research on the effects of polarization on participation are (1) types of polarization: affective or ideological, (2) levels of polarization: system or individual, and (3) types of participation: electoral or non-electoral. Other important characteristics include geographical coverage and years of publication, reflecting social scientists’ interest and relevance of the studied topics. Figure 1 provides a summary of these basic characteristics of the analyzed articles to be discussed in more detail in the following sections.
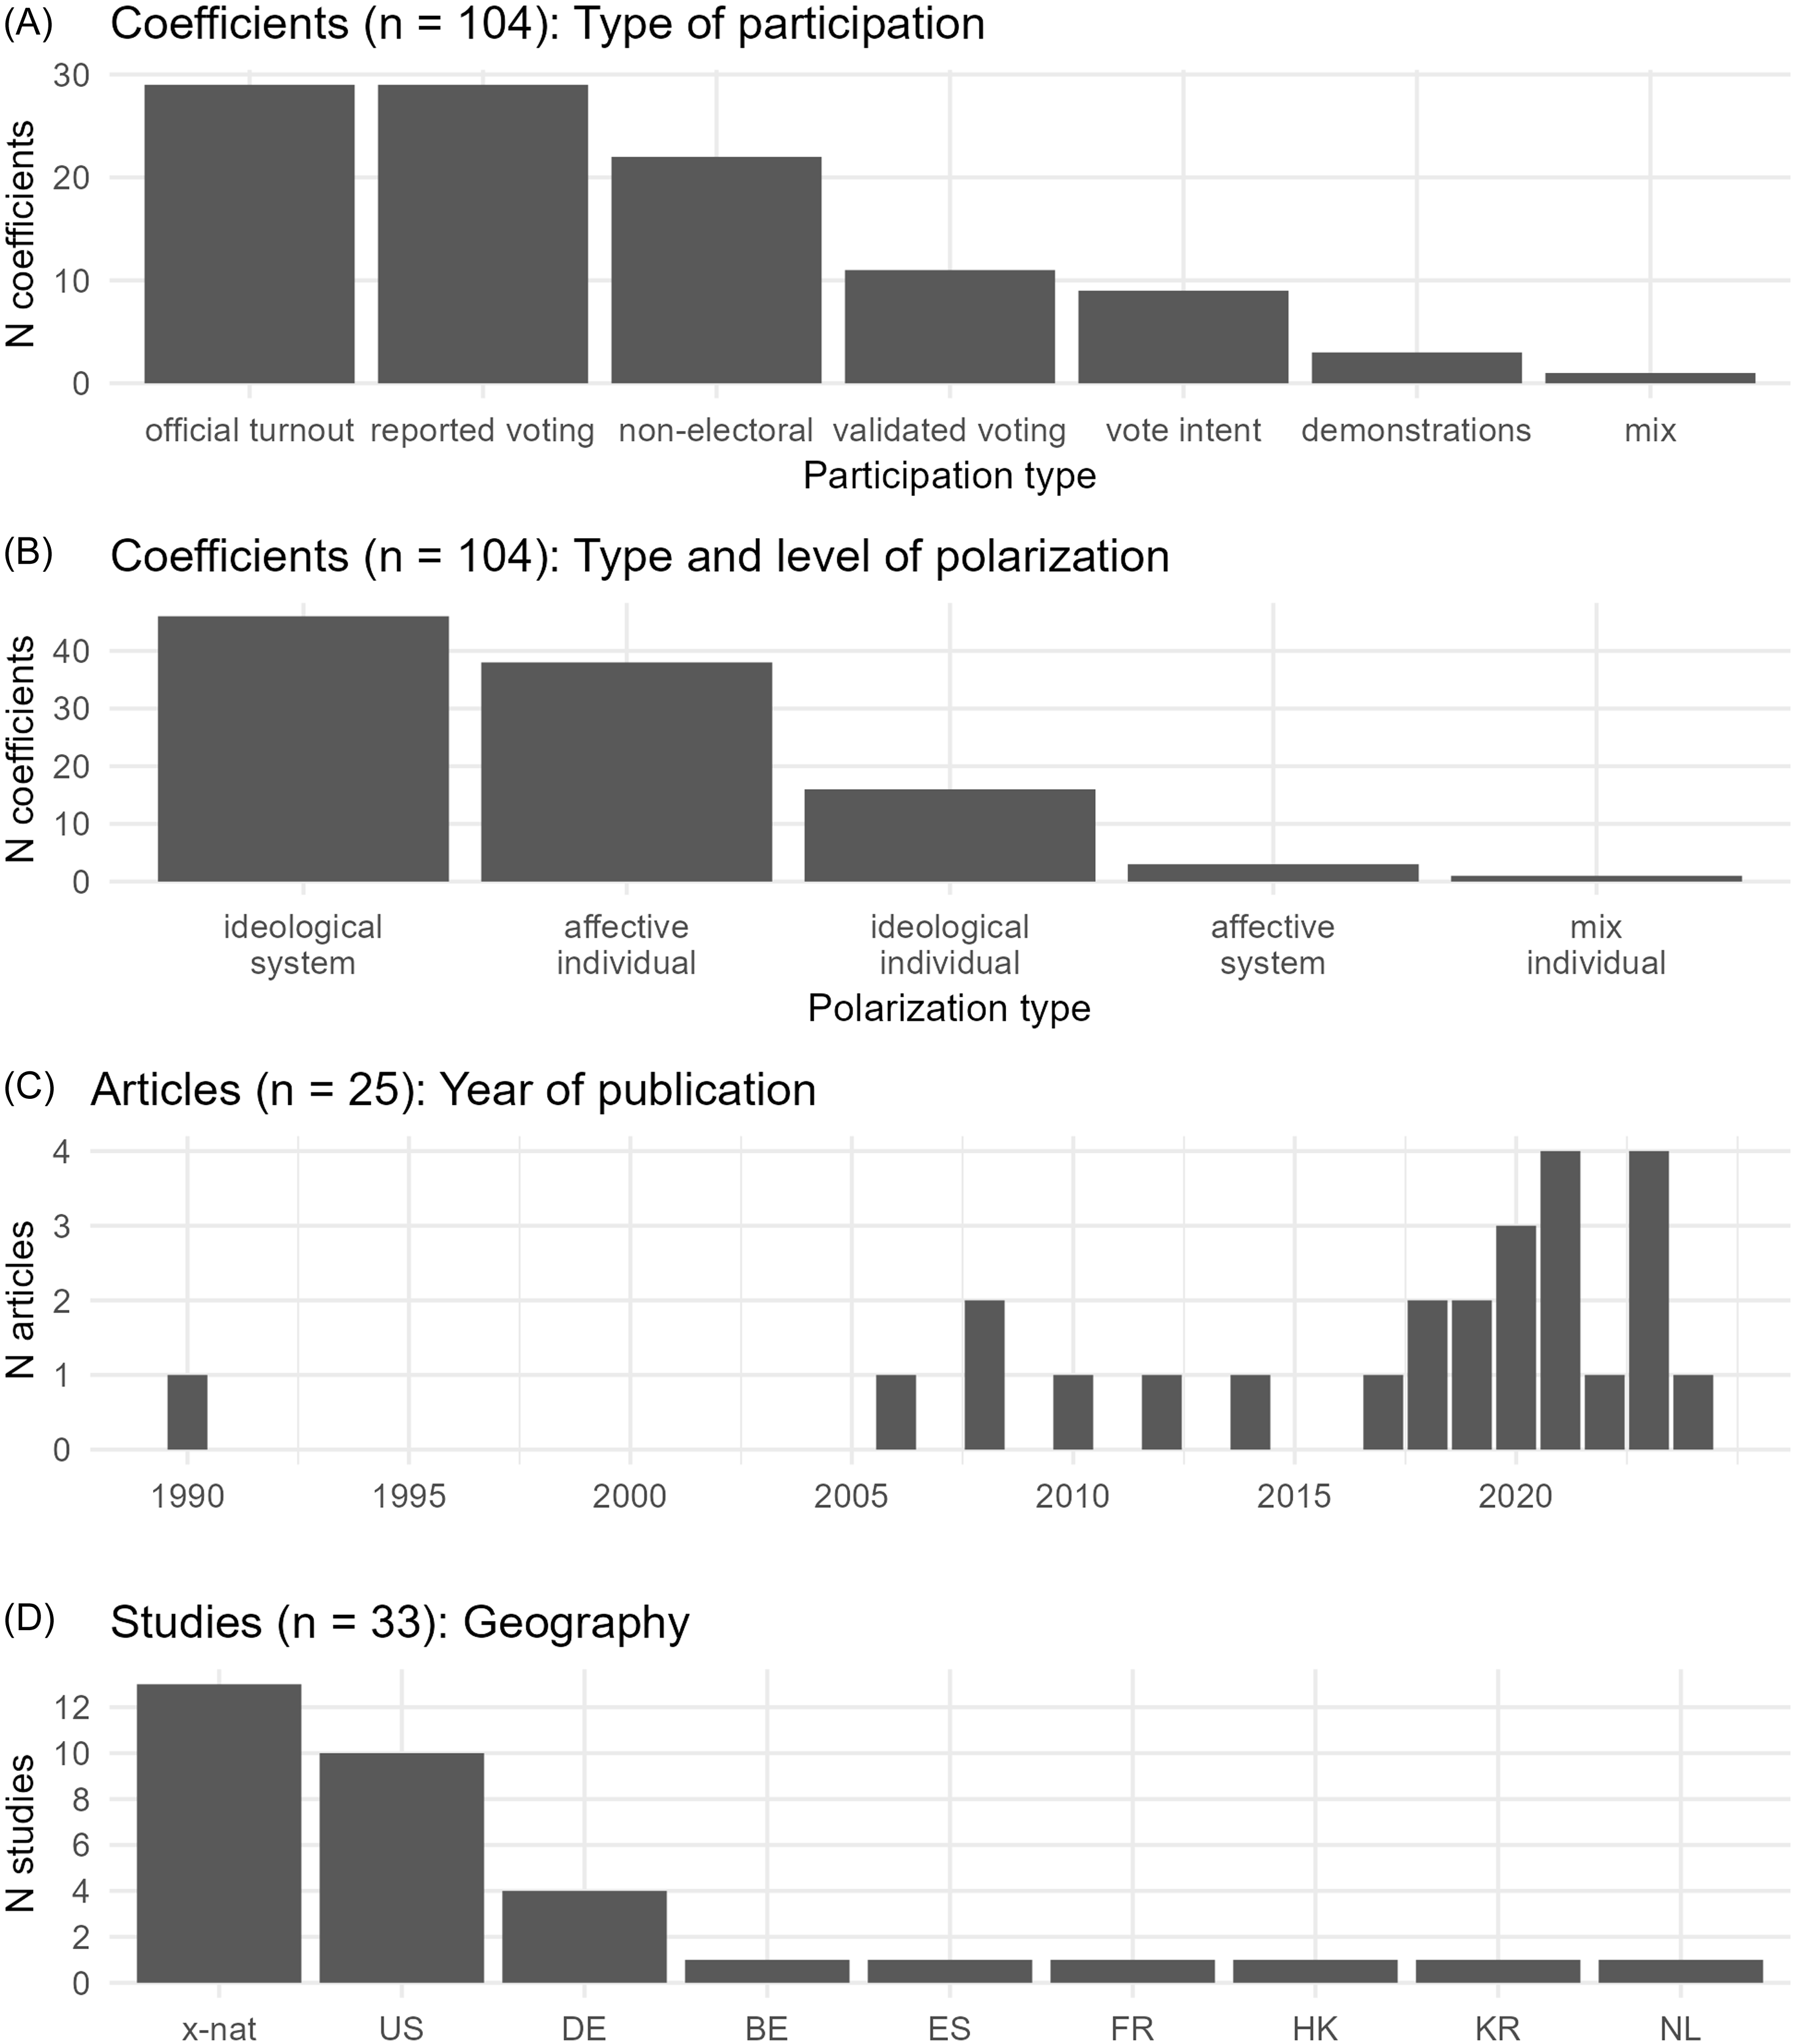
Figure 1. Overview of the literature. An article may include more than one study; a study may include more than one model; a model may include more than one coefficient reflecting the effect of polarization on participation. x-nat = cross-national studies; US = United States of America, DE = Germany, BE = Belgium, ES = Spain, FR = France, HK = Hong-Kong, KR = South Korea, NL = the Netherlands. Polarization type “mix individual” refers to the measure that combines perceptions of ideological and affective polarization used by Dodson (Reference Dodson2010). Participation type “mix” describes a variable that combines voting and protest participation in the study by Wang and Shen, Reference Wang and Shen2018).
Data, measurement, and models
Of the 104 coefficients analyzed in this systematic review, 78 refer to electoral participation as the outcome variable, either based on survey reports (vote intention, reported voting or validated voting) or based on election datasets that report turnout among registered voters or in the voting age population. The remaining ones explain survey-based indicators of activism or protest participation, and one analysis combines voting and protest participation into one variable (labeled as “mix” in panel A in Figure 1).
More than half of the studies analyze individual-level data, with sample sizes ranging from 93-panel respondents in one of the analyses by Ahn and Mutz (Reference Ahn and Mutz2023) to over 220 thousand in the analysis with data from the Cooperative Congressional Election Study (CCES) between 2010 and 2018 by Simas and Ozer (Reference Simas and Ozer2021). The remaining studies rely on analyses of macro data on the level of elections or countries and have between 16 country observations (Crepaz, Reference Crepaz1990) to 756 local elections in Germany in 2008–2016 (Ellger, Reference Ellger2024).
The individual-level studies typically use regression models with some combination of clustered standard errors and fixed effects for geographical units and/or time, or random effects models. Most of the macro-level analyses also rely of linear models (with e.g., turnout as the outcome), while single studies use time-series models such as ARIMA or cross-lagged models.
Measurement of polarization
Panel B in Figure 1 summarizes the distribution of coefficients corresponding to the effects of different types and levels of polarization among the analyzed studies. Regarding operationalization and measurement of polarization, there seems to be some convergence on common definitions, although with exceptions. Among both cross-national and single-country studies, the dominant measure of individual-level polarization is the standard deviation (unweighted or weighted with party size) of responses to left-right placement – in the case of ideological polarization – or responses to like/dislike questions about individual parties (or voters of parties, in the case of the study based on E-DEM panel data, Torcal et al., Reference Torcal2020, in Harteveld and Wagner, Reference Harteveld and Wagner2023) in the case of affective polarization. Dodson (Reference Dodson2010) is an exception (captured as “mix individual” in panel B of Figure 1); it measures perceptions of polarization by asking about manifestations of polarization, as a “scale of four items: (1) differences in solutions to important problems, (2) the salience of both parties, (3) differences in liberal/conservative ideology, and (4) whether the respondent cares who wins the election” (p. 445).
Only one article - Harteveld and Wagner (Reference Harteveld and Wagner2023) – uses a measure of system-level affective polarization constructed as the country mean of individual affective polarization scores. System-level ideological polarization in cross-national studies is typically measured as the standard deviation of objectivized party positions (e.g., mean placement across respondents, based on CSES expert assessment of party positions, or on some scale derived from the Comparative Manifesto Project’s data). Two studies from Germany use the presence of AfD candidates in the local election as an indicator of increased polarization (Ellger, Reference Ellger2024; Hobolt and Hoerner, Reference Hobolt and Hoerner2020). The emergence of AfD means that a heretofore unoccupied extreme right ideological position has been filled, thereby – assuming that the positions of the other parties have not changed – increasing system-level ideological polarization.
Two articles, which aim to predict non-electoral participation, use aggregates of left-right self-placement or policy views on the NUTS3 level (Kleiner, Reference Kleiner2018; Kleiner, Reference Kleiner2020). These two measures are the only ones among the reviewed articles on system-level ideological polarization that do not take into account political parties or candidates.
Modeling approaches
Our collection of 25 articles is characterized by considerable analytic heterogeneity. Analyses of single non-panel surveys use simple regression models. Analyses of data from multiple surveys (either across countries or over time) typically use country or year-fixed effects but do not necessarily account for the clustering of observations within surveys; random effects models are a minority. Of the four panel data analyses, two rely on person-fixed effects models, one uses random effects models, and one uses OLS regression with lagged variables.
Most analyses use a single polarization measure in each model, recognizing the frequent co-occurrence of different aspects of polarization and the yet uncertain causal relationships between them. For example, Ellger (Reference Ellger2024, p. 5) in their study of the effects of ideological polarization on turnout explains: “For conceptual clarity, I treat spatial and affective polarization as distinct mechanisms that link party system polarization to higher turnout. However, both concepts are intertwined and potentially reinforcing.” Ward and Tavits (Reference Ward and Tavits2019) demonstrate that, at the individual level, affective polarization predicts perceived ideological polarization, but only include affective polarization in their models predicting participation.
Occasionally authors pit different types or aspects of polarization against each other, and enter them into the same model, which – of course – has implications for the interpretation of respective coefficients. Overall, five studies from four papers use two polarization variables in the same models. As mentioned earlier, the article by Rossteutscher and Stövsand (Reference Rossteutscher and Stövsand2024) is unique in that it includes individual-level perceived ideological polarization of the party scene as well as system-level ideological polarization. Using data from the Comparative Study of Electoral Systems (CSES) rounds 3-4 (2006–2016), the authors measure system-level ideological polarization as the standard deviation of party ideology on the left-right scale as rated by CSES experts, weighted with party size. Individual-level perceived ideological polarization is measured as the standard deviation of individuals’ perceptions of party positions on the left-right scale weighted with party sizeFootnote 2.
Ahn and Mutz (Reference Ahn and Mutz2023) – in their cross-sectional and panel studies from the United States – use two individual-level affective polarization variables. The first one is constructed as the absolute value of the difference in individuals’ ratings of parties on a 0-100 feelings thermometer. The second one, which the authors call “candidate thermometer rating” is the absolute difference between individuals’ ratings of the two major presidential candidatesFootnote 3.
Harteveld and Wagner (Reference Harteveld and Wagner2023) use affective and ideological polarization, both at the system level, constructed as means of individual-level perceived ideological and affective polarization. The individual-level measures correspond to standard deviations of individuals’ ratings of party affect and left-right placement, respectively.
Finally, Enders and Armaly (Reference Enders and Armaly2019) study the effects of perceived and actual polarization, both measured at the individual level, on participation in campaign activities and reported turnout (as well as efficacy and trust) in the United States, using the American National Election Studies (ANES) from 1972 until 2012. They define perceived ideological polarization as “the absolute value of the difference between an individual’s placement along the issue attitude scale and their placement of the party with which they do not affiliate” (Enders and Armaly, Reference Enders and Armaly2019, p. 5). Actual polarization, in turn, is measured as the “distance between individuals’ positions and the average position of out-party identifiers” (p. 821)Footnote 4.
Year of publication, geography, and data sources
The increase in the number of articles on the effects of polarization on participation reflects the broader increase in the popularity of polarization as a topic in social science research. The earliest publication, by Crepaz, is from 1990, and analyzes the effects of system-level ideological polarization on election turnout across 16 countries. A similar study was repeated by Dalton in 2008, with data on 29 countries. The first studies on affective polarization are from 2006 (Abramovitz and Stone) and 2008 (Abramovitz and Saunders). As shown in panel C of Figure 1, research on this topic intensified in the late 2010s with new publications every year since 2017.
The analyzed studies are also concentrated geographically, as summarized in panel D of Figure 1. Of the 33 studies, 20 use data from single countries: ten from the United States, four from Germany, and one each is based on data from Belgium, France, Hong-Kong, the Netherlands, South Korea, and Spain. Geographical coverage is of course closely related to data sources. Five of the eight US studies use data from the American National Election Study. Of the 13 cross-national studies, the eight that analyze individual-level survey data rely on the Comparative Study of Electoral Systems (6 studies) or the European Social Survey (ESS, 2 studies). Of the macro-level studies, more than one uses data from election turnout databases (e.g., IDEA) and polarization measures derived from the Comparative Manifesto Project. One study relies on data from Programa de Elites Parlamentarias de América Latina from 18 Latin American Countries (Béjar et al., Reference Béjar, Moraes and López-Cariboni2020). Evidence on the effects of polarization on participation is thus concentrated in the United States, Europe, and a handful of other countries. Africa is notoriously underrepresented, with the exception of countries participating in the CSES. Similar biases in country coverage have been observed in recent systematic reviews and meta-analyses (Devine, Reference Devine2024; Scheiring et al., Reference Scheiring2024).
Publication bias
As in any body of published research, here too one of the concerns is publication bias, i.e. the possibility of a disproportionate representation of statistically significant results among published studies. One method for diagnosing publication bias relies on analyses of the distribution of t-statistics from published studies focusing on the distribution of t-statistics around the critical value associated with the standard significance level of 0.95 (for a two-tailed test). Based on a visual analysis of the distribution of t-statistics in Figure 2, there seems to be some discontinuity around 1.96. However, based on the non-parametric local polynomial density estimator with robust bias-correction (Cattaneo et al., Reference Cattaneo2018), there is no evidence to reject the null hypothesis of no discontinuities at a value t = 1.96 (p-value of the test = 0.497).
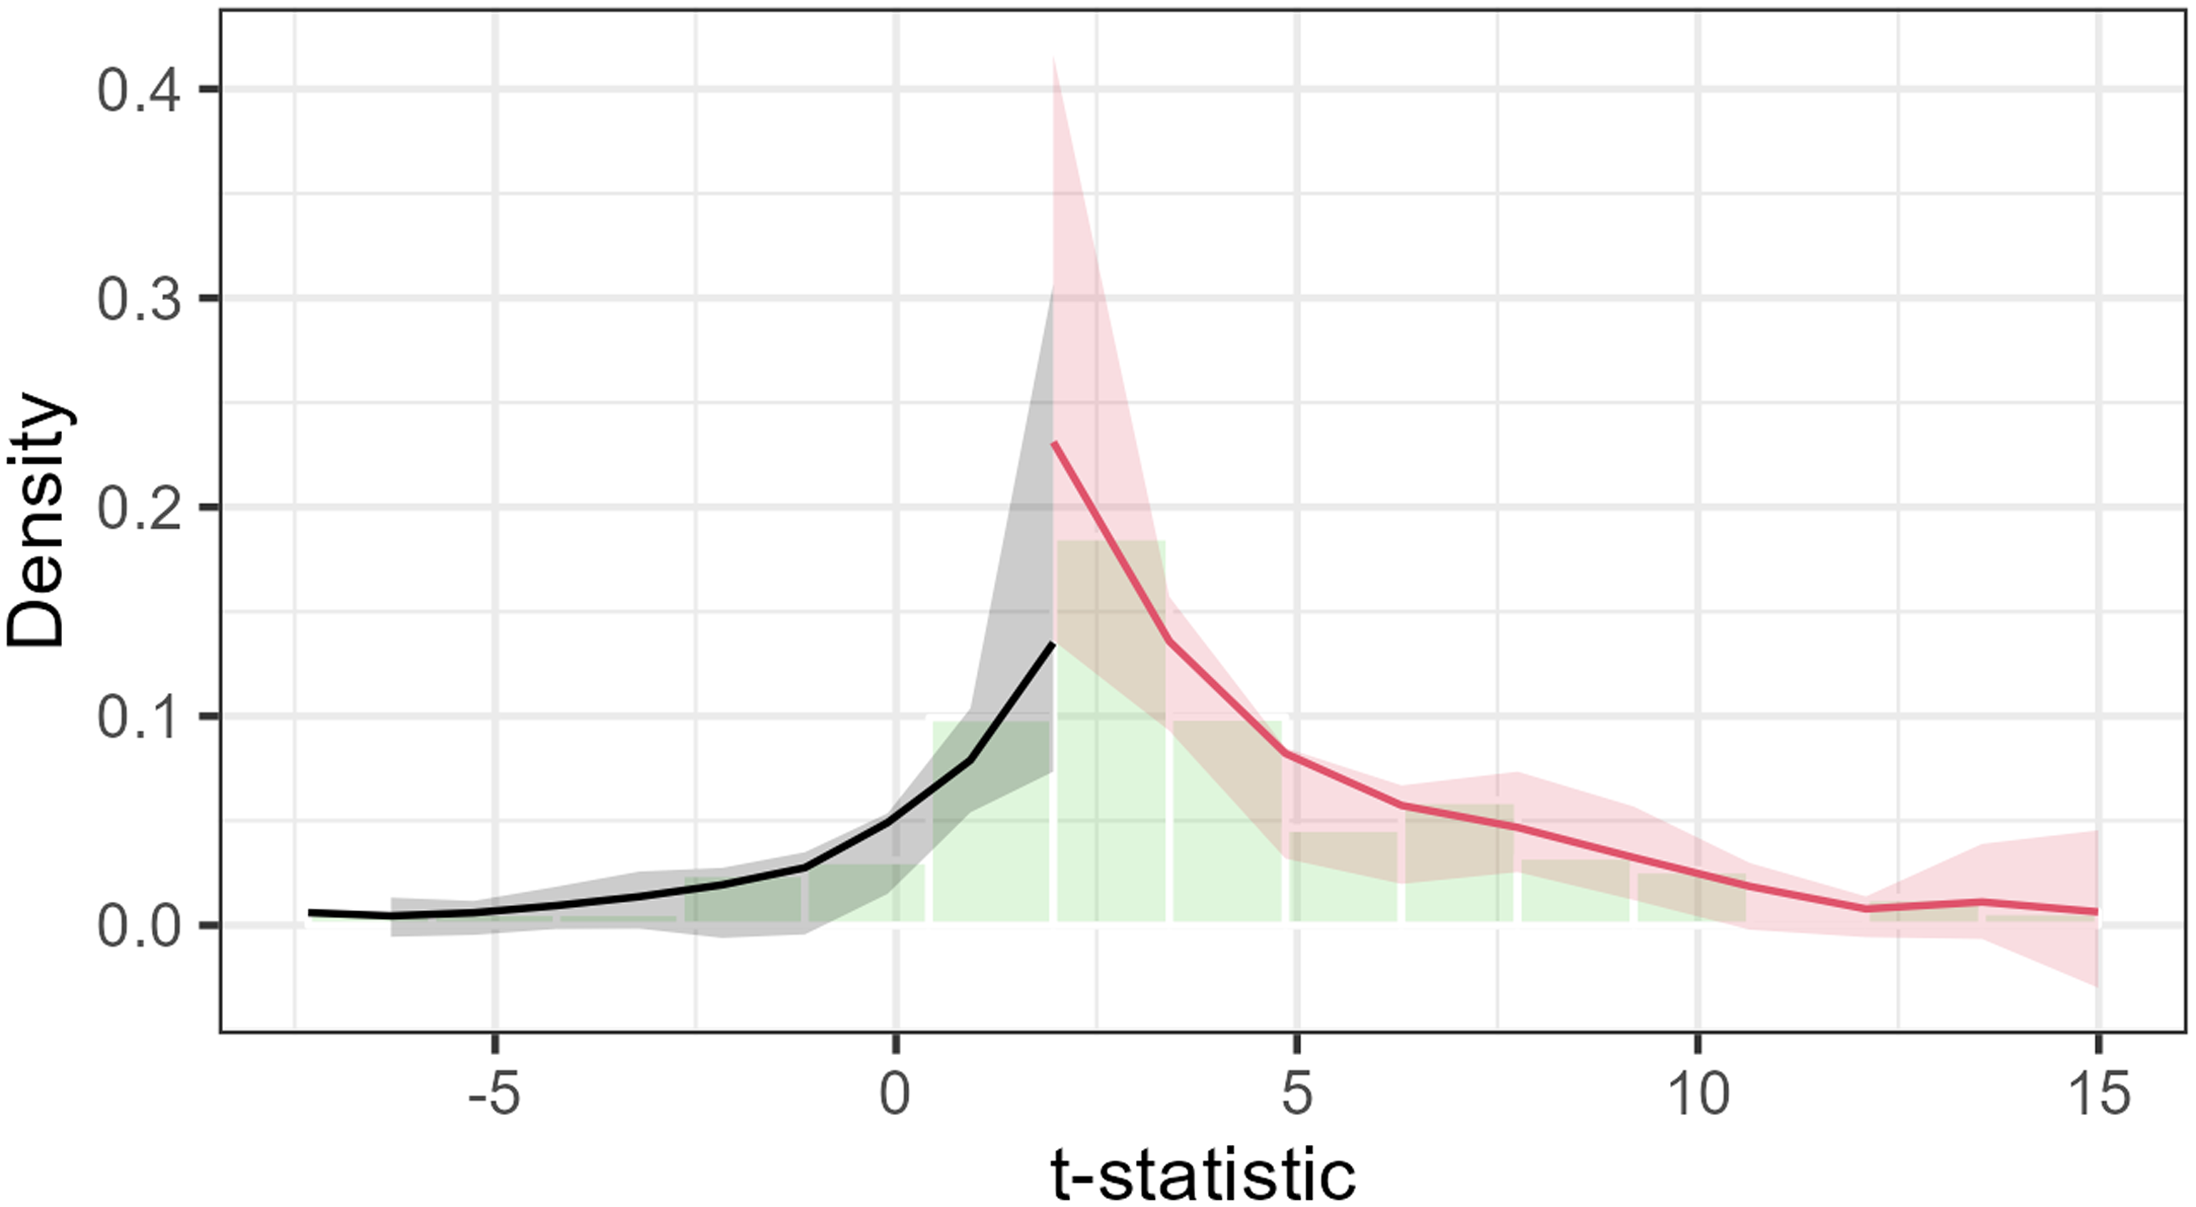
Figure 2. Discontinuity of t-statistics density.
A different way of investigating the presence of publication bias relies on inverse funnel plots, which graph standardized effect sizes (in this case, partial correlation coefficients) against their respective precisions, i.e. the inverse of the standard error. The plot in Figure 3 shows all 104 coefficients from all papers, and is clearly not symmetric: more precise estimates (high values on the Y axis) are clustered close to 0, while less precise estimates (low values on the Y axis) are predominantly in the positive range on the X axis. The mean of all observed effects equals 0.139.
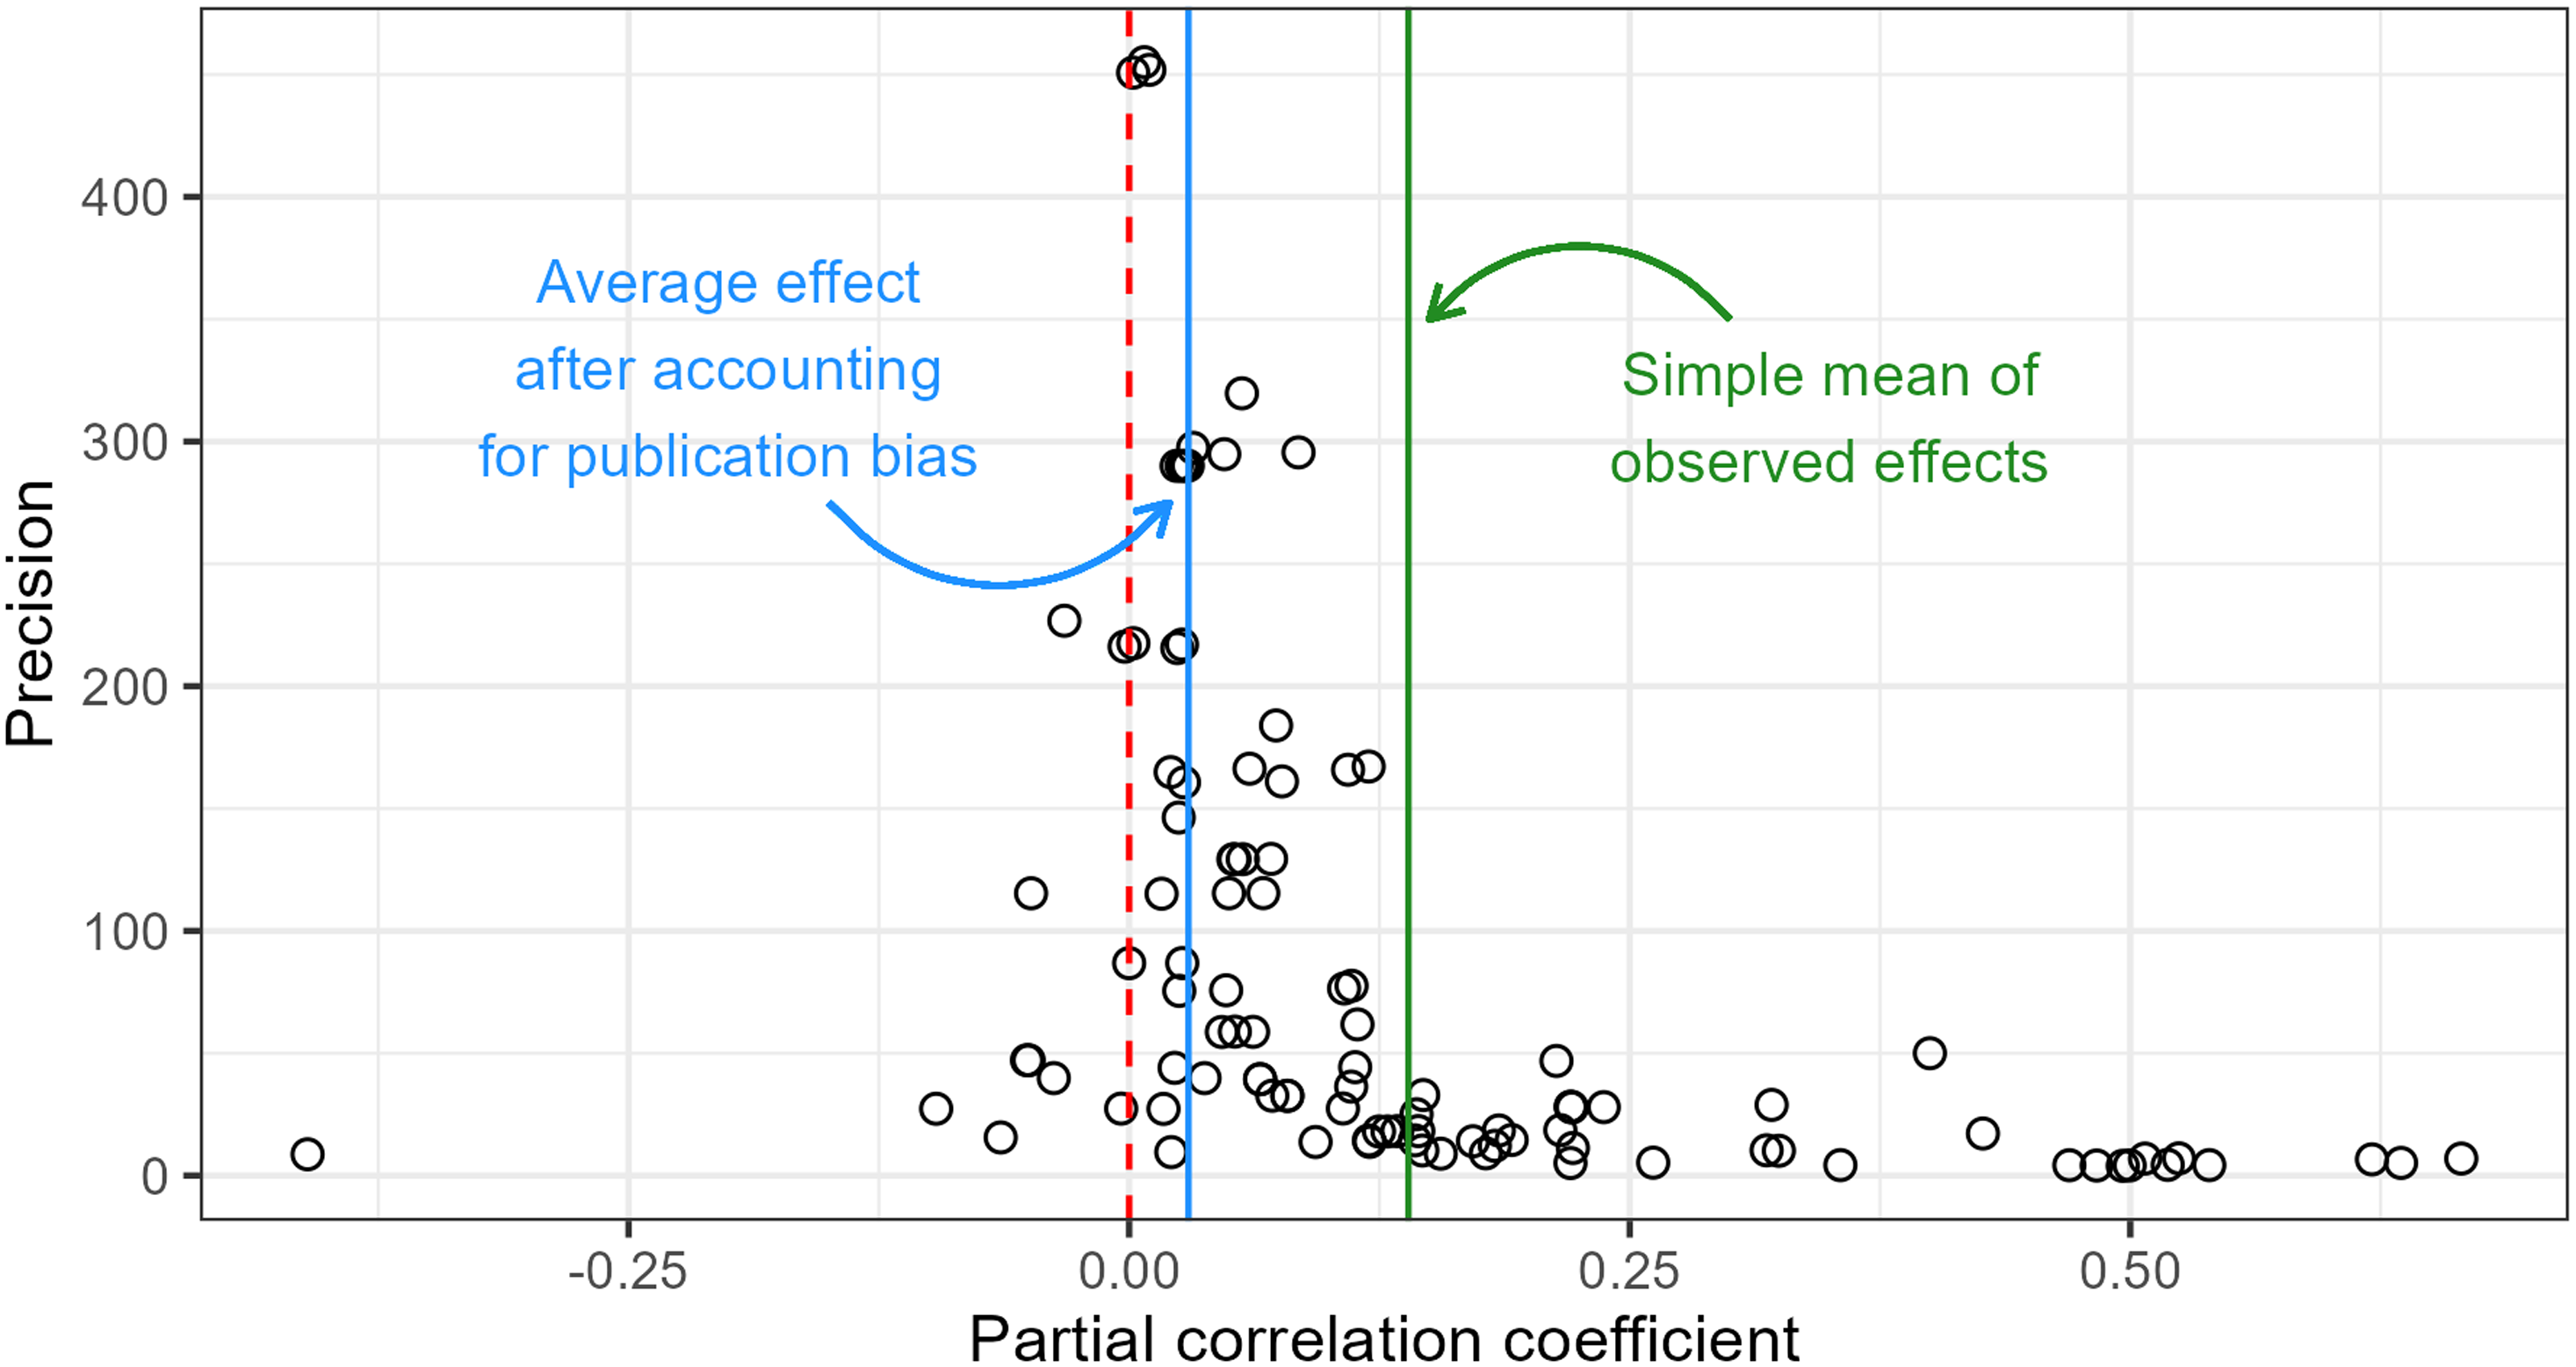
Figure 3. Inverse funnel plot of all 104 coefficients. The green line shows the simple mean of observed effects of polarization on participation. The blue line shows the estimated average effect after accounting for publication bias. The red dashed line indicates 0.
In estimating the amount of publication bias, I follow recommendations of Stanley and Doucouliagos (Reference Stanley and Doucouliagos2014) and model the standardized effect size as a function of its squared error (without a linear term for the error). The model formula is as follows:
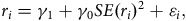 $${r_i} = {\gamma _1} + {\gamma _0}SE{\left( {{r_i}} \right)^2} + {\varepsilon _i}, $$
where ${r_i}$
is the effect size,
${r_i}$
is the effect size, $SE{\left( {{r_i}} \right)^2}$
is the squared standard error, and
$SE{\left( {{r_i}} \right)^2}$
is the squared standard error, and ${\varepsilon _i}$
is the residual. The model is estimated using weighted least squares, with weights constructed as the inverse of the squared standard errors (cf. Gechert and Heimberger, Reference Gechert and Heimberger2022; Stanley and Doucouliagos, Reference Stanley and Doucouliagos2014; Scheiring et al., Reference Scheiring2024). Standard errors are clustered by study to account for the similarity of estimates within studies.
${\varepsilon _i}$
is the residual. The model is estimated using weighted least squares, with weights constructed as the inverse of the squared standard errors (cf. Gechert and Heimberger, Reference Gechert and Heimberger2022; Stanley and Doucouliagos, Reference Stanley and Doucouliagos2014; Scheiring et al., Reference Scheiring2024). Standard errors are clustered by study to account for the similarity of estimates within studies.
The results, in Table 1, suggest the presence of publication bias, but also indicate that there is a true positive effect of polarization on participation even after publication bias is accounted for. It is, however, small, and is estimated at 0.030 compared to the simple average of effect sizes from the published studies equal to 0.139, which would amount to a moderate effectFootnote 5.
Table 1 Funnel-asymmetry precision-effect test models
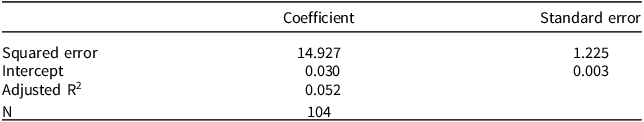
Standard errors clustered by study.
Figure 4 presents inverse funnel plots for combinations of types of polarization and participation which correspond to the theoretically meaningful distinctions in the analyzed literature. Most of these subgroups are too small for regression models, but from a visual inspection, it is clear that the very high average effects in some groups are driven by studies with very low precision. High-precision estimates tend to be very close to 0.
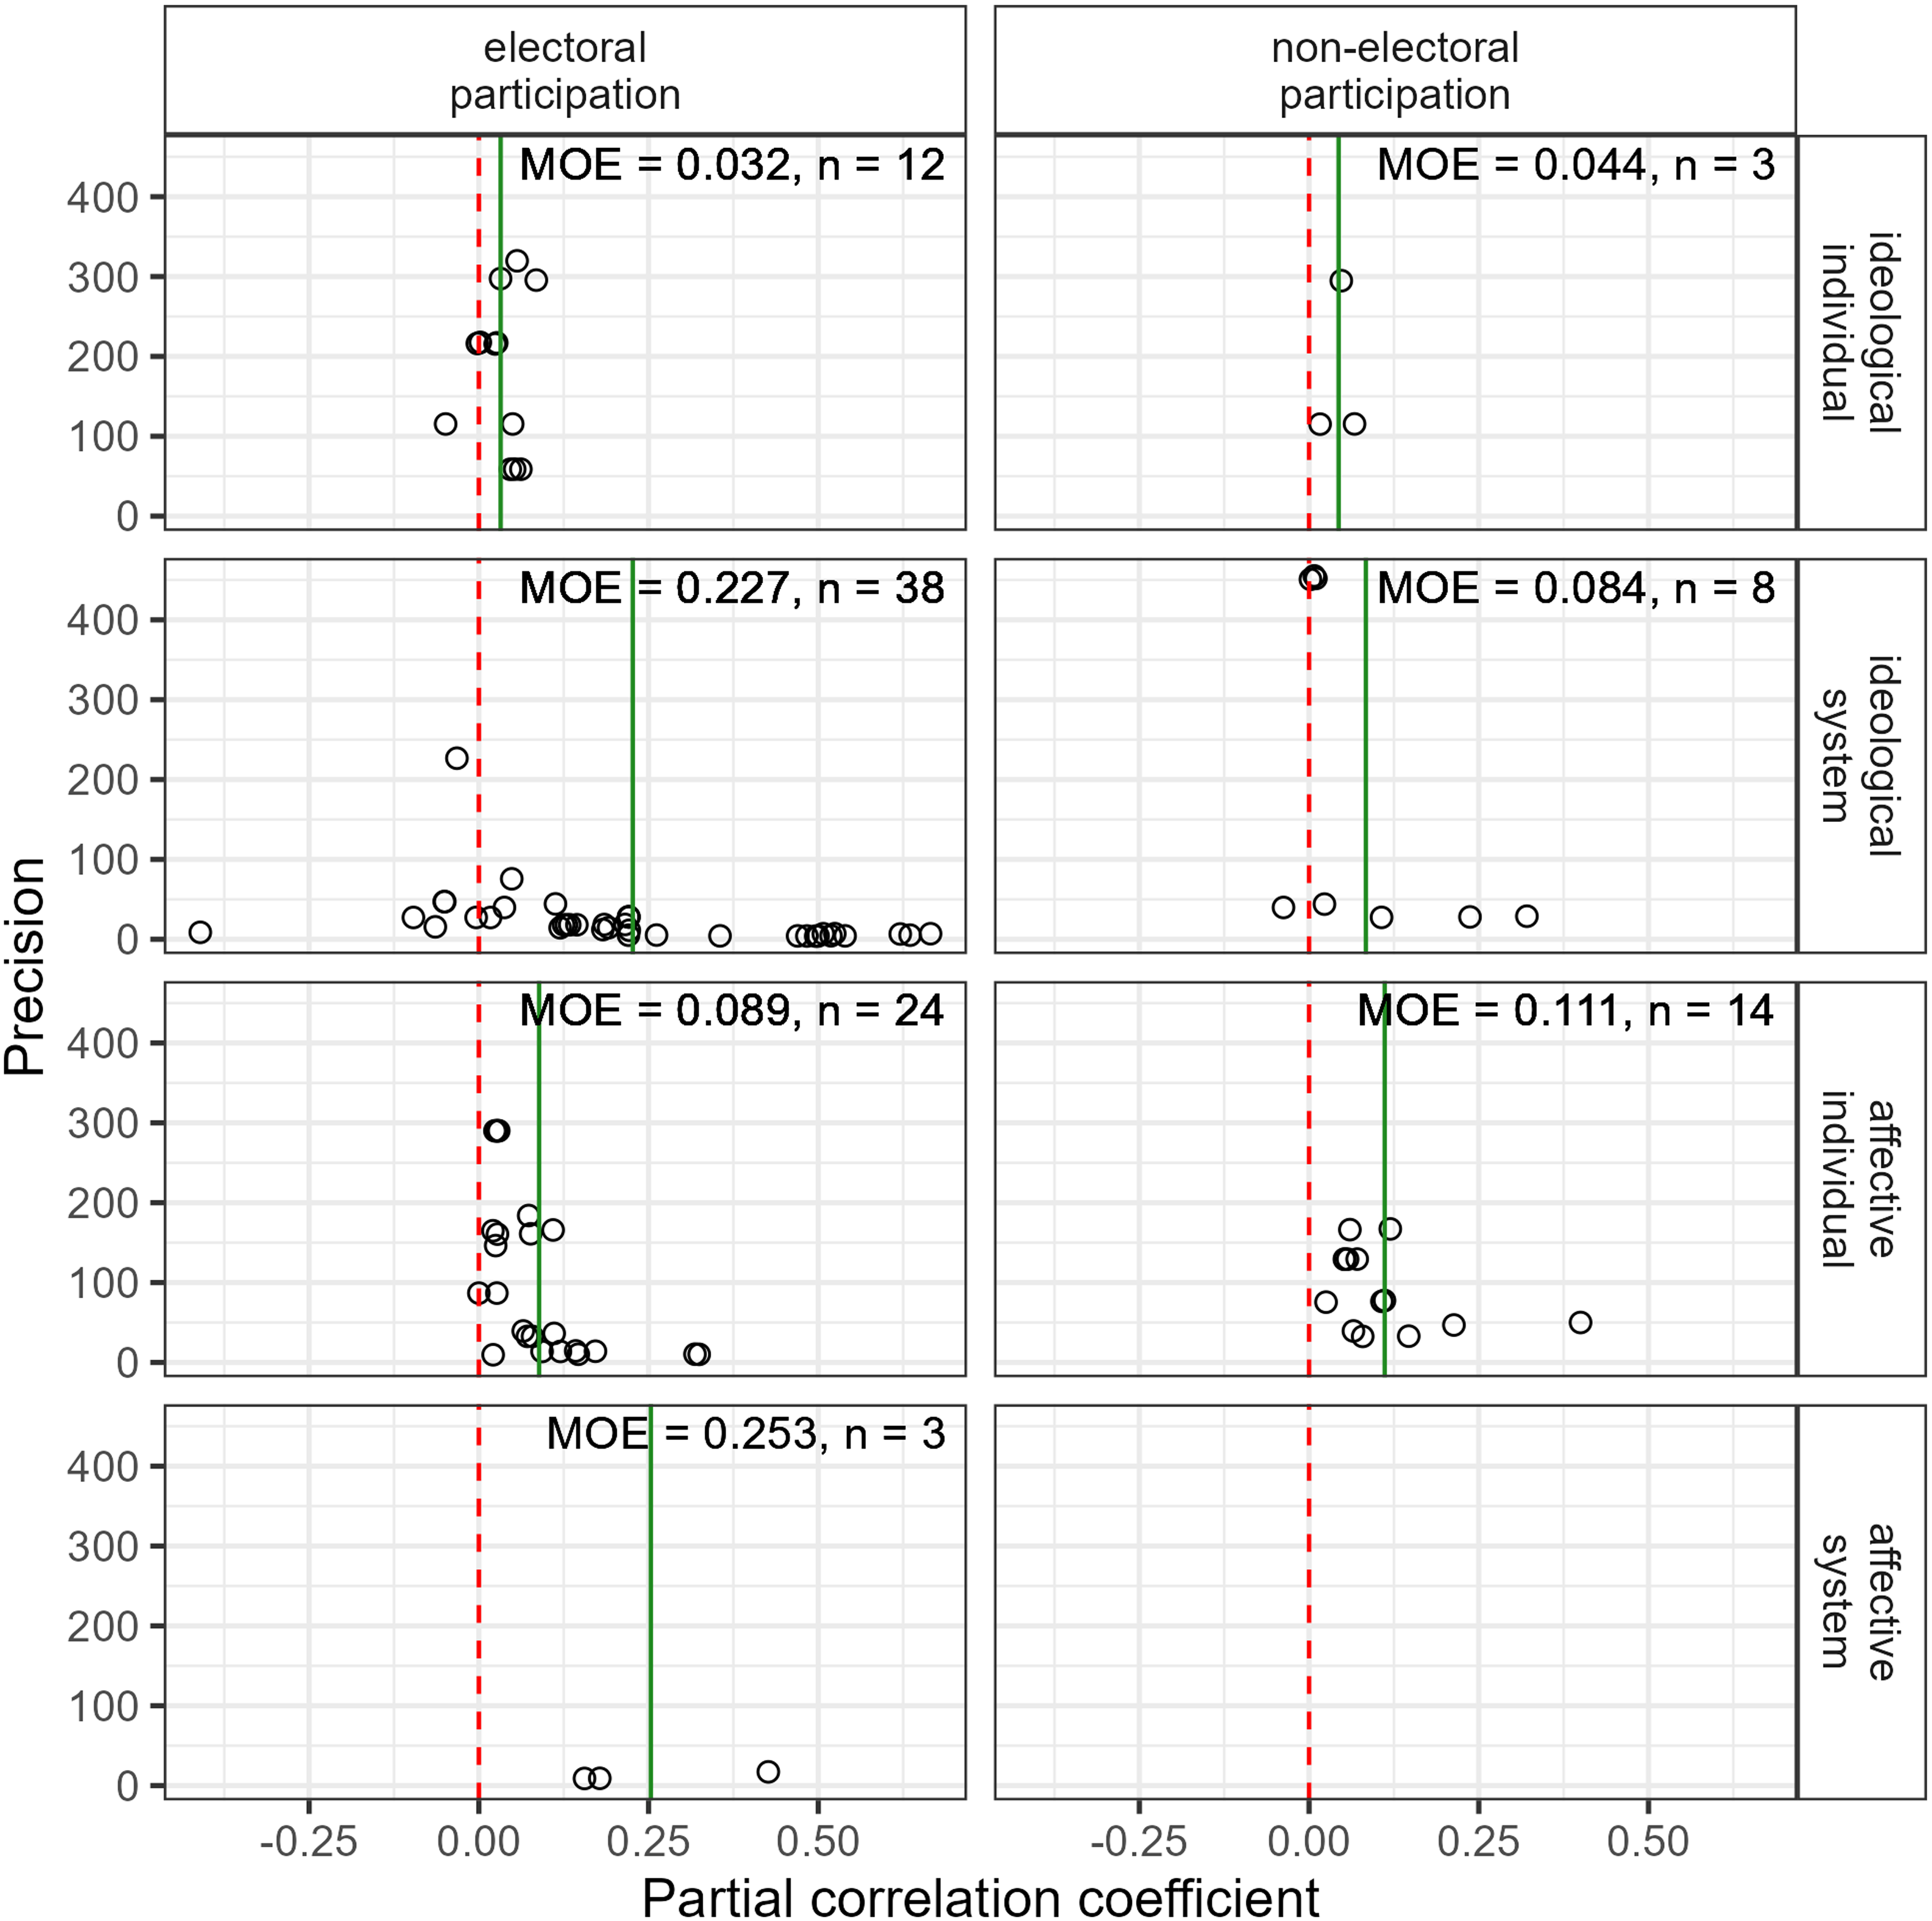
Figure 4. Inverse funnel plot of coefficients for combinations of two types of participation (electoral and non-electoral) and four types of polarization (ideological or affective, individual- or system-level). MOE = Mean Observed Effect. Numbers of coefficients in each combinations are provided in each facet. The plot excludes two coefficients pertaining to participation or polarization operationalizations that could not be classified into the mentioned categories.
Meta-results
Tally of model results
We start with a simple tally of the effects in the analyzed studies simply as counts of significant positive, negative, and null effects, for combinations of types and levels of polarization and types of participation, following Scheiring et al. (Reference Scheiring2024). The analysis is based on the t-values of the coefficients of interest relative to the respective critical values for 95% two-tailed confidence tests.
Most coefficients from our dataset are classified as significant and positive. The six significant negative effects come from four articles that are not typical for the body of literature: two of them include two polarization measures in the same model (Enders and Armaly, Reference Enders and Armaly2019; Rossteutscher and Stövsand, Reference Rossteutscher and Stövsand2024), and the remaining four coefficients come from studies that use nonstandard measures of polarization (Rogowski, Reference Rogowski2014; Kleiner, Reference Kleiner2020). Rogowski (Reference Rogowski2014) measures system-level ideological polarization as the distance between ideology scores of candidates to the U.S. Senate and House. Ideology scores were derived from responses to multiple policy questions from pre-election surveys. Kleiner (Reference Kleiner2020) measures ideological polarization at the level of NUTS3 regions in Europe with data from the European Social Survey 2022–2012. To construct the measure of polarization, the author first categorizes respondents into three groups based on their response to the left-right self-placement questions, captured on a 0–10 scale. Two extreme categories on each side are categorized as “left” or “right”, respectively, and responses in-between as “moderate”. The polarization index is calculated following this formula: MEAN Left × MEAN Right∕MEAN Moderate (p. 581). Interestingly, this definition does not seem to take into account the shares of populations in the three categories. The strong negative effect comes from a model that explains reports of having voted in the last election, after controlling for a host of individual-level covariates, including extremism, ideological position, party attachment, and media consumption, as well as country-fixed effects.
Overall, the summary in Table 2 shows a domination of positive significant effects in most categories, although this distribution could be more symmetrical in the absence of publication bias. The evidence is weakest in the smallest categories, some of which are, however, quite important from the point of view of the interpretation of the results, such as the effects of different types of polarization on validated (rather than self-reported or intended) voting.
Table 2 Summary of focal coefficients across the analyzed articles
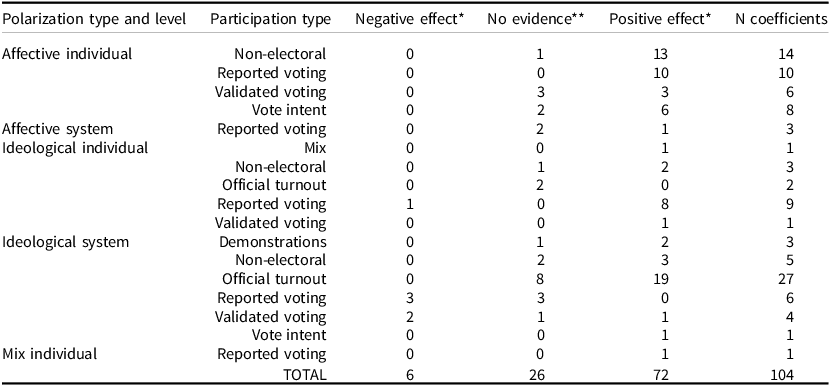
* Statistically significant effect at the 0.05 level. ** No significant effect at the 0.05 level. Polarization type “mix individual” refers to the measure that combines perceptions of ideological and affective polarization used by Dodson (Reference Dodson2010). Participation type “mix” describes a variable that combines voting and protest participation in the study by Wang and Shen (Reference Wang and Shen2018).
Heterogeneity analysis
Next, we check whether some types of studies have a higher chance of yielding larger effect sizes. To examine the heterogeneity of results, following recent work by Gechert and Heimberger (Reference Gechert and Heimberger2022), Filomena and Picchio (Reference Filomena and Picchio2023), and Scheiring et al. (Reference Scheiring2024), we extend the model in equation (1) with predictors capturing aspects of the respective studies’ substantive focus or employed methodology:
 $${r_i} = {\gamma _1} + {\gamma _0}SE{\left( {{r_i}} \right)^2} + {\beta _i}{x_i} + {\varepsilon _i}.$$
In the above equation (2), ${x_i}$
corresponds to the studies’ characteristics, which include: the type of polarization and participation, their combination, as well as the geographical scope of the study, and the primary data source.
${x_i}$
corresponds to the studies’ characteristics, which include: the type of polarization and participation, their combination, as well as the geographical scope of the study, and the primary data source. ${x_i}$
are categorical, so the intercept captures the estimated value of
${x_i}$
are categorical, so the intercept captures the estimated value of ${r_i}$
in the reference category controlling for
${r_i}$
in the reference category controlling for $SE{\left( {{r_i}} \right)^2}$
; the largest category has been assigned as the baseline.
$SE{\left( {{r_i}} \right)^2}$
; the largest category has been assigned as the baseline.
Table 3 provides results of these models. Model 1 includes the type and level of polarization as the predictor, finding that in all cases the estimated effect is significantly greater than 0, although in some cases the effect is expected to be tiny. The effect is smallest for ideological system-level polarization, which is the reference category, as well as affective system-level polarization. In the latter case one must note the small sample size. Other types of polarization are more likely to show larger effect sizes.
Table 3 Results of heterogeneity analysis
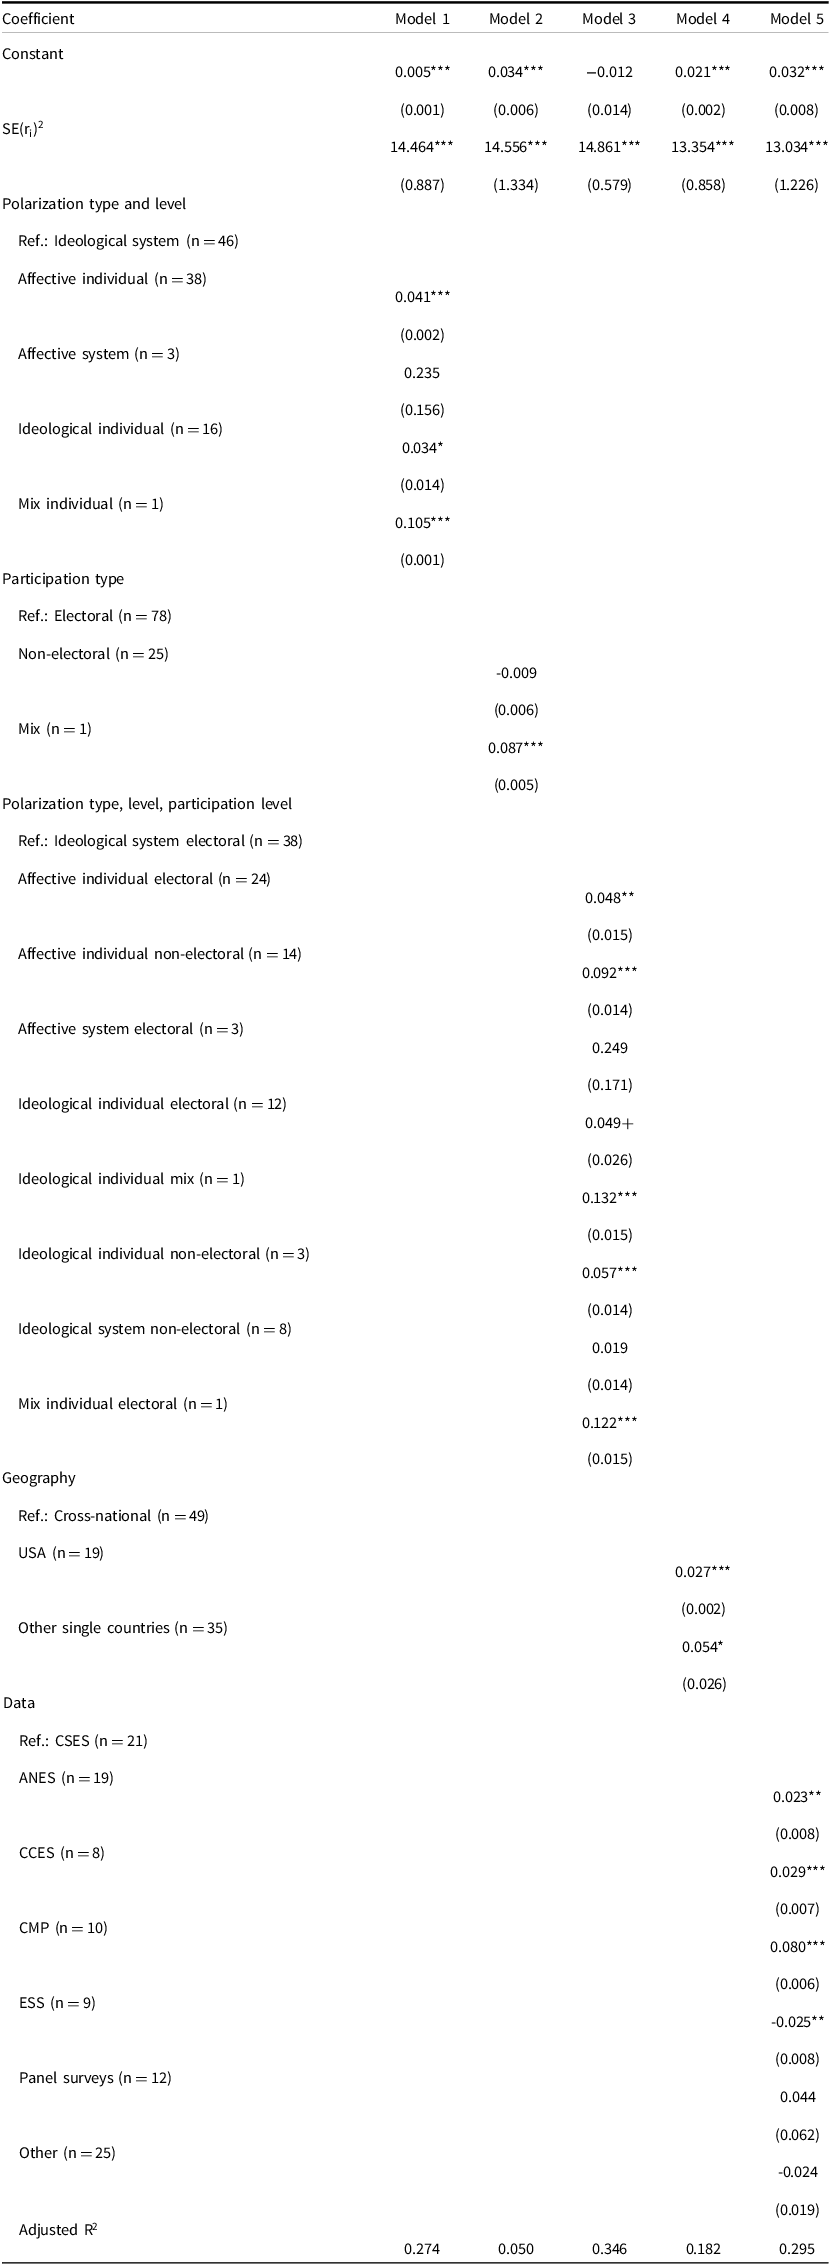
+p<0.1; *p<0.05; **p<0.01; ***p<0.001. N = 104. CSES = Comparative Study of Electoral Systems, ANES = American National Election Study, CCES = Cooperative Congressional Election Study, CMP = Comparative Manifesto Project (as a source of polarization measures; in the analyzed studies CMP is combined with turnout data as measures of participation), ESS = European Social Survey. Numbers next to categorical predictors indicate the size of the respective category. Standard errors clustered by study.
The type of participation as the outcome variable, in and of itself, matters little (Model 2). Larger differences can be detected when interacting the type and level of polarization with the type of participation. The smallest effect, not statistically significantly different from 0, can be found in four categories of analyses: those examining the effect of ideological system-level polarization on electoral participation (reference category), as well as in studies of the effects of ideological system-level polarization on non-electoral participation, ideological individual polarization on electoral participation, and affective system polarization on electoral participation. Again, when interpreting these results it is important to take into account the sizes of the respective categories. The strongest effects, of the larger categories, can be found among the effects of individual-level affective polarization on both electoral and non-electoral participation.
Model 4 shows that single-country studies are more likely to show significant results compared to cross-national studies. Finally, Model 5 distinguishes the analyses by data source, with the European Social Survey, panel surveys, and “other” data sources expected to yield the smallest effect sizes.
The analyzed body of literature is also quite heterogeneous with regard to model design and the ability to tease out causal effects. All analyzed studies are observational in nature; there are no experimental designs, which already sets a limit on expectations regarding causal identification. Analysis of panel data, whether of individual-level and system-level data, is better suited to identifying causal effects than cross-sectional analyses. In our article collection, the 12 coefficients from analyses of individual-level panel surveys (from the Netherlands, South Korea, Spain, and the USA) come from studies of the effects of individual-level affective polarization. Within the group of studies on this type of polarization, analyses of panel and non-panel studies yield comparable effect sizes (see Table A2 in the Supplement). However, these results need to be interpreted with caution, because with the current, relatively low, number of studies, creating more sub-groups necessarily leads to very small cell sizes.
Discussion
Political polarization has increasingly engaged social scientists as reflected by the growing number of publications on this topic, including on the consequences of polarization for participation. This systematic literature review and meta-analysis summarizes the empirical results from 25 articles published during the last three decades. The main substantive differences among these articles are in the type and level of polarization and of political participation. The analysis points to evidence of considerable publication bias, as well as differences between the effects of different types of polarization on different forms of participation. Evidence is the strongest for the effects of individual-level affective polarization on both electoral and non-electoral participation. At the same time, the meta-analysis suggests that positive observed effects of many studies of system-level ideological polarization on electoral participation may be entirely attributable to publication bias. Results referring to other categories need to be interpreted cautiously because of small category sizes.
The literature on the consequences of polarization for participation faces some limitations, largely related to the availability of data sources. Most individual-level studies rely on repeated cross-section datasets (CSES, ANES, ESS) and use measures of polarization and participation from the same survey. This means that polarization is derived from questions asking about the assessment of party positions or party affect at the time of the survey, while reported participation (voting, protesting or activism) occurred (or did not occur) earlier, in the last election or in the last 12 months in the case of non-electoral participation. This may be especially problematic in the case of election surveys (CSES, ANES) administered typically a few weeks following election day, when the context of the survey may be substantially different from the context prior to elections when participation decisions were made. Additionally, possible changes in government composition would affect the respondents’ winner or loser status, which is known to strongly affect a host of attitudes towards politics and institutions. At the same time, election surveys tend to be the most attractive data sources for polarization scholars, as they often include party-related items used to calculate the most popular polarization measures.
Furthermore, most studies in the analyzed articles examine reported or intended participation, while studies predicting validated turnout tend to show weaker results. Investigating this issue, Ahn and Mutz (Reference Ahn and Mutz2023) demonstrate that individual-level affective polarization predicts turnout overreporting, which suggests that studies aiming to explain vote intention or self-reported turnout may be biased.
Based on the available data it is hard to draw strong conclusions about effect size differences depending on study design. An analysis comparing studies that use panel surveys to those that use cross-sectional surveys does not show significant differences, but it is important to keep in mind that in these analyses group sizes were quite small. A thorough comparison of effect sizes is further complicated by the difference in control variables in each analysis (cf. Kohler et al., Reference Kohler, Class and Sawert2024). As the literature on the effects of polarization on participation grows, comparisons of effect sizes depending by model design will become more reliable.
This systematic review reveals several gaps in the literature. First, there seems to be little explicit consideration of the differences between individual-level polarization and system-level polarization, with the exception of the study by Rossteutscher and Stövsand (Reference Rossteutscher and Stövsand2024). The same theoretical mechanisms are discussed in the case of analyses of individual- and system-level polarization. Affective polarization is almost exclusively examined as an individual-level characteristic, while little is known about the effects of living in an affectively polarized social context. Second, few studies focus on the effects of polarization on forms of participation unrelated to elections. Most studies examine election turnout or participation in campaign activities and only a handful of studies examine protest participation.
The next few gaps are characteristic of quantitative political science research more broadly. The geographical scope of analyses in the examined articles is largely limited to Europe and the United States, with other countries represented rarely or only as part of cross-national analyses of the CSES. Future research may focus on whether and how the effect of polarization on participation operates differently in different contexts. Further, all articles examined in this review are based on observational studies; the systematic search we have performed did not reveal any experimental studies on the topic of interest. Additionally, there is evidence of a strong preference for statistically significant results, i.e. publication bias. In reality, the effects of interest are likely far weaker than the “raw” empirical results suggest. Experimental work would help mitigate some of the earlier-mentioned issues with data and model designs, and strengthen the body of evidence regarding the effect of polarization on participation. More work is also needed in the area of measurement to better understand the properties of existing measures of polarization and develop new ones (Wagner, Reference Wagner2024; cf. also Druckman and Levendusky, Reference Druckman and Levendusky2019; Torcal and Comellas, Reference Torcal, Comellas, Torcal and Harteveldforthcoming).
Supplementary material
The supplementary material for this article can be found at https://doi.org/10.1017/S1755773925000116.
Funding statement
Grant from the Polish National Science Centre in the WEAVE-UNISONO program (2022/04/Y/HS6/00024).
Competing interests
None.
Data availability
The data and code necessary to reproduce all results are available at https://osf.io/sj978/.


 Open access