


Introduction
In Rwanda, potato (Solanum tuberosum L.) – often called Irish potato in East African countries (Kachru et al. Reference Kachru, Kachru and Nelson2009) – is a main staple (125 kg per person per annum), second only to cassava (227 kg per person per annum) (FAO 2008, 2019; Shimira et al. Reference Shimira, Afloukou and Maniriho2020). Rwandan potato production has significant potential for growth beyond its current state (Danial et al. Reference Danial, De Vries and Lindhout2016; Quiroz et al. Reference Quiroz, Harahagazwe, Condori, Barreda, Mendiburu, Amele, Anthony, Atieno, Bararyenya, Byarugaba, Demo and Worku2014). In 2007, Rwanda ranked 6th in potato production on the African continent (FAO 2008). Despite this achievement, the growth of Rwandan potato production has slowed. Potato breeding programmes in Rwanda have identified an urgent need to focus on yield improvement, disease resistance, and climate stress adaptation to enhance productivity (Muhinyuza et al. Reference Muhinyuza, Shimelis, Melis, Sibiya and Nzaramba2012; Shimira et al. Reference Shimira, Afloukou and Maniriho2020).
The Rwanda Agricultural and Animal Resources Board (RAB) and the International Potato Center (CIP) in Rwanda tested and released new potato varieties in 2019 and 2020. These varieties have not undergone extensive on-farm testing under farmers’ practices, as this is not a requirement in current variety release procedures in Rwanda. Incorporating user preferences into breeding programmes is a crucial factor in effectively delivering agricultural benefits to farmers in marginal areas (Ceccarelli and Grando Reference Ceccarelli and Grando2007; Sperling et al. Reference Sperling, Ashby, Smith, Weltzien and McGuire2001; Thiele et al. Reference Thiele, Dufour, Vernier, Mwanga, Parker, Schulte Geldermann, Teeken, Wossen, Gotor, Kikulwe, Tufan, Sinelle, Kouakou, Friedmann, Polar and Hershey2021). It is especially essential in the food systems of the Global South; without it, the adoption and diffusion of improved crop varieties may remain limited and slow (Ceccarelli et al. Reference Ceccarelli, Guimarães and Weltzien2009; Thiele et al. Reference Thiele, Dufour, Vernier, Mwanga, Parker, Schulte Geldermann, Teeken, Wossen, Gotor, Kikulwe, Tufan, Sinelle, Kouakou, Friedmann, Polar and Hershey2021).
Participatory on-farm evaluations provide timely input for orienting potato breeding towards relevant goals. Moreover, integrating data-driven approaches enhances the accuracy of local information collection, facilitating efficiencies in user adoption of innovations (Ayim et al. Reference Ayim, Kassahun, Addison and Tekinerdogan2022; Gumbi et al. Reference Gumbi, Gumbi and Twinomurinzi2023).
Here, we employed a data-driven multidisciplinary approach (van Etten et al. Reference van Etten, de Sousa, Cairns, Dell’Acqua, Fadda, Guereña, Heerwaarden, Assefa, Manners, Müller, Enrico Pè, Ramirez-Villegas, Solberg, Teeken and Tufan2023) to enhance potato breeding programmes in Rwanda by focusing on yield improvement, disease resistance, and climate stress adaptation. On-farm trial data were combined with covariates, including on-station, climate, soil characteristics, and socio-economic data relevant to potato production in Rwanda. This integration process was facilitated by the triadic comparisons of technology options (tricot) approach (de Sousa et al. Reference de Sousa, van Etten, Manners, Abidin, Abdulmalik, Abolore, Acheremu, Angudubo, Aguilar, Arnaud and Babu2024; van Etten et al. Reference van Etten, Beza, Calderer, van Duijvendijk, Fadda, Fantahun, Kidane, Van de Gevel, Gupta, Mengistu, Kiambi, Mathur, Mercado, Mittra, Mollel, Rosas, Steinke, Suchini and Zimmerer2019a), a decentralized testing framework supported by citizen science. Tricot enables large-scale on-farm variety evaluations by using a series of methods, such as assigning materials partially and randomly to participants for comparative ranking. It addresses past challenges of participatory breeding, such as limited participant numbers and trial sizes, by generating extensive spatial datasets. These datasets link each plot’s geographic coordinates to environmental variables, revealing critical insights into how environmental conditions influence farmers’ variety preferences (Brown et al. Reference Brown, de Bruin, de Sousa, Aguilar, Barrios, Chaves, Gómez, Hernández, Machida, Madriz and Mejía2022; van Etten et al. Reference van Etten, de Sousa, Aguilar and Steinke2019b). Additionally, this study predicts the effects in on-farm trials by incorporating the genotypic values of varieties – generated from on-station trials under controlled field conditions – as item covariates in the model (de Sousa et al. Reference de Sousa, van Etten, Poland, Fadda, Jannink, Kidane, Lakew, Mengistu, Pè, Solberg and Dell’Acqua2021; Turner Reference Turner2023; van Etten et al. Reference van Etten, Manners, Steinke, Matthus and de Sousa2020).
We report on a tricot trial on potato cultivation across two seasons – Season A (September 2020 to February 2021) and Season B (March 2021 to July 2021) in Rwanda. The trial involved 460 incomplete blocks, totalling 1380 plots. Participating farmers ranked the performance of 11 potato varieties, including both older varieties (released before 1990) and recently released ones. Our novel methodological contribution in this paper is that we expanded the use of the tricot approach in two ways, which we deemed important to inform potato breeding in Rwanda. Firstly, we collected data that can influence farmers’ variety adoption, including environment, gender and socio-economic heterogeneity, and explored how this influences farmers’ preference for potato varieties. Thiele et al. (Reference Thiele, Dufour, Vernier, Mwanga, Parker, Schulte Geldermann, Teeken, Wossen, Gotor, Kikulwe, Tufan, Sinelle, Kouakou, Friedmann, Polar and Hershey2021) suggest that neglecting gender aspects can ignore important traits, which has resulted in low adoption of vegetatively-propagated crops (e.g., banana, cassava, potato, yam). Secondly, we incorporated data from on-station trials into the estimation of genotypic values of potato varieties to better explain their performance in the on-farm trial. This is expected to facilitate on-farm trial’s interpretation from a biological selection perspective within potato breeding programmes.
The objectives of this research were to (1) analyse farmers’ preference regarding performance of potato varieties on farm, (2) examine the influence of covariates (climate and other environmental data, crop phenology, and socio-economic variables) on farmers’ variety preferences, and (3) analyse how item covariates, genotypic values measured in on-station trials, influence on-farm performance and farmers’ evaluations of potato varieties. In addition, this paper discusses the limitations of the study and offers recommendations to further improve the tricot approach.
Materials and methods
Overview
We implemented a data-driven transdisciplinary approach (van Etten et al. Reference van Etten, de Sousa, Cairns, Dell’Acqua, Fadda, Guereña, Heerwaarden, Assefa, Manners, Müller, Enrico Pè, Ramirez-Villegas, Solberg, Teeken and Tufan2023) to understand how various factors – including potato variety performance in on-station trials, climate and soil characteristics, and socio-economic conditions – collectively influence potato variety performance and farmers’ preferences. To achieve this, we employed the Plackett-Luce model to interpret farmers’ rankings of potato varieties and incorporated spatial data with these factors as covariates to account for regional ranking variations. Additionally, we used the PLADMM optimization approach to incorporate item covariates in the Plackett-Luce model (Yildiz et al. Reference Yildiz, Dy, Erdogmus, Kalpathy-Cramer, Ostmo, Campbell, Chiang and Ioannidis2020; Turner Reference Turner2023). This allowed us to assess how genotypic values influenced the ranking outcomes (Figure 1).
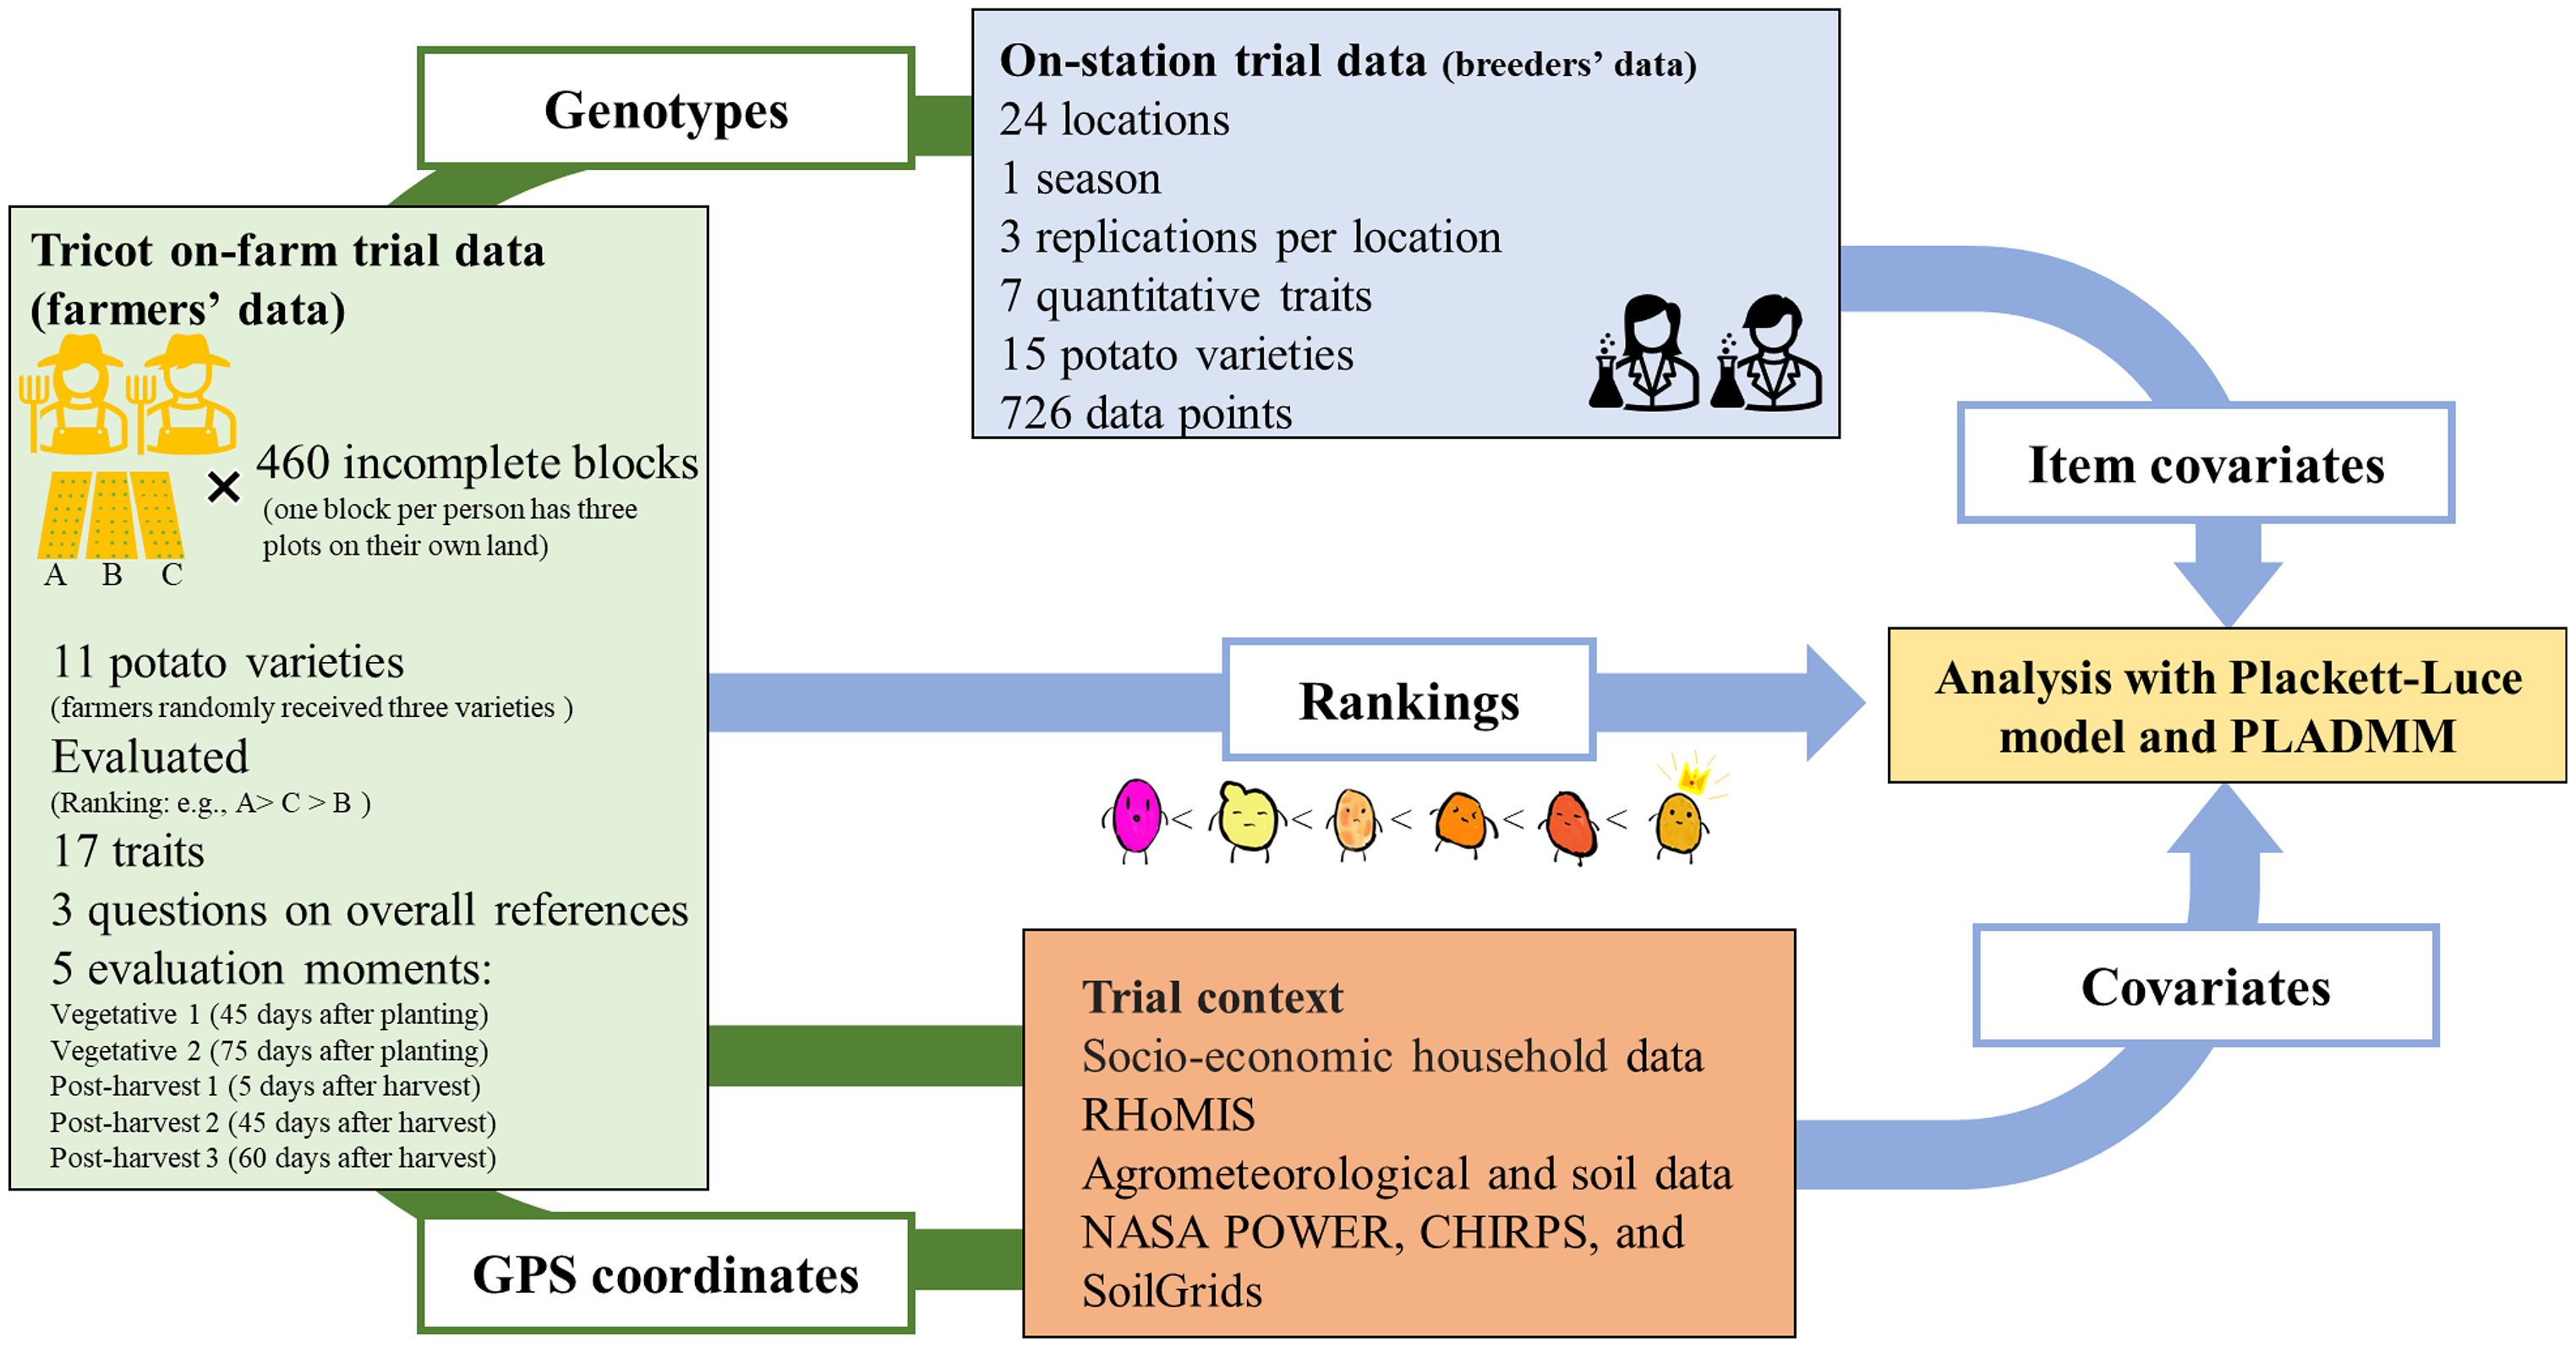
Figure 1. Overview of this research approaches, material, and methods (using Plackett-Luce model and PLADMM, Plackett-Luce alternating directions method of multipliers).
This research used on-farm trial data, where participating farmers ranked the performance of 11 potato varieties, comprising both older (released before 1990) and recently released varieties (released after 2018), evaluating three randomly allocated varieties planted in their fields during each measurement period. In contrast, on-station trial data were generated by plant breeders conducting multi-location tests under controlled field conditions, measuring numeric, ratio, and category values to evaluate varieties’ genotypic value throughout Rwanda.
Planting materials
A total of eleven potato clonal varieties were selected from the CIP potato breeding pipeline (Lindqvist-Kreuze et al. Reference Lindqvist-Kreuze, Bonierbale, Grüneberg, Mendes, De Boeck and Campos2024) and tested in on-farm and on-station trials in Rwanda (Table 1). Tuber seeds for all varieties were produced under field conditions (RAB Musanze station) from in vitro potato plantlets. These plantlets were hardened in the greenhouse and transplanted to the field. Afterwards, potato varieties underwent two cycles of propagation in the field at RAB Musanze Station to be used as our experimental materials.
Table 1. Potato varieties tested in this study and their characteristics and inclusion in different types of trials. All varieties are released and recommended for Rwandan highland conditions. Source: CIP (2021)
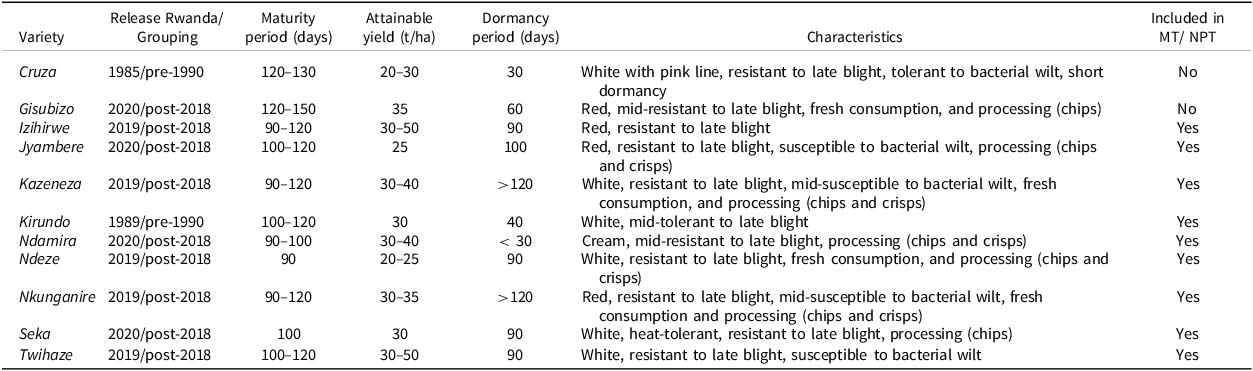
Abbreviations: MT, multi-location trials; NPT, national performance trials
Among eleven varieties tested, Cruza and Kirundo were released in 1985 and 1989, respectively (Table 1). These two varieties are widely recognized among Rwandan potato farmers and were included as local checks to evaluate whether recently released varieties outperform older ones. We will refer to these two varieties as the ‘pre-1990 varieties’. We also tested nine varieties released in Rwanda between 2019 and 2020: Gisubizo, Izihirwe, Jyambere, Kazeneza, Ndamira, Ndeze, Nkunganire, Seka, and Twihaze. We will refer to this set as the ‘post-2018 varieties’. All varieties in this research are described in italics. Variety selection criteria were based on a combination of farmers’ desirable traits like high yield, resistance to late blight, tolerance of bacterial wilt, short dormancy, early maturity, and favourable culinary traits. All eleven varieties are recommended for planting in Rwanda highland environments though they differ in characteristics such as dormancy duration, maturity period, and yield potential (CIP 2021; Lindqvist-Kreuze et al. Reference Lindqvist-Kreuze, Bonierbale, Grüneberg, Mendes, De Boeck and Campos2024) (Table 1).
Of the eleven varieties, nine were tested in multi-environmental trials: National Performance Trials (NPT) and Multi-Location Trials (MT). However, Cruza and Gisubizo were not included in these trials because of limited availability of tuber seeds.
On-farm trial design
The on-farm trial took place over two potato-growing seasons, Season 2021 A (September 2020 to February 2021) and Season 2021 B (March 2021 to July 2021), involving 460 farmers in Rwanda’s main potato-growing regions, Gicumbi and Nyamagabe (Figure 2) (Ferrari et al. Reference Ferrari, Fromm, Scheidegger and Muhire2018; MINAGRI, 2018; Muhinyuza et al. Reference Muhinyuza, Shimelis, Melis, Sibiya and Nzaramba2012; Vinck et al. Reference Vinck, Brunelli, Takenoshita and Chizelema2009). Each farmer received three randomly assigned potato varieties in a balanced incomplete block design following the tricot approach. The varieties were labelled A, B, and C to ensure unbiased testing. Farmers used their typical practices without detailed instructions, simply requested to reserve a portion of their field for the trial. The three varieties were planted sequentially in the same plot, with each subplot containing 40 tubers arranged in four rows of three metres. Participants evaluated the varieties throughout the season and at post-harvest stages (Table 2 and Table S1). The tricot on-farm testing of all 460 incomplete blocks (farms) was treated as one single (multiple-season) trial.
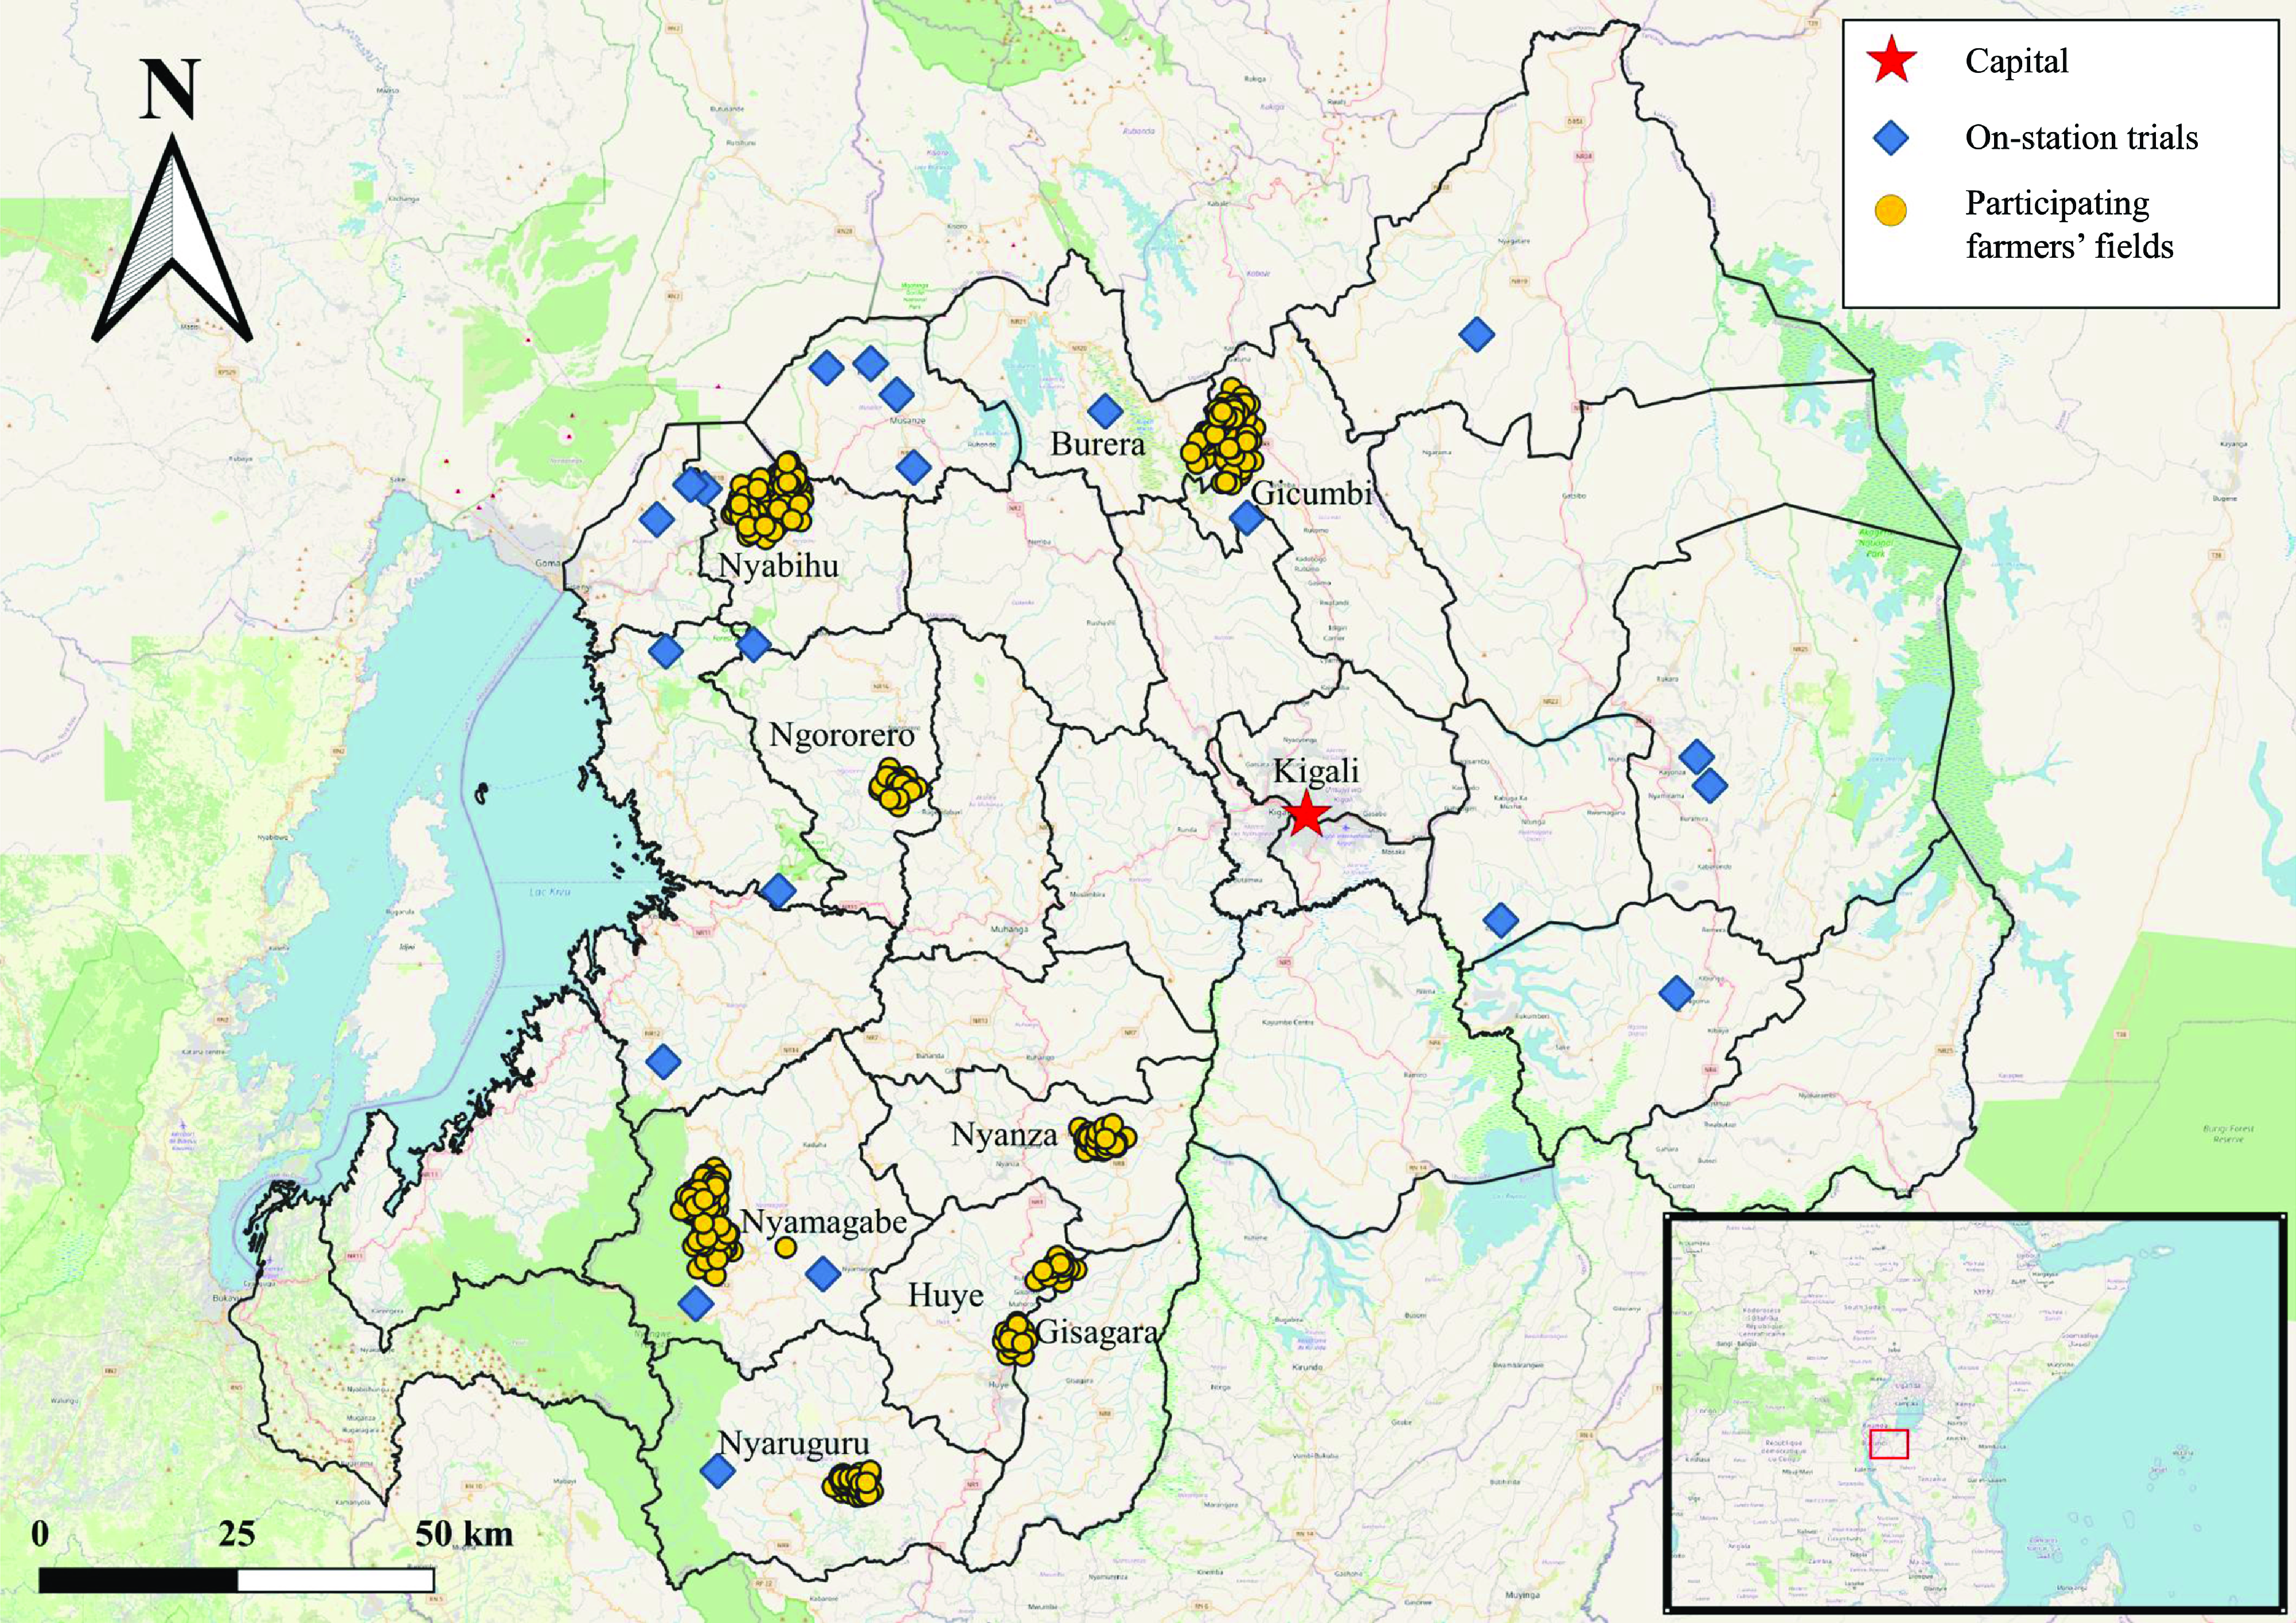
Figure 2. Research regions in Rwanda where potato trials were conducted. Yellow dots indicate the locations of participating farmers’ households in tricot on-farm trial. Blue diamonds indicate the multi-locations of on-station trials. The red star is the capital of Rwanda, Kigali. Source: Modified from OpenStreetMap (https://www.openstreetmap.org).
Table 2. Variables assessed by farmers in the tricot on-farm trial and selected for detailed analysis
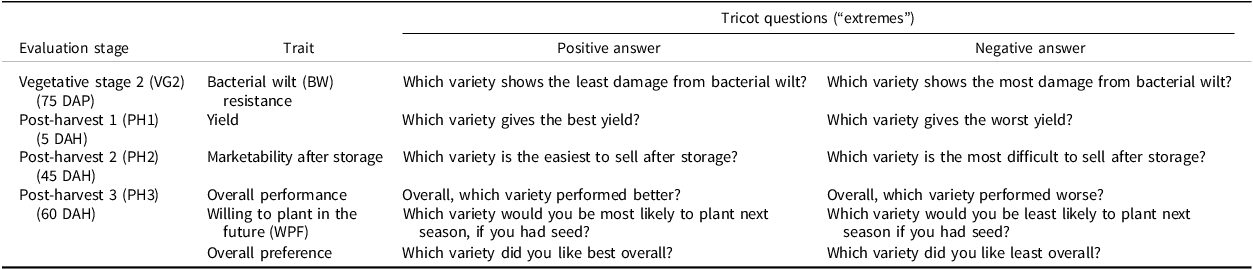
Abbreviations: Bacterial wilt, BW; DAP, days after planting; DAH, days after harvest; PH1, post-harvest 1 stage; PH2, post-harvest 2 stage; PH3, post-harvest 3 stage; WPF, willing to plant in the future.
On-farm trial data collection
Participating farmers evaluated 17 potato traits. For each trait, farmers were asked to rank the three potato samples which they received by identifying the best (first) and the worst (third) based on potato performance, such as the highest and lowest-yielding or the most and least-preferred variety, thereby simplifying the questioning process (Table 2 and Table S1). The middle ranking was deduced from these answers, providing a complete comparative ranking of each set of three varieties. Tricot data collection followed five stages: vegetative stage 1 (VG1), vegetative stage 2 (VG2), post-harvest stage 1 (PH1), post-harvest stage 2 (PH2), and post-harvest stage 3 (PH3) (Table S1). Planting, assessing, and harvesting times varied according to farmers’ individual circumstances.
The first assessment, VG1, occurred 45 days after planting to analyse vegetative traits: plant vigour, resistance to bacterial wilt (BW), and resistance to disease and insects. Farmers identified the varieties with the best and worst growth and those most and least affected by BW and other pests using the tricot questionnaire, focusing on general pest damage with specific attention to BW. The second assessment, VG2, took place 75 days after planting. During VG2, farmers evaluated resistance to BW, diseases, and insects, classifying them similarly to VG1.
Five days after harvesting, PH1 was conducted. Farmers evaluated traits including maturity, total yield, tuber size, tuber appearance, marketability at harvest (MAH), taste, and marketability after storage (MAS). PH2 took 45 days after harvesting, assessing MAS, dormancy, and taste. At PH3, 60 days after harvesting, farmers evaluated dormancy and tuber quality and participated in the final evaluation: overall preference, overall performance, and willingness to plant in the future (WPF). Farmers assessed three experimental varieties and their primary cultivated variety, focusing on overall preference to reveal varietal-adoption intentions.
The dataset was cleaned and pre-processed before analysis by removing severely unclear or conflicting responses from farmers, using quality scores and communicating with local enumerators to ensure data accuracy. From the data of 460 farmers, we excluded five records with missing GPS coordinates and 23 records with significant discrepancies after inspecting for internal consistency. Records with minor discrepancies (e.g., different responses between stages) or incomplete data (missing data for one stage) were not excluded.
Socio-economic data
To investigate the influence of socio-economic factors on farmers’ preferences, we collected data at the household level using the Rural Household Multiple Indicator Survey (RHoMIS) (Hammond et al. Reference Hammond, Fraval, Van Etten, Suchini, Mercado, Pagella, Frelat, Lannerstad, Douxchamps, Teufel, Valbuena and van Wijk2017). This is a standardized survey approach that covers indicators related to income, food security, nutrition, and poverty (Hammond et al. Reference Hammond, Fraval, Van Etten, Suchini, Mercado, Pagella, Frelat, Lannerstad, Douxchamps, Teufel, Valbuena and van Wijk2017; van Wijk et al. Reference van Wijk, Hammond, Gorman, Adams, Ayantunde, Baines, Bolliger, Bosire, Carpena, Chesterman, Chinyophiro, Daudi, Dontsop, Douxchamps, Emera, Fraval, Fonte, Hok, Kiara, Kihoro, Korir, Lamanna, Long, Manyawu, Mehrabi, Mengistu, Mercado, Meza, Mora, Mutemi, Ng’endo, Njingulula, Okafor, Pagella, Phengsavanh, Rao, Ritzema, Rosenstock, Skirrow, Steinke, Stirling, Suchini, Teufel, Thorne, Vanek, van Etten, Vanlauwe, Wichern and Yameogo2020). Among the 460 farmers who participated, 283 were surveyed using the RHoMIS approach. Not all could be reached, due to financial and time constraints. The following socio-economic variables were used in our analysis: respondent sex, whether respondent is household head, education level, type of household, household members, total land area cultivated, amount of land owned, farm labour (RHoMIS 2019). Additionally, we calculated several indicators from the RHoMIS data for further analysis, including potato importance, household assets, crop diversity, agricultural inputs, livestock diversity, livestock TLU score, hunger months count (months of food shortages in the last year), crop income (US $), livestock income (US $), and total farm income (US $).
Environmental data
To analyse the influence of environmental conditions on potato varietal performance, we linked each farmer’s tricot plot GPS data with publicly available environmental data. Although the GPS data did not indicate exact plot locations, they were sufficiently close given the spatial resolution of the environmental datasets.
Temperature and precipitation data were downloaded for the period from planting to harvest. Cultivation durations varied due to individual farmers’ planting and harvesting dates, but on average, cultivation periods were 114 days in season A and 104 days in season B. Since each farmer had a different planting and cultivation period, we matched the actual growing period of each farmer to adjust environmental variables by converting continuous climate data over the period to agrometeorological indicators (de Sousa, van Etten, Neby et al. Reference de Sousa, van Etten, Neby and Solberg2023). We obtained and calculated these data using the R package chirps (de Sousa et al. Reference de Sousa, Sparks, Ashmall, van Etten and Solberg2020) and agrometeorological indicators (e.g., 90th percentile of daytime temperature, maximum and minimum daytime temperature, total precipitation) using the R package climatrends (de Sousa, van Etten, Neby et al. Reference de Sousa, van Etten, Neby and Solberg2023). For the VG1 (45 days) and VG2 (75 days) trait assessments, temperature and precipitation data up to the evaluation day were considered for the corresponding evaluation date to reflect short-term environmental effects. This approach enabled analyses that account for the actual environmental conditions of each farm rather than simple seasonal averages.
Soil data were obtained from SoilGrids (Hengl et al. Reference Hengl, De Jesus, MacMillan, Batjes, Heuvelink, Ribeiro, Samuel-Rosa, Kempen, Leenaars, Walsh and Gonzalez2014), including covariates such as soil organic carbon content, cation exchange capacity, total nitrogen, pH (water), and soil classification.
On-station trial data
National Performance Trials (NPT) and Multi-location Trials (MT) were performed in collaboration with CIP (International Potato Center) and RAB (Figure 1). Their main purpose was to test varietal adaptation to different agro-ecological zones in Rwanda. In both trials, the same crop management was practised. NPT covered season 2018B (March 2018 to July 2018) and season 2019A (September 2018 to February 2019). The MT trial was only conducted during the 2018B season because the NPT also covers Season A.
Both MT and NPT were established following a randomized complete block design with three replicates. The spacing between plants and rows was 30 cm and 80 cm, respectively. Four-row plots of 10 plants, each with a total of 40 plants were planted. Tuber planting depth was 6–8 cm, and the sowing rate was one tuber per hill. Kinigi or Kirundo was used as a border to surround the plot, to minimize or eliminate edge effect. The distance between border rows and experimental plots was 1.5m. On-station trials were manually dehaulmed at full maturity, about 120 days after planting. Trial potatoes harvested at 135 days after planting and harvested samples for each variety were assessed.
Based on the on-station trial data, we included seven traits (Table S2) in this study: (i) flowering degree/extent, (ii) plant vigour, (iii) tuber number per plant, (iv) tuber weight (tons/ha), (v) late blight severity, (vi) potato virus severity, and (vii) BW resistance. Trait evaluations followed CIP’s potato measurement guidelines composed by de Haan et al. (Reference De Haan, Forbes, Amoros, Gastelo, Salas, Hualla, De Mendiburu and Bonierbale2014). To report, we use the standardized terminology of the Crop Ontology (https://cropontology.org/), except for some differences, as indicated in Table S2.
The MT and NPT trial data were used to calculate the genotypic values of each variety by using linear mixed models and then used as item covariates for the Plackett-Luce model. However, before calculating genotypic values, we partitioned the on-station trial data using environmental covariate thresholds derived from the results of the Plackett-Luce trees. This stratification aimed at aligning environmental conditions between on-station and on-farm trial, to reduce uncertainties related to environmental input data (Aggarwal Reference Aggarwal1995). As not all varieties were grown in season 2019A and the study was unable to apply the same model, data collected from that season were omitted.
On-station MT and NPT trials had a substantial overlap with varieties tested in the tricot on-farm experiment, which made it possible to jointly analyse the data. Nine varieties had been grown both in the on-station trials and tricot experiment: Cyerekezo, Izihirwe, Jyambere, Kazeneza, Ndamira, Ndeze, Nkunganire, Seka, and Twihaze. Potato varieties grown only in on-station trials were excluded in this analysis (CIP398193.511, CIP388676.1, CIP398190.200, and CIP393079.4). On the other hand, the two varieties, Cruza and Gisubizo, were only tested in the tricot experiment due to limited availability of tuber seeds. As these varieties were untested in the field trial, their genotypic values were imputed using the average genotypic values of the other nine varieties, calculated separately for each of the seven traits (Table S2). Furthermore, genotypic values were calculated from mixed effects models (Best Linear Unbiased Prediction, Cumulative Link Mixed Models, and General Linear Mixed Models using Template Model Builder). The values were subsequently standardized to make the parameters of the Plackett-Luce alternating directions method of multipliers (PLADMM) model more interpretable (see Influence of genotypic values on on-farm rankings section).
Data analysis
Analysing ranking data from on-farm trial
We calculated log-worth values from the ranking data for each variety using the Plackett-Luce model as implemented in the R package PlackettLuce (Turner et al. Reference Turner, van Etten, Firth and Kosmidis2020). The estimated log-worth values are related to the probability that a given variety outperforms all other varieties. Central to the Plackett-Luce model is Luce’s Choice Axiom, the idea that the probability of one item beating another item is independent from the presence or absence of any other items in the choice set (Luce Reference Luce1959, Reference Luce1977).
For the analysis, we selected key variables, yield and MAS, which were identified as the most important traits influencing farmers’ preference: WPF (Tables 2 and 4). Table 2 shows questions of these variables, as well as farmers’ preferences of potato varieties (overall performance, WPF, and overall preference). From among these key variables (Table 4), the study focused on yield and MAS (PH2). Additionally, we analysed results for the trait of BW resistance, which farmers consider important because bacterial wilt is one of the major constraints to Rwanda’s potato production (Uwamahoro et al. Reference Uwamahoro, Berlin, Bucagu, Bylund and Yuen2018).
Table 3. Plackett-Luce model worth estimates of farmers’ final evaluation of potato varieties tested in Rwanda
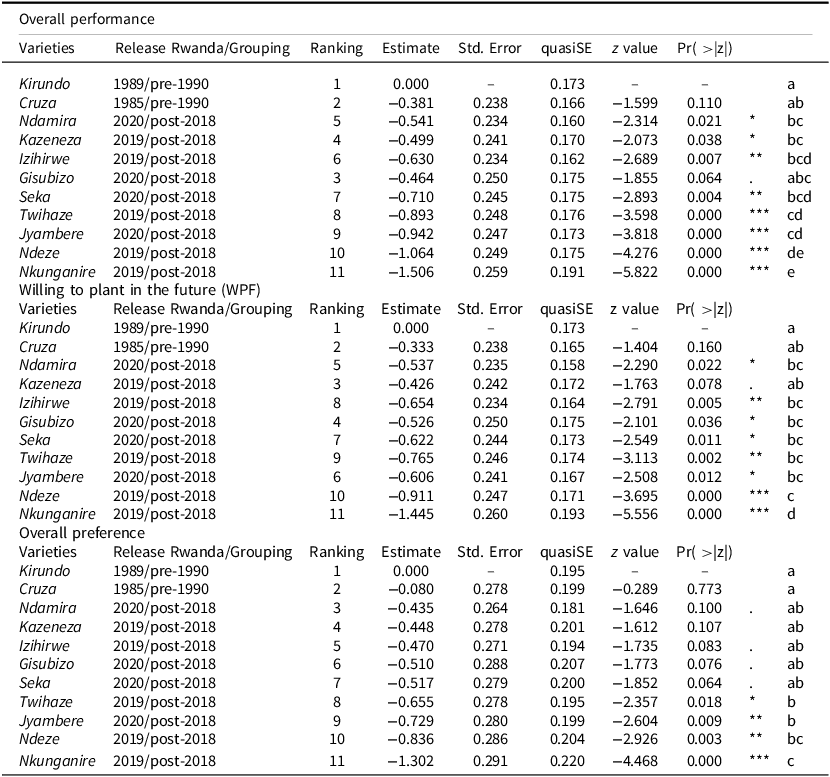
Note: Varieties are sorted from highest estimate values (on the top) to lowest values (at the bottom). Significance level difference from worth = 0, or Kirundo. 0 ‘***’ 0.001 ‘**’ 0.01 ‘*’ 0.05 ‘.’ 0.1 ‘ ’ 1. Kirundo was used as a reference variety that makes it easy to understand by comparing whether the new genotype is better or worse than the used variety. Different letters indicate significant differences between the performance of varieties. Letters were allocated based on potato varieties’ p-value distance under Kirundo reference check and the 0.05 threshold
Table 4. Correlations between three farmers’ preferences and 17 underlying traits. Correlations are calculated using the Kendall rank correlation coefficient (τ). The p values show the significance of the z-test
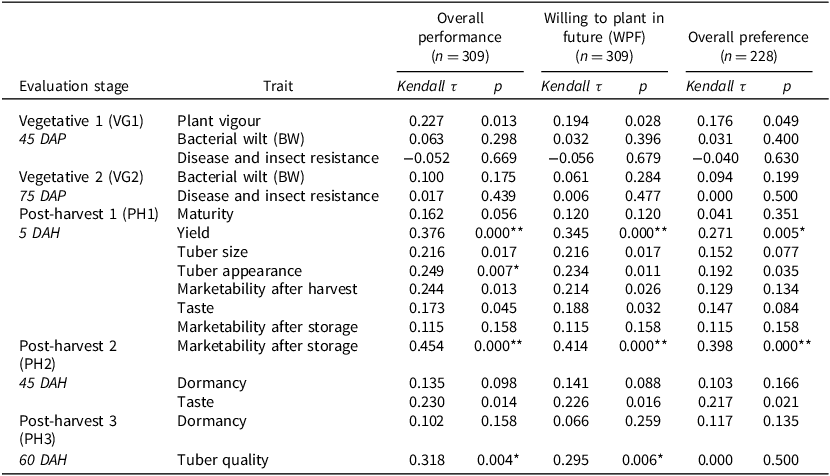
Note: Significance level difference. 0 ‘***’ 0.001 ‘**’ 0.01 ‘*’ 0.05 ‘.’ 0.1 ‘ ’1. Abbreviations: DAP, days after planting; DAH, days after harvest.
Influence of environmental and socio-economic covariates on on-farm rankings
Socio-economic and environmental data linked to each plot were analysed to identify factors influencing on-farm variety performance and farmers’ preferences, using the Plackett-Luce model with recursive partitioning (Turner et al. Reference Turner, van Etten, Firth and Kosmidis2023; Strobl et al. Reference Strobl, Wickelmaier and Zeileis2011). This algorithm identifies the most influential covariate and splits the dataset into subsets based on statistically significant differences, continuing until no further significant splits are found. The result is a Plackett-Luce Tree. For the splits, we set the cut-off value to α = 0.1 (a minimum cut-off threshold at the 90% confidence level) and a minimum group size of 25. Only in the case of BW resistance, did we use a stricter cut-off value of α = 0.07 to simplify the resulting Plackett-Luce Tree. In addition, for covariate variable selection to avoid multicollinearity among many variables, variables showing small deviations from the model were selected through forward selection. We analysed the influence of covariates on three selected key variables: bacterial wilt resistance, yield, and MAS (PH2) (Table 2). As only a subset of the plots had associated socio-economic data, we performed separate analyses for socio-economic and environmental covariates.
Influence of genotypic values on on-farm rankings
We estimated genotypic values for each variety from the on-station trial data, estimating best linear unbiased predictors (BLUPs) for two variables: tuber number per plant and tuber weight. We used the linear mixed model from the lme4 package in R (Bates et al. Reference Bates, Mächler, Bolker and Walker2015). In this research, the model set test clone was considered as random effects, and other factors like sites and replications were decided as fixed effects. Furthermore, the model reflected the fixed nesting effect between site and replication. BLUPs of two traits were calculated to know values for predicting genotypic value, tuber number per plant, and tuber weight, of all varieties tested in on-station trials. BLUP models used in this research were based on the following equation:
 $${y_{ijk}} = {\rm{ }}\mu {\rm{ }} + {\rm{ }}{\beta _j} + {\rm{ }}{b_i} + {\rm{ }}{c_{k(j)}} + {\rm{ }}{\varepsilon _{ijk}}$$
In Equation (1), y ijk is the mean genotypic value of clone i in site j and replication k, µ is the overall mean, β j is the fixed effect of site j, b i is the random effect of clone i, c k(j) is the fixed nesting effect of replication k within site j, and ε ijk is the error term. After calculating genotypic values, these values were standardized to have the standard normal distribution (∼N(0,1)) for easy comparison.
To analyse ordinal scale variables (Table S2) pertaining to flowering degree and plant vigour, we employed cumulative link mixed models (CLMM) for the purpose of modelling and evaluating these ordinal scale variables (Christensen Reference Christensen2018; Gruner et al. Reference Gruner, Witzke, Flath, Eifler, Schmiedchen, Schmidt, Gordillo, Siekmann, Fromme, Koch, Piepho and Thomas2022; Feldmann et al. Reference Feldmann, Hardigan, Famula, Lopez, Tabb, Cole and Knapp2020). This model can extend the familiar regression framework commonly associated with linear model analyses to the domain of ordinal or categorical data (Christensen Reference Christensen2018; Ning et al. Reference Ning, Ho, Støer, Lim, Wee, Hartman, Reilly and Tan2021; Taylor et al. Reference Taylor, Rousselet, Scheepers and Sereno2022). CLMM leverages the inherent cumulative probabilities of ordinal data, with a specific emphasis on the delineation thresholds that demarcate the ordinal categories (Christensen Reference Christensen2018; Ning et al. Reference Ning, Ho, Støer, Lim, Wee, Hartman, Reilly and Tan2021; Taylor et al. Reference Taylor, Rousselet, Scheepers and Sereno2022). In this study, the CLMM model was employed, utilizing a logistic regression approach with the following formula:
 $$logit({y_{ijk}} \le l) = {\rm{ }}\mu {\rm{ }} + {\rm{ }}{\beta _j} + {\rm{ }}{b_i} + {\rm{ }}{c_{k(j)}} + {\rm{ }}{\varepsilon _{ijk}}$$
Although similar to Eq1, CLMM formula, Eq. (2), provides the log odds (logit) to respond y ijk to fall in category l (l = 0,1 …, 7 (flowering degree) & = 1, 2 …, 9 (plant vigour)). However, CLMMs consider fixed-effect intercept as 0 (Taylor et al. Reference Taylor, Rousselet, Scheepers and Sereno2022) and genotypic value of flowering degree and plant vigour are only reflecting the clone random effect and the mean genotypic value of the clone. CLMM was conducted by using the R package ordinal (Christensen Reference Christensen2018). All CLMM models were fitted with the adaptive Gauss-Hermite quadrature approximation, and after all values were standardized.
In the case of genotypic variables that showed biotic stress reaction traits in on-station trial data (late blight severity, potato virus resistance, and BW resistance) (Table S2), there are zero-inflation issues. Therefore, a general linear mixed models approach using a template model builder (glmmTMB) was applied to solve the zero-inflation by using the glmmTMB package in R (Brooks et al. Reference Brooks, Kristensen, Van Benthem, Magnusson, Berg, Nielsen, Skaug, Machler and Bolker2017). GlmmTMB modal formulae follow with same formula (1). However, the data family was set to Beta and logit was substituted in the formula, following equation (3). Since then, it was also standardized to have a standard normal distribution, like any other genotypic variable.
 $$logit({y_{ijk}}) = {\rm{ }}\mu {\rm{ }} + {\rm{ }}{\beta _j} + {\rm{ }}{b_i} + {\rm{ }}{c_{k(j)}} + {\rm{ }}{\varepsilon _{ijk}}$$
We analysed the influence of genotypic values on on-farm performance by using the Plackett-Luce Alternating Directions Method of Multipliers (PLADMM) algorithm developed by Yildiz et al. (Reference Yildiz, Dy, Erdogmus, Kalpathy-Cramer, Ostmo, Campbell, Chiang and Ioannidis2020). We used the PLADMM algorithm as implemented in the PlackettLuce R package (Turner et al. Reference Turner, van Etten, Firth and Kosmidis2020; Turner, Reference Turner2023). In PLADMM, each log-worth value is a linear combination of the item covariates. We used the genotypic values as item covariates. However, item covariates have collinearity between them. Therefore, we chose variables to compute in PLADMM by using forward selection based on the Akaike information criterion (AIC).
Supporting software
The on-farm evaluation data were obtained through the ClimMob platform (https://climmob.net; Quirós et al. Reference Quirós, de Sousa, Steinke, Madriz, Laporte, Arnaud, Müller and van Etten2024). Arranging and cleaning the data relied on the R packages gosset (de Sousa et al. Reference de Sousa, Brown, Steinke and van Etten2023a), tibble (Müller and Wickham Reference Müller and Wickham2023), and dplyr (Wickham et al. Reference Wickham, François, Henry, Müller and Vaughan2023). Statistical analyses were done using the packages: gosset (de Sousa et al. Reference de Sousa, Brown, Steinke and van Etten2023a), PlackettLuce (Turner et al. Reference Turner, van Etten, Firth and Kosmidis2020; Turner Reference Turner2023) ClimMobTools (de Sousa et al. Reference de Sousa, van Etten and Madriz2023b), lme4 (Bates et al. Reference Bates, Mächler, Bolker and Walker2015), glmmTMB (Brooks et al. Reference Brooks, Kristensen, Van Benthem, Magnusson, Berg, Nielsen, Skaug, Machler and Bolker2017), ordinal (Christensen, Reference Christensen2018) and car (Fox and Weisberg 2019). Figures were produced using packages ggplot2 (Wickham et al. Reference Wickham, Chang and Wickham2016) and gplots (Warnes et al. Reference Warnes, Bolker, Bonebakker, Gentleman, Huber, Liaw and Venables2022). The retrieval and analysis of climate environment, soil and RHoMIS data were performed using the following R packages: nasapower (Sparks 2018), climatrends (de Sousa et al. Reference de Sousa, van Etten and Madriz2023b), chirps (de Sousa et al. Reference de Sousa, Sparks, Ashmall, van Etten and Solberg2020), raster (Hijmans, Reference Hijmans2023), rgdal (Bivand et al. Reference Bivand, Keitt and Rowlingson2023), ggplot2 (Wickham et al. Reference Wickham, Chang and Wickham2016), and stringr (Wickham. Reference Wickham2022). All the data and R codes used in this study are available through GitHub (https://github.com/AgrDataSci/potato-oft-genetic-gain).
Results
Rwandan farmers prefer the tested pre-1990 varieties over post-2018 ones, with some post-2018 varieties marginally outperforming farmer-grown varieties
Figure 3 presents a heatmap of farmers’ observations and preferences from the on-farm potato trial. It displays the calculated ranks for each variety across all 17 traits and three final evaluations, considering their average performance across the study areas. The two tested pre-1990 varieties, Kirundo and Cruza, stand out as the most preferred, irrespective of the way in which farmers’ preferences were elicited: overall performance, WPF, or overall preference (Table 3). These three final appreciations showed high, statistically significant correlations among the metrics (Table S3), indicating ranking consistency with slight variations. Kirundo outperformed the other varieties in several traits except for disease and insect resistance at VG2. Cruza showed strong performance for most traits except for tuber maturity, size, appearance, MAH, and MAS at PH1. On the other hand, Rwandan farmers consistently ranked Ndeze and Nkunganire as the least-preferred potato varieties (Table 3).
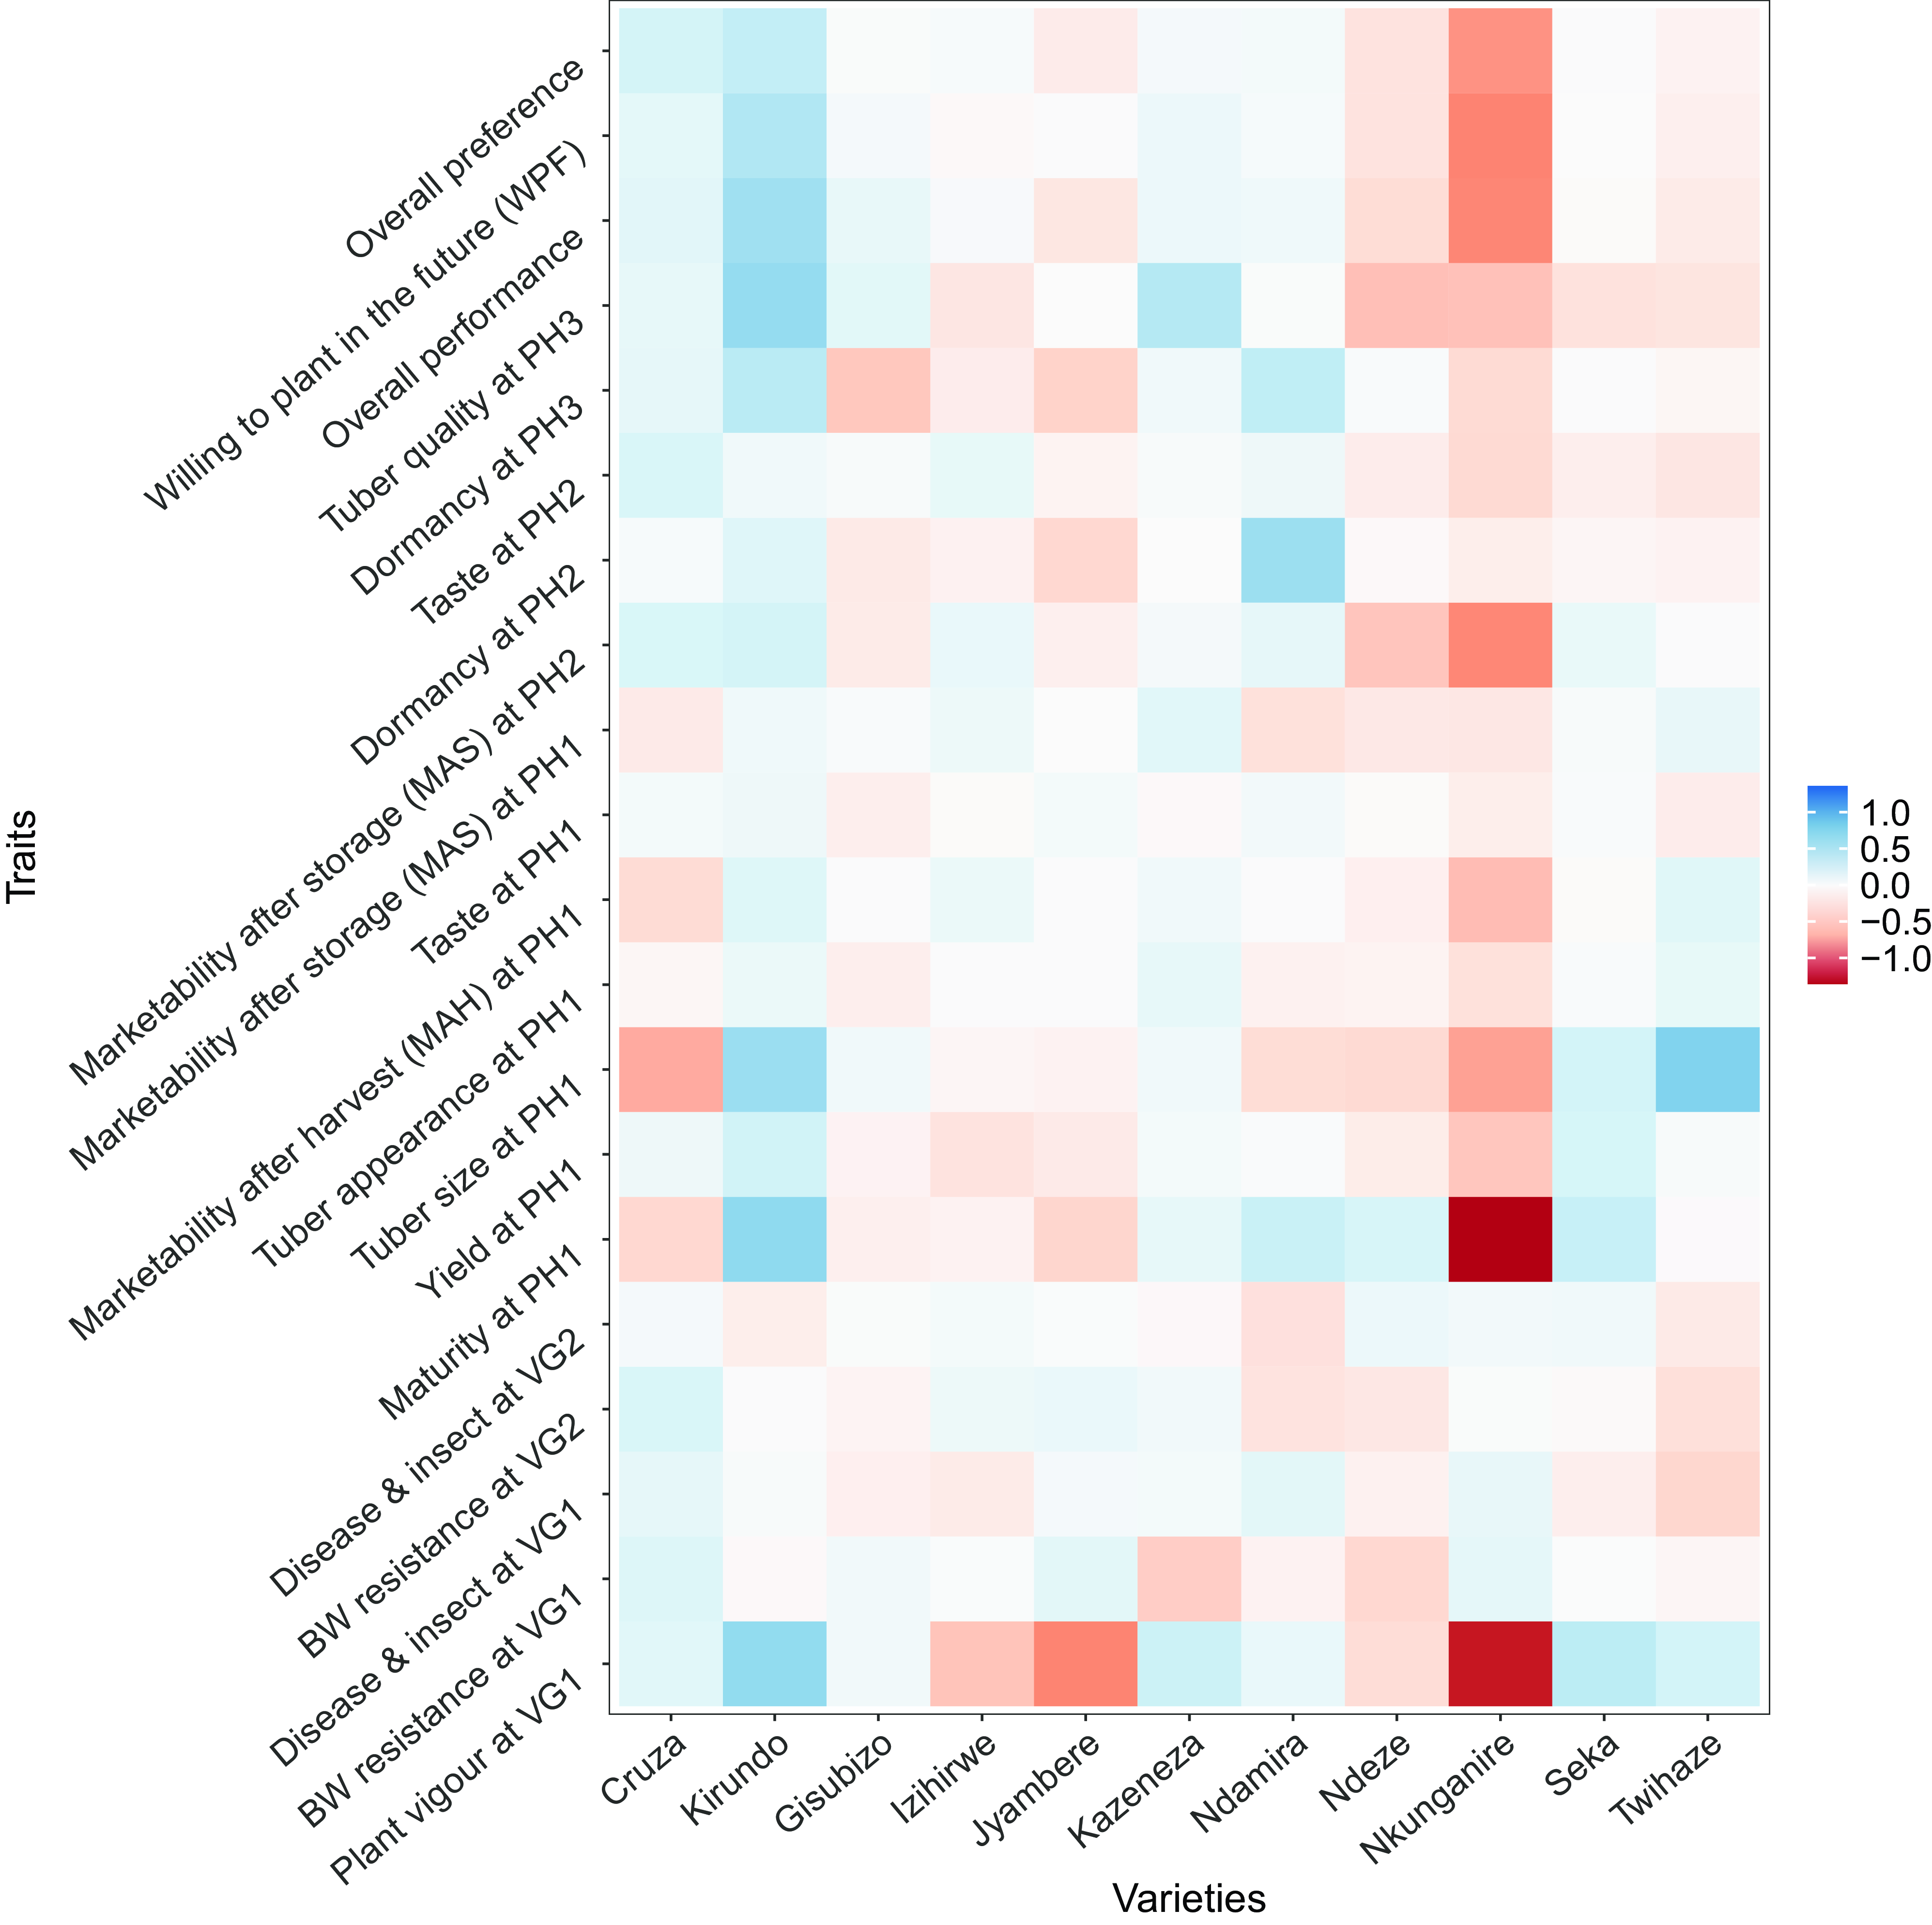
Figure 3. Heatmap of the log-worth estimates from Plackett-Luce model on Rwandan farmers’ rankings of potato traits. Traits were measured during the five different stages from vegetative (VG) to post-harvest (PH). The colour intensity was based on rescaled log-worth estimates by trait to a scale −1 to 1 for the spacing between values, so that differences are more contrasting.
However, when farmers evaluated overall preference between trial varieties and farmer-grown varieties, treated as a single entity representing the primary potato variety each farmer cultivates for use or sale, the results revealed a slightly different pattern (Table S4). Tested old varieties performed slightly better than farmer-grown varieties, but the differences were only marginally significant. Similarly, among the post-2018 varieties, Gisubizo, Izihirwe, and Kazeneza were preferred over farmer-grown varieties, though the differences were not statistically significant. Conversely, Ndamira, Ndeze, and Nkunganire were less preferred. These results reflect average performance across the study area and do not consider environmental and socio-economic factors, which are discussed in detail in On-farm yield is associated with seasonal temperature and On-station yield performance does not reliably predict on-farm performance sections.
Farmers’ potato variety preferences are mainly influenced by marketability and yield
We calculated the Kendall tau correlation between three final appreciations and each of the other 17 traits to know what traits influence farmers’ varietal preference (Table 4). MAS (PH2) presented the highest correlation value (Overall performance: τ = 0.454, WPF: τ = 0.414, and Overall preference: τ = 0.398) in all three preferences. Also, agronomic variables, yield (PH1) and plant vigour (VG1) showed correlation with farmers’ preferences. Especially, yield presented second highest correlation value (Overall performance: τ = 0.376, WPF: τ = 0.345, and Overall preference: τ = 0.271). Subsequently, farmers’ preferences were correlated with potato qualitative aspects like tuber size (PH1), tuber appearance (PH1), MAH (PH1), taste (PH1 and PH2), and tuber quality (PH3). Although overall performance and WPF are considered important components of potato marketability, such as tuber quality (Kolech et al. Reference Kolech, De Jong, Perry, Halseth and Mengistu2017; Mudege et al. Reference Mudege, Mayanja, Nyaga, Nakitto, Tinyiro, Magala, Achora, Kisakye, Bamwirire, Mendes and Muzhingi2021; Muhinyuza et al. Reference Muhinyuza, Shimelis, Melis, Sibiya and Nzaramba2012), overall preference showed no correlation with tuber quality (τ = 0.000) (Table 4). This result is largely due to the degree of missing data for this combination of variables. Thus, marketability was analysed in our research instead of the tuber quality. The correlation between final preferences and the underlying traits may be influenced by mutual influences between traits, as they reflect partially overlapping concepts or have common underlying causal factors. Therefore, we analysed the pairwise correlation throughout all traits. Figure S1 presents four main clusters of traits.
Marketability has the greatest impact on farmers’ future adoption of potato varieties, and it can be divided according to the farmers’ point of view related to taste, tuber shape, and size influencing the decision on selling or consumption. A second driver of potato adoption by farmers can be yield. Thirdly, the traits of diseases and insect resistance do not directly influence final preference but are important objectives for breeding and potato cultivation. In our subsequent, three sets of traits (yield, marketability, and BW resistance) are finely analysed to understand farmers’ perspectives and variety adoption. In this analysis, we focus on external factors encompassing farmers (environmental and socio-economical) and the expression of potato varieties depending on different environments.
On-farm yield is associated with seasonal temperature
Unlike the Plackett-Luce model results in Rwandan farmers prefer the tested pre-1990 varieties over post-2018 ones, with some post-2018 varieties marginally outperforming farmer-grown varieties section, which accesses average performance across study areas, Figure 4A presents potato yield performance at PH1 under specific environmental conditions identified by the Plackett-Luce Tree (PLT) using environmental covariates. The model split the dataset into two subsets with different ranking patterns at a 90th percentile of day temperature of 23.75 °C. Environments that exceeded this value (node 3) experienced day temperatures of more than 23.75 °C during at least 10% of the days.
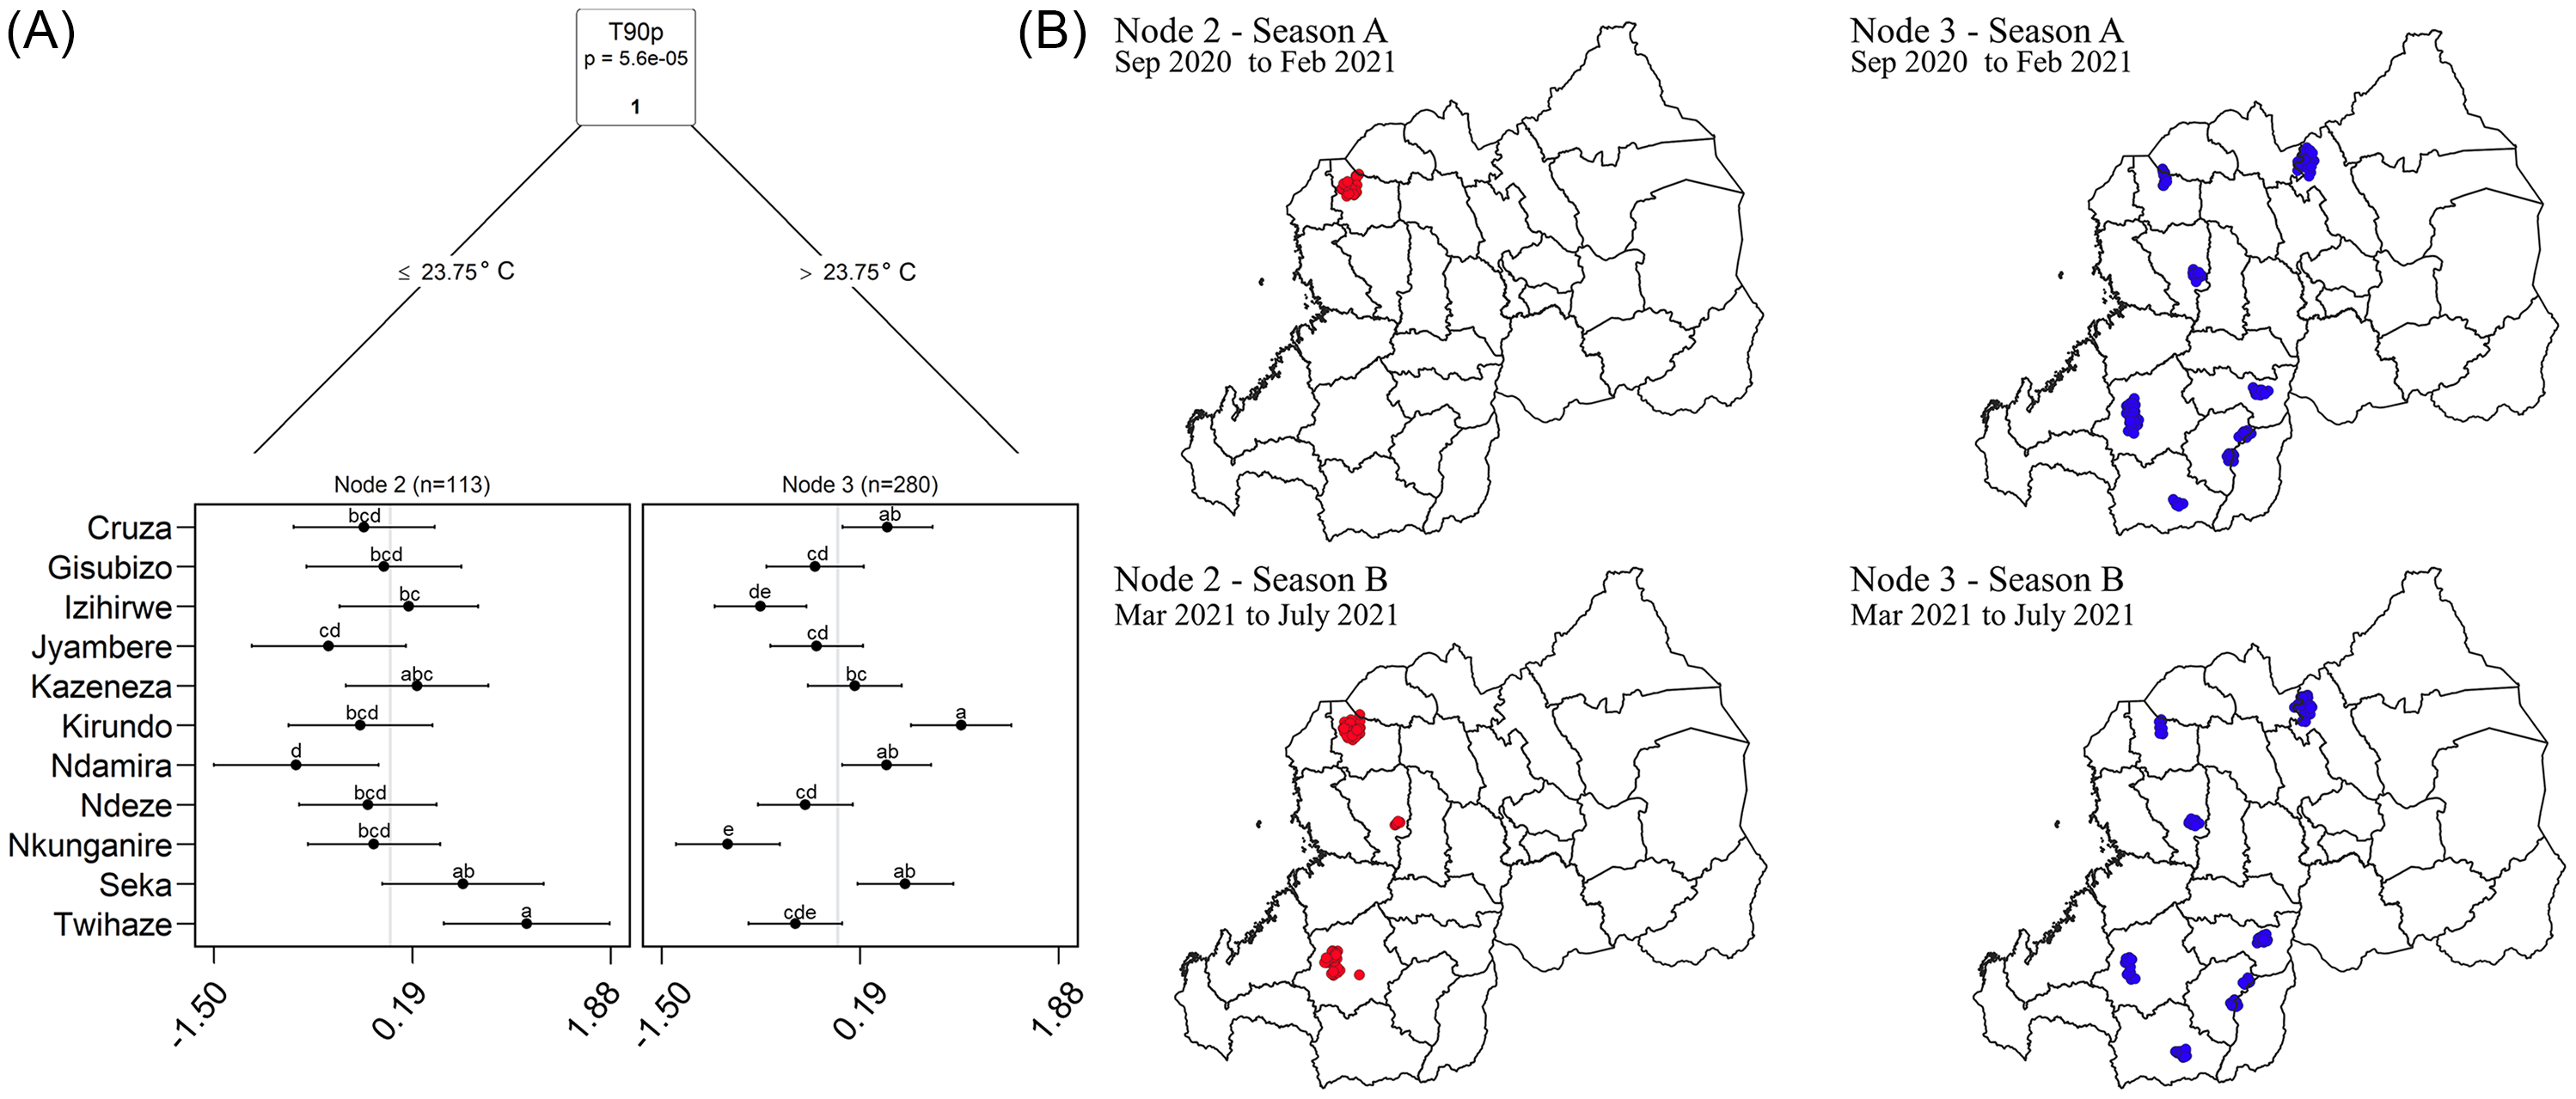
Figure 4. A) Plackett-Luce tree showing yield log-worth values with environmental covariates: temperature, soil, precipitation, and phenology data. The x-axis of each panel shows the probability of winning varieties. Dots and bar present winning estimate and quasi-standard error. Vertical lines in each panel indicate the average value of winning probability (1/number of varieties). In this case, the model selects covariate factors; T90p, the 90th percentile of day temperature (in °C). B) Rwanda season maps display how nodes differ by seasons (season A: from Sep 2020 to Feb 2021, and season B: Mar 2021 to July 2021) Different letters indicate significant differences between the performance of varieties. Letters were allocated based on potato varieties’ p-value matrix distance under the 0.05 threshold.
Under cooler conditions (node 2), Twihaze was the most preferred by the farmers, but this variety did not differ significantly from the next-highest ranked varieties, Kazeneza, Ndamira, and Seka received the lowest worth value for yield under cool conditions. Under warmer conditions, the variety Kirundo was ranked as the highest-yielding variety, but it did not show a significant difference from the varieties Cruza, Ndamira, and Seka.
These findings indicate that the older varieties, Kirundo and Cruza, were preferred under warmer conditions and across many regions of Rwanda (node 3). Notably, a much larger number of farmers (n = 280) were located in these warmer environments, compared to only 113 farmers in the cooler subset (node 2). Given that Kirundo and Cruza have demonstrated stable yield and broad adaptability across Rwanda (Muhinyuza et al. Reference Muhinyuza, Shimelis, Melis, Sibiya and Nzaramba2012; Placide et al. Reference Placide, Theophile, Vandamme, Claude and Thiago2022), the unbalanced distribution across PLT nodes – combined with the widespread suitability of these older varieties – may have influenced the overall rankings in Rwandan farmers prefer the tested pre-1990 varieties over post-2018 ones, with some post-2018 varieties marginally outperforming farmer-grown varieties section, potentially contributing to increase the worth values. This geographic pattern is further illustrated in Figure 4B, which shows how plots assigned to each node are distributed across Rwanda by season. Cooler conditions (node 2) occurred only in a small cluster of the plots in season A, but occurred across a wider area during season B, so the pattern is likely not due to another underlying spatial variable. Therefore, the observed differences in performance are likely due to differential adaptation to seasonal temperature.
On-station yield performance does not reliably predict on-farm performance
To understand the impact of temperature across the potato varieties, a PLADMM model separately estimated the effect of genotypic values on farmers’ assessments of yield (Table 5). Under cool conditions (node 2), potato varieties with lower on-station tuber weight (p = 0.005) were ranked higher by farmers for yield. Under warm conditions (node 3), potato varieties with a higher on-station virus severity (p = 0.002) and tuber number per plant (p = 0.007) were ranked higher by farmers for yield. The results for yield in node 2 and virus severity in node 3 are contrary to the expected relationships. Only the positive association between on-station tuber number and on-farm yield in node 3 has the expected sign.
Table 5. PLADMM results of the influence of on-station genotypic values of potato traits on on-farm potato yield assessed by farmers. Results are shown for two different environments, cooler conditions, and warmer conditions (see Figure 4A). Within each node, a PLADMM model was created by selecting variables through a forward selection procedure
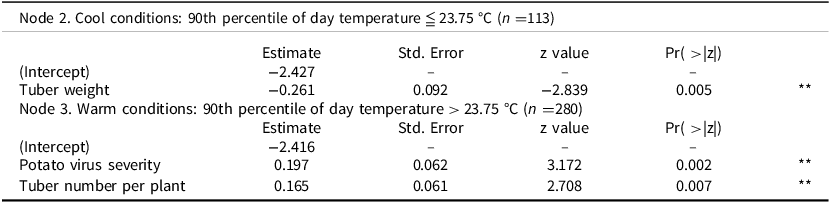
Note: Significance levels 0 ‘***’ 0.001 ‘**’ 0.01 ‘*’ 0.05 ‘.’ 0.1 ‘ ’ 1.
Yield is complex, so with just one season of data, we also examined a simpler trait: the pattern for bacterial wilt (BW) (Figure S2 and Table S5). The relevant environmental covariates were growing degree-days (GDD) of the season (which reflects average temperatures), and the 10th percentile of night temperatures (T10p). Bacterial wilt severity is indeed known to be influenced by seasonal temperature (Muthoni et al. Reference Muthoni, Shimelis, Melis and Kinyua2014; Martin and French Reference Martin and French1985) but no significant correlation was found with on-station BW resistance.
Marketability perceptions depend on farmers’ crop income
We analysed marketability (MAS at PH2) with a PLT involving all socio-economic household variables. The forward selection algorithm identified crop income as the most influential covariate in explaining marketability ranking patterns across groups (Figure 5). Crop income explains the farmers’ total earnings from crop sales over the last 12 months (converted to USD values). The PLT model splits the dataset based on significant crop income value and creates three sub-nodes.
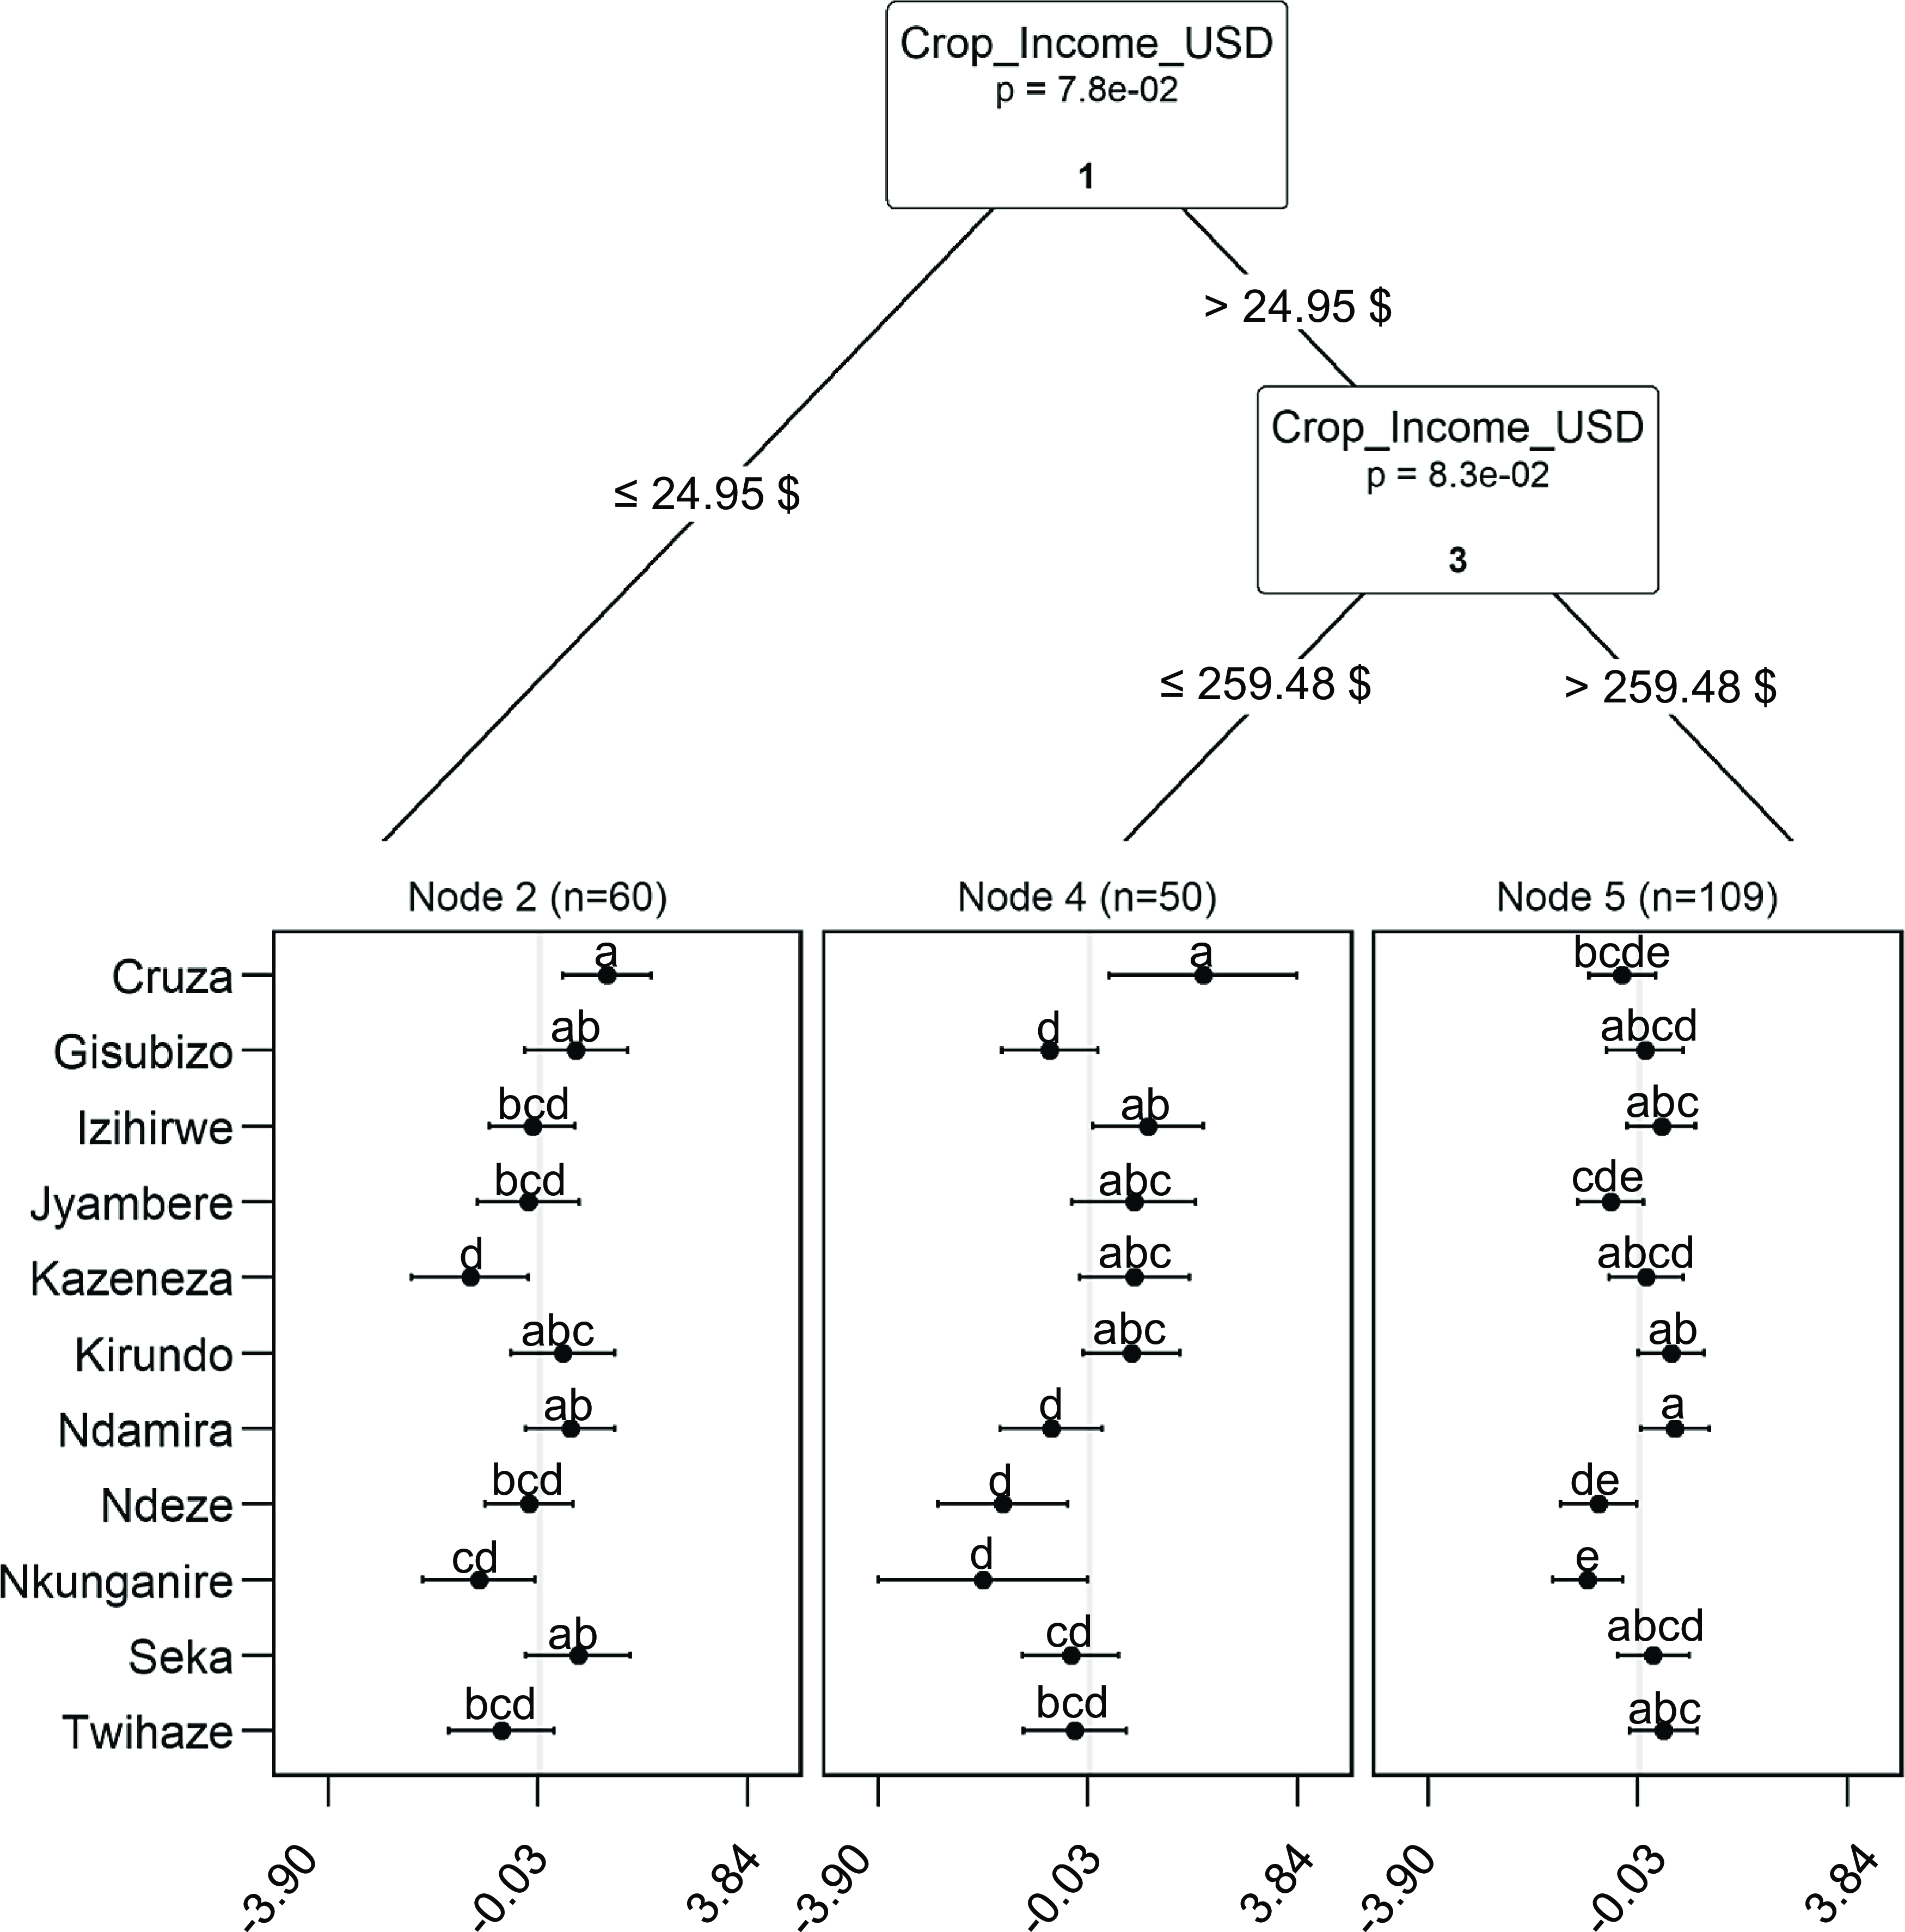
Figure 5. Plackett-Luce Tree showing log-worth values of marketability at PH2 (45 DAH) with socio-economic household covariates. The x-axis of each panel shows the probability of winning varieties. Dots and bar present winning estimate and quasi-standard error. Vertical lines in each panel indicate the average value of winning probability (1/number of varieties). In this case, the model selects a covariate factor; crop income (US $), earned income from crop sales in the last year. Different letters indicate significant differences between the performance of varieties. Letters were allocated based on potato varieties’ p-value matrix distance under the 0.05 threshold.
The variety ranking in node 5 is closer to the average ranking than other nodes, because it has the highest weight on average being the largest subsample. This analysis shows substantial variation between income groups. Farmers in households that earn less than 24.95 USD per year from crops tend to prefer Cruza, while farmers who earn more than 259.48 USD per year from crops tend to prefer Cruza less than average. The group in between also prefers Cruza on average but shows a large variability in this regard. This reveals that Cruza is regarded mainly as highly marketable by households that do not sell much on the market, and therefore are likely to sell few potatoes or mainly locally to neighbours. It is likely that farmers who sell more are more likely to know about marketability under commercial conditions and reveal that Cruza is much less marketable than would be expected from the average results. Farmers with high crop incomes prefer Ndamira, although this variety did not significantly differ from Gisubizo, Izihirwe, Kazeneza, Kirundo, Seka, and Twihaze.
To further investigate farmers’ potato variety selection based on marketability, we computed the correlation between marketability and traits for each income group. The underlying five traits included five traits that correlated with WPF and overall performance (yield, tuber size, tuber appearance, taste at PH1, and taste at PH2) and two additional traits (maturity and dormancy) that Rwandan farmers may consider in relation to marketability (Muhinyuza et al. Reference Muhinyuza, Shimelis, Melis, Sibiya and Nzaramba2012; Ferrari et al. Reference Ferrari, Fromm, Scheidegger and Muhire2018) (Table 6). The low crop-income farmers (node 2) show a significant correlation of marketability with taste (PH2) (τ = 0.478), tuber appearance (τ = 0.320), yield (τ = 0.309), taste (PH1) (τ = 0.298), and tuber size (τ = 0.242). Intermediate crop-income farmers (nodes 4) show that taste (PH2) (τ = 0.347) and yield (τ = 0.304) are highly significantly correlated with marketability. On the other hand, yield (τ = 0.376) significantly and highly correlates with marketability for high crop-income farmers (nodes 5). Subsequently, tuber appearance (τ = 0.284), tuber size (τ = 0.266), and taste (PH2) (τ = 0.248) are followed. Maturity and dormancy do not show significance for any of the crop-income groups.
Table 6. Correlations between marketability after storage at PH2 and seven other traits which influence farmers’ marketability preferences, for different crop income groups (for the groups, see the nodes in Figure 5). Correlations are calculated using the Kendall rank correlation coefficient (τ). The p values show the significance of the z-test
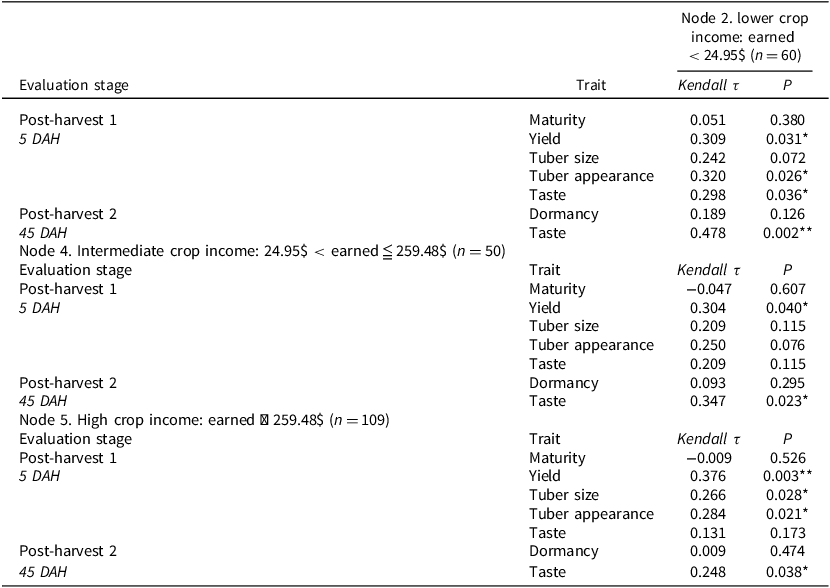
Note: Significance values: *** <0.001; ** <0.01; * <0.05;. <0.1.
These findings imply that low-sales farmers prioritize taste and appearance, while commercial farmers value yield over consumption characteristics. Farmers in node 2 are more likely to have opinions closer to rural consumers. This differentiation is important for breeding decision-making, as it reveals a trade-off between production and consumption-driven preferences.
Although not covered in detail in the main paper, we additionally analysed yield, tuber appearance, and taste (PH2) that highly correlate with marketability, using the PLT with socio-economic covariates. Potato yield and tuber appearances are associated with agricultural inputs and farmers’ gender, respectively. On the other hand, PLT taste (PH2) did not show any socio-economic covariates (See Figure S3 and Figure S4).
Discussion
Suitability and adoption potential of varieties
Our study’s findings demonstrate the usefulness of participatory on-farm evaluation in understanding farmers’ preferences and their decision-making processes regarding the adoption of those preferred varieties. In our research, pre-1990 varieties Kirundo and Cruza received generally high favorability scores across Rwandan farmers (Figure 3 and Table 3). Although post-2018 varieties Gisubizo and Kazeneza, ranked third and fourth, respectively (Table 3), they exhibit no statistically significant differences compared to farmer-grown varieties and old varieties (Table S4). However, they still can be potential as alternative options in the Rwandan market.
The preference for the two older varieties, Kirundo and Cruza, may be explained by their broad adaptability and stable yield performance across Rwanda’s agro-ecological zones (Muhinyuza et al. Reference Muhinyuza, Shimelis, Melis, Sibiya and Nzaramba2012; Placide et al. Reference Placide, Theophile, Vandamme, Claude and Thiago2022). Their disease tolerance traits are notable (Table 1 and Figure 3) (CIP 2021; Muhinyuza et al. Reference Muhinyuza, Shimelis, Melis, Sibiya and Nzaramba2012), especially given that non-optimal farming conditions often expose crops to high levels of disease and pest pressure. The stable performance of older varieties under resource-constrained conditions enhances their value to smallholder farmers (Anjichi et al. Reference Anjichi, Muasya, Gohole, Rao and Muui2005; Ficiciyan et al. Reference Ficiciyan, Loos, Sievers-Glotzbach and Tscharntke2018; Jin et al. Reference Jin, Mansaray, Jin and Li2020). All farmers participating in this study were smallholders who rely on agriculture for their livelihoods. Non-optimal farming practices – driven by financial constraints, limited access to inputs (e.g., fertilizer and pesticides) and broader household vulnerability – are commonly observed (Ojiem et al. Reference Ojiem, De Ridder, Vanlauwe and Giller2006; Vanlauwe et al. Reference Vanlauwe, Descheemaeker, Giller, Huising, Merckx, Nziguheba, Wendt and Zingore2015). In Rwanda, where warm temperatures and resource-limited farming conditions are widespread, the disease tolerance and stable yield of varieties like Kirundo and Cruza become especially valuable, contributing to their continued popularity among smallholder farmers in general.
In this context, understanding how different varieties perform under varying ecological and socio-economic conditions is also crucial for providing targeted recommendations. When cooler temperatures prevail (Figure 4), Twihaze achieves higher yields in Nyabibu and Nayamagabe districts. This may be because low-temperature environments tend to have lower disease pressure compared to warmer areas, making disease resistance a less critical trait for potato performance (Kaukoranta Reference Kaukoranta1996; Singh et al. Reference Singh, Dua, Govindakrishnan and Sharma2013). From a socio-economic perspective, Ndamira is the best for farmers who have a high crop income and consider yield as the main criterion. In contrast, Cruza is still the best potato for farmers with an intermediate and low income, for whom taste is the most important criterion (Figure 5 and Table 6). It is also a reliable choice for these farmers, as it performs well under low-input conditions (Figure S3) and demonstrates stable BW resistance across different environments (Figure S2). Additionally, Jyambere or Seka, which exhibit good BW resistance, could also be recommended for planting, depending on regional temperature (Figure S2).
Insights from on-farm ranking data combined with multiple factors
This transdisciplinary analysis, integrating biological, environmental, and socio-economic data, provides insights into potato variety performance, trait correlations, and their interactions with genotype-environment factors and farmers’ socio-economic conditions. The analysis provides insights regarding farmers’ trait preferences through a realistic experiment. Overall performance is driven by two main factors, yield and marketability, which are each part of a cluster of highly correlated traits (Figure S1). Breeders can target improvement in these traits through indirect selection on traits that are easy to screen and show high heritability (Gallais Reference Gallais1984; Khayatnezhad et al. Reference Khayatnezhad, Shahriari, Gholamin, Jamaati-e-Somarin and Zabihi-e-Mahmoodabad2011).
Farmers’ field evaluations for yield show how genotype-by-environment interactions influence potato varietal performance, and that this is driven by seasonal temperature (Figure 4, Table 5, Figure S2 and Table S5). This finding is probably the result of a diverse range of biological factors, which could not be disentangled by PLADMM analysis that links the on-farm data to the on-station genotypic values. The same is true for BW. Since the experiment was conducted over only two seasons without follow-up trials in subsequent years, this may have influenced the results. However, it is interesting that farmer rankings can be linked directly to independent biological measurements, even though improvements are needed. Despite the limitations of exploring the biological causes behind the genotype-by-environment interactions, the results have predictive value for environmental targeting of varieties. They indicate the need for better delineating the target population of environments (grouped according to where varieties will be cultivated in the future).
Marketability influences variety preferences and makes Cruza relatively high-ranked among farmers in node 2 and node 4, who have lower crop income (Figure 5). In contrast, Gisubizo, Izihirwe, Kazeneza, Kirundo, Seka, and Twihaze can be recommended to node 5 farmers, who are commercial farmers with high crop income and prioritize yield (Table 6). Interestingly, although node 5 farmers were market-oriented, their preferences for potato varieties showed relatively low variation. While this study did not include in-depth interviews with farmers in node 5 to further explore the reasoning behind their evaluations, the observed patterns allow for some interpretation within the Rwandan context.
Despite the strong demand of potato in the Rwanda’s market, the flow of market information and inputs remains limited due to weak infrastructure (Tumukunde 2015). In such an environment, market-oriented farmers may adopt a yield-first heuristic when selecting varieties, rather than considering other trait differences (Wiggins and Keats Reference Wiggins and Keats2013). Given the limited availability of market data and the cognitive burden of information processing in rural areas, their decision-making may align with the theory of rational inattention. This theory suggests that individuals optimize choices by selectively processing information under constraints of time, access, or cognitive capacity (Maćkowiak et al. Reference Maćkowiak, Matějka and Wiederholt2023). According to Naeher and Schündeln (Reference Naeher and Schündeln2022), attention is a limited resource for many Sub-Saharan African farmers, and the scarcity of available information increases the cognitive cost of acquiring it, ultimately reducing the extent to which they seek out or use such information. Building on this perspective, the variation in Table 6 may reflect those farmers targeting larger and more distant markets, where social ties with clients are weaker, and tend to favour yield and appearance over taste. Regional differences in market access may also drive diverse choices, leading market-oriented farmers to prefer locally suitable options rather than a consistent set of choices nationwide (Milner et al. Reference Milner, Wolf, Wijk and Hammond2022).
In addition, market information asymmetry and limited access to farming inputs may contribute to increasing divergence in how different types of farmers manage their fields. Commercial farmers tend to be more responsive to new ideas, information, and technologies than their less market-oriented counterparts (Adesina and Baidu-Forsen Reference Adesina and Baidu-Forson1995; Begho Reference Begho2022; Gonzalez Reference Gonzalez1965). As a result, high-income farmers may be more willing to experiment with a broader range of crop varieties. This pioneering tendency can improve their access to inputs and promote the adoption of better crop management practices. Indeed, smallholder farmers engaged in market-oriented agriculture practices often achieve higher yields than subsistence farmers, largely due to differences in crop management and farm infrastructure (Dessalegn et al. Reference Dessalegn, Mengistu and Abebe2008; Ficiciyan et al. Reference Ficiciyan, Loos, Sievers-Glotzbach and Tscharntke2018; Hlatshwayo et al. Reference Hlatshwayo, Ngidi, Ojo, Modi, Mabhaudhi and Slotow2021; Kleinwechter et al. Reference Kleinwechter, Gastelo, Ritchie, Nelson and Asseng2016). Additionally, Figure S3 shows that yield – closely linked to marketability – is influenced by input diversity.
The reported results are not conclusive on varietal differences determining whether market-oriented or higher input farmers achieve yields closer to attainable potential. Nevertheless, improved varieties have been shown to outperform older ones under optimal conditions (Ficiciyan et al. Reference Ficiciyan, Loos, Sievers-Glotzbach and Tscharntke2018). In previous research conducted in Rwanda, newer potato varieties tend to yield better than Kirundo, but only under ideal, low-stress environments (Placide et al. Reference Placide, Theophile, Vandamme, Claude and Thiago2022). These observations highlight the need for comparative trials of both old and new varieties under low-input, stress-prone conditions to evaluate their broader suitability.
From a gender perspective, the tuber appearance reveals interesting patterns of segmentation among farmers (Figure S4). Male farmers with higher input use tend to prefer varieties with marketable tuber traits more than female farmers. This pattern suggests that in Rwanda, where potatoes are a cash crop, men engaged in intensive farming favour certain varieties with attractive tuber traits more than women. This implies a market information bias in potato farming based on gender. Male farmers generally have greater access to markets and resources than female farmers, particularly when a crop is financially lucrative (Hill and Vigneri Reference Hill and Vigneri2014). These findings illustrate that Rwandan smallholder farmers make marketing and variety selection decisions within complex socio-economic and gender-related dynamics (Mungai et al. Reference Mungai, Snapp, Messina, Chikowo, Smith, Anders, Richardson and Li2016).
Given the paramount importance of potatoes in Rwanda’s food security, our research insights have significant implications for RAB and the country’s potato production. Farmers holistically recognize variety performance, considering environmental and socio-economic factors, while breeders tend to focus on specific traits needing improvement. This difference in perspective creates differences between breeders and farmers in variety selection (Vom Brocke et al. Reference Vom Brocke, Trouche, Weltzien, Barro-Kondombo, Gozé and Chantereau2010). A nuanced understanding of farmers’ perspectives enables breeders and developers to precisely target specific demographics and geographic regions, addressing gaps left by previous initiatives influenced by ambiguous marketing information or centralized development approaches. As more data becomes available in the future, this type of research contributes to a comprehensive understanding of genotype-by-environment interactions affecting potato cultivation, particularly in relation to seasonal variations. This helps breeding programmes to better target farmers’ preferences and environmental conditions. It also empowers smallholder farmers to generate new knowledge so they can better respond to challenges by selecting suitable potato varieties tailored to their fields and socio-demographic contexts.
An important limitation was found in linking on-station with on-farm data. On-farm yield may be limited by a range of factors that are not present in on-station trials. Bacterial wilts, known to occur at 18°C to 28°C (Swanson et al. Reference Swanson, Yao, Tans-Kersten and Allen2005; Williamson et al. Reference Williamson, Nakaho, Hudelson and Allen2002), showed no correlation between on-station and on-farm data in this study (Table S5). It may be because farmers struggle with disease observation accuracy (Steinke et al. Reference Steinke, van Etten and Zelan2017). Further analysis with multi-season data and additional methods like image analysis (Petrellis Reference Petrellis2017) or direct farm visits for disease estimation are needed. However, these research findings provide some evidence that research stations may not be representative of farm production conditions.
Conclusions
This study aimed at enhancing farmer-led on-farm trial to provide insights into Rwanda’s potato breeding efforts. It achieved this goal by adopting a transdisciplinary approach, integrating data from farmer-generated variety evaluations, socio-economic and environmental information, and on-station breeding trials.
Our research reveals Rwandan potato farmers generally prefer pre-1990 varieties (Cruza and Kirundo). However, post-2018 varieties are competitive and may be adopted by some farmers, even though none surpass the older varieties across all farmers and environments. This suggests that a considerable number of Rwandan potato farmers may not be in the position to achieve optimal yields from newly released varieties. In addition, the main drivers of farmers’ potato variety preferences are yield and marketability. Yield differences between potato varieties partly depend on seasonal temperatures, but the biological causes behind this could not be further elucidated. The perception of marketability seems to depend on Rwandan farmers’ priorities, i.e., consumption versus sales. Our approach reveals that gender, farm management, and economic farmer income are factors that support the relationship between potato characteristics and perceptions of marketability among Rwandan smallholder farmers.
Further research will require additional methods to enable on-farm measurements of specific stresses and to share research findings with participants. Even so, this study has clearly demonstrated the quantitative insights that can be gained from a transdisciplinary approach to on-farm testing involving farmers. Combining genotypic data, on-farm and on-station performance data, environmental and socio-economic data can give crop breeding programmes and other relevant stakeholders new insights to target breeding products. As a result, this approach of integrating data from multiple disciplines in farmer-led trial can improve food security and agricultural sustainability by increasing breeding efficiency, variety adoption, and potato productivity.***
Supplementary material
To view supplementary material for this article, please visit https://doi.org/10.1017/S0014479725100100
Data availability statement
The data and code used in this study are publicly available on GitHub, https://github.com/AgrDataSci/potato-oft-genetic-gain
Acknowledgments
We are thankful to all funders who supported this research: CGIAR Research Program on Roots, Tubers and Bananas (RTB) ‘Scaling Grant’, https://www.cgiar.org/funders/ and ATSAF – CGIAR++ junior scientists programme funding by the Arbeitsgemeinschaft Tropische und Subtropische Agrarforschung (ATSAF) (JSP-P2-B1–17, 2021–2022.) https://www.atsaf.org/en/junior-scientists-program-2/. Additional funding for research by KS, RM, and JE was provided through the 1000FARMS project (INV-031561) funded by the Gates Foundation. Also, we would like to acknowledge the support of the International Potato Center (CIP) teams in Kenya and Rwanda, the International Institute of Tropical Agriculture (IITA) and One Acre Fund in Rwanda, and the Rwanda Agricultural and Animal Resources Board (RAB). We would also like to express gratitude to all farmers for their central participation in this study, and to the data enumerators who collected the farmers’ data. The authors also acknowledge the editorial review provided by Vincent Johnson of the Bioversity-CIAT Alliance science-writing service.
Author contributions
GK: formal analysis, data curation, visualization, writing – original draft, conceptualization KS: : formal analysis, data curation, writing – review & editing, conceptualization, validation RM: investigation, data curation, writing – review & editing, conceptualization, validation JE: data curation, supervision, writing – review & editing, conceptualization, validation, GB: supervision, conceptualization, writing – review & editing, validation, PR: investigation, AN: investigation, JE: investigation, ET: investigation, TM: data curation, supervision, writing – review & editing, conceptualization, validation, SG: data curation, supervision, writing – review & editing, conceptualization, validation
Financial support
This research was funded by the CGIAR Research Program on Roots, Tubers, and Bananas (RTB) ‘Scaling Grant’, which is carried out with support from CGIAR Trust Fund and through bilateral funding agreements. For details, please visit: https://www.cgiar.org/funders/. Plus, ATSAF – CGIAR++ junior scientists programme funding (JSP-P2-B1–17, 2021–2022.), by the Arbeitsgemeinschaft Tropische und Subtropische Agrarforschung (ATSAF) support. For more information, please visit: https://www.atsaf.org/en/junior-scientists-program-2/
Competing interests
The authors declare no conflict of interest.
Ethics statement
This research received approval from the Institutional Review Board (IRB) of the Alliance of Bioversity International and CIAT. Written informed consent was obtained from all participating farmers prior to data collection. Farmers were informed about the purpose of the study, how their socio-economic data would be used, and assured that their information would remain confidential and anonymized. Participation was voluntary, and participants could withdraw at any stage without penalty.


 Open access